1136
JOURNAL OF ATMOSPHERIC AND OCEANIC TECHNOLOGY
VOLUME 25
Tornado Detection Using a Neuro–Fuzzy System to Integrate Shear and Spectral Signatures YADONG WANG, TIAN-YOU YU,
AND
MARK YEARY
School of Electrical and Computer Engineering, University of Oklahoma, Norman, Oklahoma
ALAN SHAPIRO School of Meteorology, University of Oklahoma, Norman, Oklahoma
SHAMIM NEMATI Department of Mathematics, University of Oklahoma, Norman, Oklahoma
MICHAEL FOSTER
AND
DAVID L. ANDRA JR.
National Weather Service, Norman, Oklahoma
MICHAEL JAIN National Severe Storms Laboratory, Norman, Oklahoma (Manuscript received 25 April 2007, in final form 22 October 2007) ABSTRACT Tornado vortices observed from Doppler radars are often associated with strong azimuthal shear and Doppler spectra that are wide and flattened. The current operational tornado detection algorithm (TDA) primarily searches for shear signatures that are larger than the predefined thresholds. In this work, a tornado detection procedure based on a fuzzy logic system is developed to integrate tornadic signatures in both the velocity and spectral domains. A novel feature of the system is that it is further enhanced by a neural network to refine the membership functions through a feedback training process. The hybrid approach herein, termed the neuro–fuzzy tornado detection algorithm (NFTDA), is initially verified using simulations and is subsequently tested on real data. The results demonstrate that NFTDA can detect tornadoes even when the shear signatures are degraded significantly so that they would create difficulties for typical vortex detection schemes. The performance of the NFTDA is assessed with level I time series data collected by the KOUN radar, a research Weather Surveillance Radar-1988 Doppler (WSR-88D) operated by the National Severe Storms Laboratory (NSSL), during two tornado outbreaks in central Oklahoma on 8 and 10 May 2003. In these cases, NFTDA and TDA provide good detections up to a range of 43 km. Moreover, NFTDA extends the detection range out to approximately 55 km, as the results indicate here, to detect a tornado of F0 magnitude on 10 May 2003.
1. Introduction The subjective detection of potentially tornadic storms using hook-shaped returns in a radar’s display was first documented by Stout and Huff (1953), and
Corresponding author address: Yadong Wang, 202 W. Boyd, School of Electrical and Computer Engineering, University of Oklahoma, Norman, OK 73019. E-mail:
[email protected] DOI: 10.1175/2007JTECHA1022.1 © 2008 American Meteorological Society
later was suggested as an indicator of tornadoes (Fujita 1958). However, Forbes (1981) found that more than half of the tornadoes in his study did not exhibit apparent hook signatures and suggested that hook echoes may not be a reliable indicator. A unique feature of strong azimuthal velocity difference at a constant range, termed the tornado vortex signature (TVS), was first observed by Burgess et al. (1975) and Brown et al. (1978) using a pulsed Doppler radar. The national network of Weather Surveillance Radar-1988 Doppler
JULY 2008
WANG ET AL.
(WSR-88D) has been proven to improve the probability of detection (POD) and the warning lead time for tornadoes in the United States (Polger et al. 1994; Bieringer and Ray 1996; Simmons and Sutter 2005). The basic idea of the current tornado detection algorithm (TDA) is to search for strong and localized azimuthal shear in the field of mean radial velocities (e.g., Crum and Alberty 1993; Mitchell et al. 1998). However, because of the smoothing effect caused by the radar resolution volume, the shear signature can be significantly degraded if the size of tornado is small and/or the tornado is located at far ranges (Brown and Lemon 1976). Recently, Brown et al. (2002) demonstrated that the shear signature can be enhanced using half-degree angular sampling despite the expense of slightly increasing statistical errors in velocity data. Better tornado signatures can be observed by mobile radars because of their enhanced resolution in both temporal and spatial domains (e.g., Bluestein et al. 2003; Wurman and Alexander 2006; Bluestein et al. 2007b). A conical debris envelope, a low-reflectivity eye, and multiple semiconcentric bands of reflectivity surrounding the eye have been observed using Doppler on Wheels (DOW) radar (Wurman and Gill 2000; Burgess et al. 2002). In addition, Ryzhkov et al. (2005) have shown that significant debris signatures can be observed in tornadoes using an S-band polarimetric radar. Similarly, anomalously low values of differential reflectivity ZDR, low cross-correlation coefficient h, and highreflectivity Z were also observed by a mobile, dualpolarization X-band Doppler radar (Bluestein et al. 2007a). Zrnic´ and Doviak (1975) have shown that tornado spectra can have wide and bimodal signatures that set them apart from other weather spectra. These distinct tornado spectral signatures (TSS) were subsequently verified by a pulsed Doppler radar with a significant maximum unambiguous velocity of approximately 90 m s⫺1 (Zrnic´ et al. 1977; Zrnic´ and Istok 1980; Zrnic´ et al. 1985). Recent studies have shown that spectra similar to white noise, but with significant signal power, can be observed in a tornadic region using numerical simulations and data collected from WSR-88D with operational setups (Yu et al. 2007). In that study, three complementary parameters were introduced to quantify TSS, and these features were derived from highorder spectral analysis and signal statistics. It was shown that the TSS still can be significant enough to facilitate tornado detection at far ranges, even though the shear signature may become difficult to identify. Moreover, the eigenvalues of the correlation matrix derived from the raw time series data also have a distinct distribution in the tornadic region resulting from the
1137
wide and flat features of the spectrum (Yeary et al. 2007). Although each tornadic signature described above has the potential to facilitate tornado detection to some extent, it is possible to optimally integrate all of the available signatures to improve the detection based on a single signature. A fuzzy logic methodology is ideal for addressing a complicated system that launches a decision based on multiple inputs simultaneously. Fuzzy logic–based systems have already been widely applied to weather radar for hydrometeor classification (e.g., Vivekanandan et al. 1999; Liu and Chandrasekar 2000; Zrnic´ et al. 2001). In this work, a fuzzy logic system is developed to integrate tornadic signatures in both the spectral and velocity domains. The system is further enhanced by a feedback process provided through a neural network and is termed the neuro– fuzzy tornado detection algorithm (NFTDA). This paper is organized as follows. An overview of the characterization of tornado signatures is presented in section 2. The NFTDA technique is developed in section 3 and is followed by the simulation results in section 4. The performance of NFTDA is further demonstrated and evaluated using time series data collected by the research WSR-88D (KOUN), operated by the National Severe Storms Laboratory (NSSL), and compared to the operational TDA in section 5. Finally, a summary and conclusions are given in section 6.
2. An overview of tornado signature characterization The TVS, which is exemplified by extreme values of radial velocities with opposite signs over a small azimuthal distance, has been widely used as an indicator for tornadoes (e.g., Burgess et al. 1975; Brown 1998; Brown et al. 2002). In the NSSL’s TDA, the velocity differences between adjacent gates are grouped to form a 3D feature based on multiple thresholds to facilitate tornado detection (Mitchell et al. 1998). Moreover, TSS with bimodal or white-noise-like features have been observed from both real data and simulations (e.g., Zrnic´ and Doviak 1975; Zrnic´ et al. 1985; Yu et al. 2007). It is noted that the Doppler spectrum represents a distribution of weighted radial velocities within the radar resolution volume, and the mean Doppler velocity is defined by their statistical average (i.e., the first moment). It has been hypothesized in Yu et al. (2007) that the TSS can retain enough information to facilitate tornado detection, while the TVS is degraded by the smoothing effect and becomes difficult to identify. Three feature parameters were proposed by Yu et al. (2007) to characterize the TSS. The first parameter is the spectrum
1138
JOURNAL OF ATMOSPHERIC AND OCEANIC TECHNOLOGY
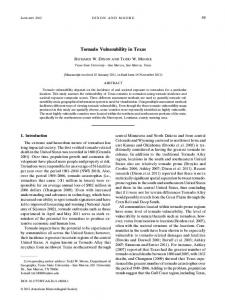
width (), which is also known as the second spectral moment. Although the spectrum width is an intuitive parameter used to describe the wide spectral feature, it is not sufficient to characterize the shape of a tornadic spectrum and is susceptible to a number of factors, such as inaccurate estimate of noise level and radar settings (Fang et al. 2004). Moreover, large spectrum widths can be observed in a nontornadic region where strong linear shear and/or low signal-to-noise ratio (SNR) are present. Two additional feature parameters—the phase of the radially integrated bispectrum (PRIB; denoted by P) and spectrum flatness s—were introduced to characterize TSS in Yu et al. (2007). Because most shape information of a pattern is retained in the phase of its Fourier coefficients (Oppenheim and Lim 1981) and the commonly used power spectrum (the secondorder spectrum) is phase blind, a third-order spectrum termed “bispectrum” was introduced to extract the phase information. In addition, the spectrum flatness, defined as the standard deviation of a Doppler spectrum (dB), is used to identify a white-noise-like feature, which is often observed if the radar’s maximum unambiguous velocity is smaller than the maximum rotational speed of a tornado vortex. Yu et al. (2007) have shown that significantly high P and low s values were obtained from spectra in a tornadic region compared to those from nontornadic regions. Furthermore, Yeary et al. (2007) reported that a white-noise-like spectrum can reflect on the distribution of the eigenvalues of the correlation matrix. It was found that regions of large eigenratios (R), defined as the ratio of minimum to maximum eigenvalues, are well correlated with wide and flat spectra in tornadic regions. Although the first tornado spectrum observed by a pulsed Doppler radar was in the mid-1970s (Zrnic´ and Doviak 1975), the readily available number of cases with recorded tornadic spectra is limited. The paucity of data is partially due to the massive storage requirements and the computational expense to process all of the raw time series data to obtain spectra in real time. The S-band KOUN radar has the capability to continuously collect volumetric time series data for several hours. Although KOUN is dual polarized, only time series from the horizontally polarized component were collected for the cases of interest. In this work, a fuzzy logic system is developed to integrate tornadic signatures, which include the velocity difference of adjacent azimuthal gates (⌬V ), spectrum width, spectral flatness, PRIB, and eigenratio. Statistical analysis of these feature parameters is presented in Fig. 1 with data collected from two tornadic events on 8 and 10 May 2003. The time series data were collected by the KOUN
VOLUME 25
radar continuously over the entire tornadic event for approximately 1 h on 10 May, but there were only two volume scans of data on 8 May. The data from the lowest two elevation angles (0.5° and 1.5°) were used to calculate the histograms, which were normalized by the total number of data used in the analysis. A tornadic case is defined by the gate where the velocity difference of its adjacent azimuthal gates is larger than 20 m s⫺1 and within the tornado damage path. Regions outside the damage path with an SNR larger than 20 dB are defined as nontornadic cases. It is shown that the tornadic cases are associated with large , ⌬V, P, and R, but small s. It is interesting to point out that the distributions of tornadic and nontornadic cases are overlapped for all of the parameters. Thus, a parameter with values in the overlapped region is not well defined for either tornadic or nontornadic cases (i.e., some degree of fuzziness is involved). As a result, a simple thresholding method may produce false results. Although the overlapping reign of ⌬V is not obvious in Fig. 1, with 1.5% of nontornadic cases having ⌬V larger than 20 m s⫺1, the number of such cases is significantly larger than the tornadic cases, because the majority of the data are from nontornadic cases. As a result, many false/miss detections may be obtained. Moreover, Yu et al. (2007) have shown cases that PRIB and spectral flatness can help to characterize the TSS while the signatures of shear and spectrum width diminish. It is important to consider these complementary tornadic features simultaneously in a detection algorithm, and a fuzzy logic is an ideal candidate.
3. Neuro–fuzzy tornado detection algorithm In this section, a fuzzy logic–based system is developed for tornado detection. The choice of fuzzy logic over other approaches, such as thresholding, decision trees, and neural networks in their pure form, is motivated by several considerations. First, as mentioned previously, strong shear, a large spectrum width, a significant eigenratio, high PRIB, and a low value of spectral flatness may be associated with a tornado vortex. The description of the degree of significance for each parameter is actually fuzzy in context, because terms like “strong,” “weak,” “large,” or “low” are used to describe their significance. On the other hand, “crisp” values are binary—these values either exceed or do not exceed a threshold. As such, the fuzzy parameters actually contain more information than the crisp ones, and the intent here is to leverage this additional information, which is otherwise typically neglected. In retrospect, thresholding approaches would be ideal if the distributions of tornadic and nontornadic cases for any
JULY 2008
1139
WANG ET AL.
FIG. 1. Normalized histograms of (top left) spectrum width, (top middle) velocity difference, (top right) PRIB, (bottom left) eigenratio, and (bottom right) spectral flatness for tornadic and nontornadic cases.
of the parameters in Fig. 1 are disjointed; however, this is rarely the case for real scenarios. Second, a fuzzy logic system can use all of the available features simultaneously to reach a conclusion, while a decision tree only uses a single parameter at each node and is exclusive for all other parameters. Moreover, fuzzy logic architecture is more flexible than a decision tree for incorporating additional parameters without readjusting all the rules. Finally, a large amount of training data is typically required to build a robust neural network system in its pure form (Marzban and Stumpf 1996). In contrast, a fuzzy logic system can be developed based on a set of rules that is obtained from a priori knowledge and/or is defined by experts. Nevertheless, the self-learning capability provided by the neural network is still attractive and is included here in this hybrid approach to develop NFTDA. As such, the neural network is used to refine the rules to optimize system performance. A similar approach of a neuro–fuzzy combination was developed by Liu and Chandrasekar (2000) for hydrometeor classification with polarimetric products. A schematic diagram of the NFTDA is depicted in Fig. 2, and a detailed description of NFTDA is presented in the following two subsections.
a. Architecture of the fuzzy logic system A fuzzy logic system can be considered a nonlinear mapping of feature parameters (i.e., inputs) to crisp outputs. In NFTDA the output is a binary detection of the presence of a tornado. This fuzzy logic system consists of the following three subsystems: “fuzzification,” “rule inference,” and “defuzzification” (Mendel 1995). In fuzzification, the five feature parameters (or crisp input) of spectrum width, velocity difference, PRIB, eigenratio, and spectral flatness are converted to fuzzy variables, by either an S-shaped curve or a Z-shaped curve membership function. An S-shaped membership function of a crisp input x is defined by two breaking points (x1 and x2) in the following equation:
F ji共x兲 ⫽
冦
0 2
冉
x ⫺ x1 x2 ⫺ x1
1⫺2 1
冉
冊
x ⬍ x1 2
x2 ⫺ x x2 ⫺ x1
x1 ⱕ x ⬍
冊
2
x1 ⫹ x2 2 ,
x1 ⫹ x2 ⱕ x ⬍ x2 2 x2 ⱕ x
共1兲
1140
JOURNAL OF ATMOSPHERIC AND OCEANIC TECHNOLOGY
VOLUME 25
FIG. 2. A schematic diagram of NFTDA is shown. A fuzzy logic system is designed to detect a tornado, while a neural network is incorporated to refine the membership functions through a self-learning process.
where i ⫽ 1, 2, . . . , 5 corresponds to the input parameter. The fuzzy variables for tornadic and nontornadic N cases are denoted by F Y i and F i , respectively, and j corresponds to either the tornadic ( j ⫽ Y ) or nontornadic ( j ⫽ N ) case. Note that a Z-shaped curve membership function is also determined by two breaking points, but with the value decreasing with the increasing value of the crisp input. The membership functions of the NFTDA are shown in Fig. 3. The fuzzy variables are the inputs to the subsystem of rule inference with an output of T Y and T N for tornadic and nontornadic cases, respectively, as shown in Fig. 2. The relationship between the input and output of rule inference is described by fuzzy rules. The process of evaluating the strength of each rule is called rule inference. In NFTDA, the Mamdani system is selected for the rule inference (Ross 2005). The maximum product (or correlation product) is used to set the rule strength, which is defined as the product of the input fuzzy variables. Finally, the output of the rule inference, which is still a fuzzy variable, is converted to a crisp output of a precise quantity through the subsystem of defuzzification. A maximum defuzzifier, defined as the maximum of T Y and T N, is implemented in NFTDA, and the final binary detection is made. In other words, a positive detection of the presence of a tornado is selected when T Y ⬎ T N; otherwise, it is a nontornadic case.
b. Neural network for system optimization The membership function is one of the most important components in a fuzzy logic system. It can be obtained from intuition, inference, rank ordering, neural networks, and/or inductive reasoning (e.g., Ross 2005). In NFTDA, the shape of the membership functions was determined using prior knowledge of the relationship between the feature parameters and fuzzy variables for both tornadoes and nontornadoes. For example, it is expected that a tornado is likely to have strong ⌬, large , high P, high R, and low s. Therefore, only an S- or Z-shaped membership function is employed. The two breaking points of the S-shaped membership function of spectrum width for the tornadic case is exemplified in the upper-left panel of Fig. 3. The breaking points of each membership function are initialized based on the results of statistical analysis in Fig. 1. Subsequently, the breaking points are adjusted through a training process using a neural network as depicted in Fig. 2. In the training process, all of the collected tornadic data are divided into two parts—one part is for training and the other part is for testing. The data from two radar volume scans (0341 and 0353 UTC 10 May 2003) at the lowest elevation angle are used as a training dataset. Additional data generated from analytical simulations are used as supplemental training data. Each training data point will be assigned one input state: either tor-
JULY 2008
WANG ET AL.
1141
FIG. 3. Membership functions for tornadic and nontornadic cases: (a) spectrum width, (b) velocity difference, (c) PRIB, (d) eigenratio, and (e) spectral flatness.
nado or nontornado. Corresponding detection results of this fuzzy logic system will be obtained based on present membership functions. If the detection results do not match the input states, the membership functions will be modified by adjusting the breaking points. The training process is achieved by minimizing the error between the known input states and the detection results through an iterative process (Liu and Chandrasekar 2000). Note that the membership functions shown in Fig. 3 were obtained after the training process was completed.
4. Simulation results The NFTDA is tested and verified using simulated level I time series data of an idealized vortex (Rankine vortex) generated from a radar simulator developed by Yu et al. (2007). Initially, a modeled Doppler spectrum is obtained from a superposition of weighted scatterers’ velocities in the radar resolution volume. The weights are determined by the reflectivity, antenna pattern, and range-weighting function. If the scatterers’ radial velocity exceeds the maximum unambiguous velocity (a), it is aliased into the interval of [⫺a, a]. Consequently, the time series data are obtained from the inverse Fourier transform of the modeled spectrum with a desirable SNR. A detailed description of the simulator is provided in Yu et al. (2007). In this work, a tornado located
1 km southwest of the center of a mesocyclone is simulated. Both the tornado and mesocyclone are modeled by a Rankine combined vortex model with a maximum tangential velocity of 50 and 15 m s⫺1, respectively. The radius of the mesocyclone is 2 km and three different tornadoes’ radii (rt) are used in the simulation. Moreover, uniform reflectivity (Wood and Brown 1997; Brown 1998; Brown et al. 2002) is applied to the tornado and a broad Gaussian-shaped reflectivity is used for the mesocyclone. The level I time series data are simulated for a WSR-88D with a 1° beamwidth (b) and a 250-m range resolution (⌬R). The maximum unambiguous velocity is 35 m s⫺1. The mean Doppler velocities and spectrum widths are estimated by the autocovariance method (Doviak and Zrnic´ 1993). The spectral flatness, PRIB, and eigenratio are estimated by the methods described in Yu et al. (2007) and Yeary et al. (2007). It has been shown that tornado’s shear and spectral signatures depend on several factors such as the range between the tornado and radar, the size of the tornado, and the relative location of a tornado in the radar’s resolution volume (e.g., Zrnic´ et al. 1977; Brown et al. 2002; Yu et al. 2007). In this work, the ratio of detection, defined as ROD ⫽ Nd/Nt, is introduced to quantify the performance of NFTDA in the simulation, where Nt is the total number of tornadic cases generated for the test and Nd is the number of cases detected. For each
1142
JOURNAL OF ATMOSPHERIC AND OCEANIC TECHNOLOGY
VOLUME 25
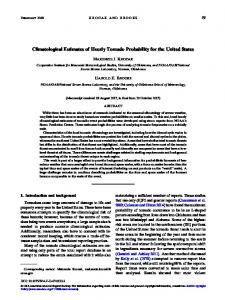
FIG. 4. Statistical analysis of the performance of NFTDA as a function of normalized range for ⌬R/rt ⫽ 1.25, 2.5, and 5.0, where ⌬R ⫽ 250 m is the range resolution. The abscissa is the normalized range with r0 the distance from the radar to the center of the resolution volume, b the beamwidth, and rt the radius of the tornado. The NFTDA results are denoted by thick solid lines. The results from the detection based on a threshold of velocity difference of 20 m s⫺1 (TTD) are also provided for comparison and are denoted by the thin dashed lines.
realization 121 tornado locations in the radar resolution volume are simulated with 11 ⫻ 11 uniform grids in azimuthal and range directions at a given range (i.e., Nt ⫽ 121). The radar resolution volume of interest is centered at an azimuth of 0°. To calculate the velocity difference, signals from two additional volumes centered at azimuth angles of ⫺1° and 1° are simulated at each range. For each tornado location, the five feature parameters (velocity difference, spectrum width, spectral flatness, PRIB, and eigenratio) are obtained as the inputs of NFTDA. The ratio of detection can be thought of as the POD for different tornado locations within the radar resolution volume. The ROD as a function of the normalized range is presented in Fig. 4 for the three tornado sizes that are defined by ⌬R/rt, where rt ⫽ 50, 100, and 200 m. The normalized range is defined as r0b/rt and is a measure of the transverse dimension of the radar resolution volume relative to the tornado size, where r0 is the range from the radar to the center of resolution volume. Each data point represents the mean ROD from 50 realizations, and each one has a different noise sequence added to the time series data. For the purposes of comparison, a tornado detection solely based on the thresholding of velocity difference is also implemented and is termed the thresholding tornado detection (TTD). The ROD from the TTD using a threshold
of 20 m s⫺1, one of the thresholds used in the NSSL’s TDA (Mitchell et al. 1998), is provided in Fig. 4. Note that both the range and range resolution are normalized by the tornado’s radius so that the detection result is scalable for radar with different beamwidths and range resolutions. It is evident that NFTDA provides higher RODs than TTD, especially at far ranges for the three tornado sizes. For example, NFTDA and TTD both have RODs of approximately 100% when the normalized distance is smaller than 8.7 and ⌬R/rt ⫽ 1.25 (i.e., a relatively large tornado). When the range increases, ROD from TTD declines because of the diminishing shear signatures. However, NFTDA still has high RODs because spectral signatures are still evident enough to facilitate the detection. Although the performance of TTD can be improved by lowering the threshold, false detections will likely increase. Note that NFTDA has higher RODs than TTD under the conditions of tornadoes associated with nonuniform reflectivities, for example, doughnut-shaped reflectivity. In practice, several factors can limit the performance of NFTDA, such as the degraded quality of the parameters caused by low SNRs and the fact that the radar actually samples the storms aloft resulting from the earth curvature. To better understand the strengths and weaknesses of NFTDA, it is advantageous to investigate the regions
JULY 2008
WANG ET AL.
1143
FIG. 5. (a) A contour plot of the values of velocity difference for 121 tornado locations is shown for ⌬R/rt ⫽ 5 and r0b/rt ⫽ 7. The regions where NFTDA and TTD have positive detections are depicted by white and black lines, respectively. (bottom) Spectra from three sample locations (A, B, and C) and the five parameters are shown from left to right. (b) In location A, both NFTDA and TTD have miss detections; (c) in location B, NFTDA has an accurate detection but TTD misses; (d) in location C, both NFTDA and TTD have good detections.
where NFTDA and TTD detect and miss. One realization of the velocity difference for 121 tornado locations with the resolution volume, defined by 1° beamwidth, 250-m resolution, and a normalized range of 7, is exemplified in the upper panel of Fig. 5 for ⌬R/rt ⫽ 5. Note that the tornado is present for all 121 cases. TTD has 20 positive detections, which results in an ROD of 16.5%. It is interesting to point out that large velocity differences occur if a tornado is located closer to the boundaries of a radar resolution volume in azimuth and toward the center of the radar resolution volume in range. If an ideal tornado with a size smaller than the radar resolution volume is centered at an azimuth angle of ⫺0.5° (i.e., the boundary of the radar beam) and the center of the gate, then the mean Doppler velocities from the two adjacent radar volumes in the azimuth (the one centered at 0° and the other one centered at ⫺1°) have the same magnitude but opposite signs, because of the symmetry of the vortex and radarweighting functions. Thus, the maximum velocity difference is obtained. If the tornado is located toward the center of the radar beam or the boundaries of a range gate, the velocity difference decreases. For example, if a small tornado is located at the center of the resolution volume, the mean Doppler velocity is ideally zero be-
cause of the symmetry of the spectrum. Additionally, the magnitude of the mean Doppler velocity from either of the adjacent volumes centered at ⫺1° or 1° should be relatively small because of the range dependence of the vortex velocities from a small tornado. For a relatively large tornado (rt ⫽ 200 m), a velocity difference larger than 20 m s⫺1 is observed for all 121 tornado locations at the normalized distance of 7. Therefore, an ROD of 100% is obtained as shown in Fig. 4. In contrast, the region of positive NFTDA detections is denoted by white lines with an ROD of 73.5% in Fig. 5. NFTDA misses the detection when the tornado is located at the boundaries of a radar resolution volume in range. Spectra from the three locations, denoted by A, B, and C in the upper panel of Fig. 5, are depicted from left to right in the lower panels, respectively. At location A, both NFTDA and TTD miss the detection of the tornado because neither the spectral nor the shear signature is significant enough. It is interesting to point out that although the velocity difference at locations A and B are similar and small, the spectrum from location B is wider and more flattened than the one from location A. As a result, prominent spectral features assist the NFTDA to have a positive detection at
1144
JOURNAL OF ATMOSPHERIC AND OCEANIC TECHNOLOGY
VOLUME 25
FIG. 6. Comparisons of the detection results from TDA-KOUN and NFTDA-KOUN, which are denoted by blue triangles and red circles, respectively, for both tornadoes on 8 and 10 May 2003. Moreover, the TDA results from the operational WSR-88D at Twin Lakes, OK (TDAKTLX), are depicted by black upward triangles. The location of both KOUN and KTLX is indicated by black asterisks. The time stamps from TDA-KOUN, NFTDA-KOUN, and TDAKTLX are denoted by blue, red, and black boxes, respectively. The detection of hits from each approach is connected by a solid line to show the time continuity. Ground damage paths with Fujita scales are depicted by color-shaded contours.
B, which TTD misses. Both NFTDA and TTD have positive detections at location C, where the characteristic spectral and shear features are evident.
5. Performance evaluations a. Description of the experiments The performance of NFTDA is further assessed using two tornadic events in central Oklahoma on 8 and 10 May 2003. The tornado outbreaks on 10 May are of primary interest because continuous time series data were collected by KOUN for the entire event. The National Climatic Data Center (NCDC) reported that three tornadoes from the same supercell thunderstorm occurred in central Oklahoma from 0329 to 0425 UTC 10 May 2003 (see information online at http:// www.ncdc.noaa.gov). The first tornado touched down
at 0329 UTC and had traveled 18 mi for approximately 37 min before dissipating. The maximum intensity of this tornado was reported at F3 on the Fujita scale. The second tornado, which was estimated to be of F1 maximum intensity, touched down approximately 4 mi south of Luther, Oklahoma, at 0406 UTC and had lasted for approximately 9 min with 3 mi of track. The final tornado occurred between 0415 and 0424 UTC with a maximum intensity of F0. These tornadoes showed discontinuous tracks and collectively lasted approximately 56 min, which is similar to the multiple-cores mesocyclone described by Burgess et al. (1982) and Adlerman et al. (1999). The tornado damage path with the Fujita scale from the ground survey is presented in the upper portion of Fig. 6. The damage path of the 8 May tornado is also included in the lower portion of the figure. The NCDC has reported that this tornado had a maximum intensity
JULY 2008
1145
WANG ET AL.
TABLE 1. Comparison of NFTDA-KOUN, TDA-KOUN, and TDA-KTLX for 8 and 10 May 2003 tornadoes. The time index of each volume scan for both KOUN and KTLX is given in the first column. The detection result and the range of detection are presented for the three methods TDA-KOUN
NFTDA-KOUN
Time (UTC) KOUN/KTLX
Detection result
Range (km)
0329/0329
0359/0359
Hit False Hit False Hit Hit False Hit False Miss
35.188 33.336 38.892 46.352 38.892 40.744 42.596 42.596 33.336 N/A
0405/0404
Miss
0411/0409 0417/0419 2230/2230 2236/2235
0335/0334 0341/0339 0347/0349 0353/0354
Detection result
TDA-KTLX
Range (km)
10 May 2003 Hit
35.625
Hit
37.625
Hit Hit
39.625 40.625
Hit
42.625
Miss
N/A
N/A
Hit
48.125
False Miss
46.30 N/A
Miss False False False
N/A 25.928 31.484 35.188
Hit Hit 8 May 2003 Hit Hit
POD FAR CSI
55.6% 61.5% 29.4%
of F4 and had traveled approximately 18 mi from 2210 to 2238 UTC. However, the collection of time series data by KOUN did not start until approximately 2230 UTC, and therefore only two volume scans of the data are associated with the tornado.
b. Experimental results All of the feature parameters were calculated from the raw time series data collected by KOUN in Norman, Oklahoma. Subsequently, NFTDA was applied to the data from the lowest elevation angle of 0.5° with SNR larger than 20 dB. The output of NFTDA (denoted NFTDA-KOUN) is a binary decision of whether the tornado is present or not. The NSSL’s TDA was also applied to the KOUN level II data and the detection results are abbreviated by TDA-KOUN. For the verification of the detections from NFTDA-KOUN and TDA-KOUN, the tornado damage path from the ground survey is used as one of the objective references. However, the damage path may not be available in suburban areas and can be different from the real tornado location. The limitation of using the damage path to verify the performance of the detection algorithm is discussed in Witt et al. (1998). Moreover, TDA
90.9% 0% 90.9%
Detection result
Range (km)
Hit False Hit
27.358 28.968 27.358
52.625 55.375
Hit Hit False Hit False Hit False Hit False Hit Hit
25.749 25.749 27.358 25.749 27.358 27.358 28.968 27.358 30.577 28.968 32.165
24.875 29.375
Hit Hit
9.656 11.265
100% 33.3% 75%
results from the KTLX radar (denoted TDA-KTLX) are used as another reference, because the maximum distance between the KTLX and the 10 May tornadoes is approximately 32 km, and it is expected that the TDA will provide accurate and reliable detections for most cases at such relatively short ranges (Mitchell et al. 1998). In addition to both objective references, we carefully examine both spectral and shear signatures for each detection and consequently classify the results as “hit,” “miss,” or “false” detections; hit indicates that the tornado is accurately detected, miss is assigned if no tornado is detected when a tornado is present, and false is given if either the location of detection is not within the vicinity of the damage path or neither tornadic signature was observed. Note that the damage path could be different from the location of radar detection, which can be caused by the tilt of the tornado, the width of the radar beam, and the limitation of the mechanical accuracy of the radar for determining the azimuth (Speheger 2006). Comparisons of the detections from NFTDA-KOUN, TDA-KOUN, and TDA-KTLX for both 8 and 10 May tornadoes are summarized in Table 1. Note that only these TDA-KTLX detections with
1146
JOURNAL OF ATMOSPHERIC AND OCEANIC TECHNOLOGY
time indexes close to KOUN detections are included in the table. The comparisons of NFTDA-KOUN and TDAKOUN are divided into three time periods. In the first period, from 0329 to 0353 UTC, the tornado is detected by both TDA-KOUN and NFTDA-KOUN. The maximum range of detection during this period is approximately 42.6 km for both algorithms. All of the locations detected by NFTDA-KOUN agree well with the tornado damage path, as shown in Fig. 6, while there are few false detections from TDA-KOUN. The detections from TDA-KOUN and NFTDA-KOUN are denoted by blue downward triangles and red filled circles, respectively. The false detection of TDA-KOUN can be caused by a number of factors, such as low SNR, velocity aliasing, and assigning issues in the algorithm. For example, the two false detections from TDA-KOUN— one is at (4, 32) km from 0329 UTC and the other one is at (37, 25) km from 0335 UTC—were caused by low SNR in these regions (between ⫺8.3 and 7 dB). Note that KOUN is located at the origin in Fig. 6. Another false detection from 0353 UTC is located at (14, 42) km, where strong and localized azimuthal shears were observed but were caused by velocity aliasing. In the second period, from 0405 UTC to the demise of the third tornado at 0417 UTC, the TDA-KOUN has only one detection at 0411 UTC, but it is approximately 6 km away from the damage path (i.e., a miss). On the other hand, NFTDA-KOUN still provides robust and accurate detections that are consistent with the damage path throughout the entire period. The maximum detection range of NFTDA-KOUN in this period is 55.375 km. According to the NCDC, tornadoes were reported at F0–F1 scales during this period. In general, the velocity differences are relatively small (⬍35 m s⫺1), and therefore TDA-KOUN cannot provide reliable detections. On the other hand, NFTDA-KOUN has hits at 0411 and 0417 UTC because TSSs are still evident. The third time period is the single volume scan at 0359 UTC and neither algorithm has a hit, despite the presence of damage on the ground. In this case, the maximum velocity difference is smaller than 28 m s⫺1. Additionally, spectra from the region of the damage path do not exhibit white-noise-like features and they have relatively small spectrum widths. This can occur if the tornado is weakening and the maximum rotational velocity of the vortex is smaller than the maximum unambiguous velocity. Nevertheless, NFTDA-KOUN still has positive detections for data from two higher elevation angles of 1.5° and 2.5°. For the 8 May case, it is evident that NFTDA-KOUN has hits for both times (recall that KOUN data collection did not begin until 2230 UTC), while TDA-KOUN
VOLUME 25
produces three false detections. Furthermore, it is shown in Fig. 6 and Table 1 that the TDA-KTLX has hits for both 8 and 10 May cases, although a number of false detections can also be observed. The results from both tornadic events suggest that TDA can accurately detect tornadoes at close ranges, but it has limited performance if the tornado is weak and/or is located at far ranges. On the other hand, the NFTDA is robust and can extend the tornado detection of the NSSL’s TDA up to approximately 55 km. To quantify the performance, the scoring method described in Mitchell et al. (1998) was applied. The POD, false-alarm ratio (FAR), and critical success index (CSI) are defined by POD ⫽ a/(a ⫹ c), FAR ⫽ b/(a ⫹ b), and CSI ⫽ a/(a ⫹ b ⫹ c), where a, b, and c represent hit, false, and miss, respectively. The scoring statistics shown in Table 1 were calculated from all of the detections shown in Fig. 6. For these two tornadic events, it is evident that NFTDA-KOUN can improve the shearbased TDA-KOUN to provide high POD, low FAR, and high CSI. In addition, TDA-KTLX has a perfect POD of 100%, with maximum detection of approximately 32 km, while NFTDA-KOUN has a comparable POD of 91%, with maximum detection of approximately 55 km. Moreover, NFTDA has the lowest FAR among the three approaches.
6. Summary and conclusions Strong and localized azimuthal shears have been the primary feature for the operational and research tornado detection algorithm of the WSR-88D. However, the shear signature deteriorates with range because of the smoothing effect by the increasing radar resolution volume. In addition, tornado spectral signatures (TSSs) were reported in the 1970s, and recently TSSs were characterized using spectrum width, bispectrum analysis, signal statistics, and eigenratios. In this work a novel algorithm based on fuzzy logic was developed to integrate complementary information of spectral and shear signatures with the goal of improving tornado detection. A fuzzy logic system is able to launch a decision based on simultaneous multiple inputs with fuzzy descriptions. The system is further enhanced by a training process of a neural network. This hybrid approach is termed the neuro–fuzzy tornado detection algorithm (NFTDA). In this paper, the architecture of NFTDA was presented and discussed. The feasibility of NFTDA was first tested using numerical simulations of Rankine vortices of various sizes and distances from the radar. In addition, an intuitive tornado detection using a single threshold of azimuthal velocity difference (TTD) was
JULY 2008
WANG ET AL.
implemented and used as a baseline for shear-based TDA. A ratio of detection (ROD) was defined to quantify the POD for different tornado locations within the radar resolution volume. Statistical analysis of ROD has shown that both NFTDA and TTD have significantly high ROD for large tornadoes at close ranges. However, for the cases for which a tornado is small and/or located at far ranges, NFTDA has a higher ROD than TTD because NFTDA can still leverage off TSS to provide reliable detection. To further verify NFTDA, it was compared with both research and operational TDA for two tornadic events in Oklahoma on 8 and 10 May 2003. It is evident that NFTDA can extend the range of detection as suggested in the simulations. The POD, FAR, and CSI were subsequently derived from these cases. Although the number of cases is limited, the statistics of the scoring indicate that NFTDA can significantly improve the conventional TDA with enhanced POD and low FAR. More cases of various conditions, including nonsupercell tornadoes, are needed for a thorough and comprehensive analysis. Furthermore, NFTDA is flexible enough to include additional feature parameters, such as differential reflectivity and correlation coefficient, from a polarimetric radar. NFTDA can also be easily adapted to other radars without major modifications, such as the lowcost and low-power X-band radars developed by the Center for Collaborative Adaptive Sensing of the Atmosphere (CASA). Acknowledgments. This work was partially supported by the DOC-NOAA NWS CSTAR program through Grant NA17RJ1227. In addition, this work was supported in part by the National Science Foundation through ATM-0532107 and the Engineering Research Centers Program of the National Science Foundation under NSF Cooperative Agreement EEC-0313747. Any opinions, findings, and conclusions or recommendations expressed in this material are those of the author(s) and do not necessarily reflect those of the National Science Foundation. The authors would also like to thanks the NSSL staff for the collection of level I data and the WFO in Norman for providing the ground damage survey. REFERENCES Adlerman, E., K. Droegemeier, and R. Jones, 1999: A numerical simulation of cyclic mesocyclogenesis. J. Atmos. Sci., 56, 2045–2069. Bieringer, P., and P. S. Ray, 1996: A comparison of tornado warning lead times with and without NEXRAD Doppler radar. Wea. Forecasting, 11, 47–52. Bluestein, B. H., W.-C. Lee, M. Bell, C. C. Weiss, and A. L.
1147
Pazmany, 2003: Mobile Doppler radar observations of a tornado in a supercell near Bassett, Nebraska, on 5 June 1999. Part II: Tornado-vortex structure. Mon. Wea. Rev., 131, 2968–2984. ——, M. M. French, R. L. Tanamachi, S. Frasier, K. Hardwick, F. Juyent, and A. L. Pazmany, 2007a: Close-range observations of tornadoes in supercells made with a dual-polarization, Xband, mobile Doppler radar. Mon. Wea. Rev., 135, 1522– 1543. Bluestein, H. B., C. C. Weiss, M. M. French, E. M. Holthaus, R. L. Tananmachi, S. Frasier, and A. L. Pazmany, 2007b: The structure of tornadoes near Attica, Kansas, on 12 May 2004: High-resolution, mobile, Doppler radar observations. Mon. Wea. Rev., 135, 475–506. Brown, R. A., 1998: Nomogram for aiding the interpretation of tornadic vortex signatures measured by Doppler radar. Wea. Forecasting, 13, 505–512. ——, and L. R. Lemon, 1976: Single Doppler radar vortex recognition. Part II: Tornadic vortex signatures. Preprints, 17th Conf. on Radar Meteorology, Seattle, WA, Amer. Meteor. Soc., 104–109. ——, ——, and D. W. Burgess, 1978: Tornado detection by pulsed Doppler radar. Mon. Wea. Rev., 106, 29–38. ——, V. T. Wood, and D. Simians, 2002: Improved tornado detection using simulated and actual WSR-88D data with enhanced resolution. J. Atmos. Oceanic Technol., 19, 1759– 1771. Burgess, D. W., L. R. Lemon, and R. A. Brown, 1975: Tornado characteristics revealed by Doppler radar. Geophys. Res. Lett., 2, 183–184. ——, V. T. Wood, and R. A. Brown, 1982: Mesocyclone evolution statistics. Preprints, 12th Conf. on Severe Local Storms, San Antonio, TX, Amer. Meteor. Soc., 422–424. ——, M. A. Magsig, J. Wurman, D. C. Dowell, and Y. Richardson, 2002: Radar observations of the 3 May 1999 Oklahoma City tornado. Wea. Forecasting, 17, 456–471. Crum, T. D., and R. L. Alberty, 1993: The WSR-88D and the WSR-88D operational support facility. Bull. Amer. Meteor. Soc., 74, 1669–1687. Doviak, R. J., and D. S. Zrnic´ , 1993: Doppler Radar and Weather Observations. Academic Press, 562 pp. Fang, M., R. J. Doviak, and V. Melniko, 2004: Spectrum width measured by WSR-88D: Error sources and statistics of various weather phenomena. J. Atmos. Oceanic Technol., 21, 888–904. Forbes, G. S., 1981: On the reliability of hook echoes as tornado indicators. Mon. Wea. Rev., 109, 1457–1466. Fujita, T., 1958: Mesoanalysis of the Illinois tornadoes of 9 April 1953. J. Meteor., 15, 288–296. Liu, H., and V. Chandrasekar, 2000: Classification of hydrometeors based on polarimetric radar measurements: Development of fuzzy logic and neuro-fuzzy system, and in situ verification. J. Atmos. Oceanic Technol., 17, 140–164. Marzban, C., and G. J. Stumpf, 1996: A neural network for tornado prediction based on Doppler radar-derived attributes. J. Appl. Meteor., 35, 617–626. Mendel, J. M., 1995: Fuzzy logic systems for engineering: A tutorial. Proc. IEEE, 83, 345–377. Mitchell, E. D., S. V. Vasiloff, G. J. Stumpf, A. Witt, M. D. Eilts, J. T. Johnson, and K. W. Thomas, 1998: The National Severe Storms Laboratory tornado detection algorithm. Wea. Forecasting, 13, 352–366.
1148
JOURNAL OF ATMOSPHERIC AND OCEANIC TECHNOLOGY
Oppenheim, A. V., and J. S. Lim, 1981: The importance of phase in signals. Proc. IEEE, 69, 529–541. Polger, P. D., B. S. Goldsmith, and R. C. Bocchierri, 1994: National Weather Service warning performance based on the WSR-88D. Bull. Amer. Meteor. Soc., 75, 203–214. Ross, T. J., 2005: Fuzzy Logic with Engineering Applications. John Wiley & Sons, 628 pp. Ryzhkov, A. V., T. J. Schuur, D. W. Burgess, and D. S. Zrnic, 2005: Polarimetric tornado detection. J. Appl. Meteor., 44, 557–570. Simmons, K. M., and D. Sutter, 2005: WSR-88D radar, tornado warnings, and tornado casualties. Wea. Forecasting, 20, 301– 310. Speheger, A. D., 2006: On the imprecision of radar signature locations and storm path forecasts. Natl. Wea. Dig., 30, 3–10. Stout, G. E., and F. A. Huff, 1953: Radar records Illinois tornadogenesis. Bull. Amer. Meteor. Soc., 34, 281–284. Vivekanandan, J., D. S. Zrnic, S. M. Ellis, R. Oye, A. V. Ryzhkov, and J. Straka, 1999: Cloud microphysics retrieval using Sband dual-polarization radar measurements. Bull. Amer. Meteor. Soc., 80, 381–388. Witt, A., M. D. Eilts, G. J. Stumpf, E. D. Mitchell, J. T. Johnson, and K. W. Thomas, 1998: Evaluating the performance of WSR-88D severe storm detection algorithm. Wea. Forecasting, 13, 515–518. Wood, V. T., and R. A. Brown, 1997: Effects of radar sampling on single-Doppler velocity signatures of mesocyclones and tornadoes. Wea. Forecasting, 12, 929–939. Wurman, J., and S. Gill, 2000: Finescale radar observations of the
VOLUME 25
Dimmitt, Texas (2 June 1995), tornado. Mon. Wea. Rev., 128, 2135–2163. ——, and C. Alexander, 2006: Scales of motion in tornadoes what radars cannot see what scale circulation is a tornado. Preprints, 22th Conf. on Severe Local Storms, Hyannis, MA, Amer. Meteor. Soc., P11.6. [Available online at http:// ams.confex.com/ams/pdfpapers/82353.pdf.] Yeary, M., S. Nemati, T.-Y. Yu, and Y. Wang, 2007: Tornadic time series detection using eigen analysis and a machine intelligence-based approach. IEEE Geosci. Remote Sens. Lett., 4, 335–339. Yu, T.-Y., Y. Wang, A. Shapiro, M. Yeary, D. S. Zrnic, and R. J. Doviak, 2007: Characterization of tornado spectral signatures using higher order spectra. J. Atmos. Oceanic Technol., 24, 1997–2013. Zrnic´ , D. S., and R. J. Doviak, 1975: Velocity spectra of vortices scanned with a pulsed-Doppler radar. J. Appl. Meteor., 14, 1531–1539. ——, and M. Istok, 1980: Wind speeds in two tornadic storms and a tornado, deduced from Doppler spectra. J. Appl. Meteor., 19, 1405–1415. ——, R. J. Doviak, and D. W. Burgess, 1977: Probing tornadoes with a pulse Doppler radar. Quart. J. Roy. Meteor. Soc., 103, 707–720. ——, D. W. Burgess, and L. D. Hennington, 1985: Doppler spectra and estimated wind-speed of a violent tornado. J. Climate Appl. Meteor., 24, 1068–1081. ——, A. Ryzhkov, J. Straka, Y. Liu, and V. Chandrasekar, 2001: Testing a procedure for automatic classification of hydrometeor types. J. Atmos. Oceanic Technol., 18, 892–913.