Available online at www.sciencedirect.com
ScienceDirect Procedia Environmental Sciences 32 (2016) 364 – 372
International Conference – Environment at a Crossroads: SMART approaches for a sustainable future
Tourism, basic functionality versus complementary component of the territorial systems in Romania Radu-Daniel Pintiliia,b*, Daniel Peptenatua,b,, Alexandra Grecub, Ana-Maria Ilieb, AdrianGabriel Simionb a
University of Bucharest – Faculty of Geography, Department of Human and Economic Geography, 1, Nicolae Balcescu Blvd, Bucharest, Romania, 010041 b University of Bucharest – Research Center for Integrated Aalysis and Territorial Management, 4-12, Regina Elisabeta Blvd, Bucharest, Romania, 030018.
Abstract The tourism is nowadays an economic component that must be taken into account, a complementary sub-branch for the economic development of some territorial systems, especially of those with specific resources. The hypothesis of the study is to reveal how tourism functionality of a territory is a dominant or a complementary one. On the other hand it also shows the role of the tourism phenomena in shaping the basic functionality of some local economies. The methodology consists in a series of statistical analysis of data, for a period of 13 years (2000-2012), containing at administrative unit level and NACE code, evolution of the number of companies, particularly those operating in Tourism, the number of employees, turnover and profit. The results are represented by a series of statistical and cartographic detailed analysis, showing some correlation variations. For example: how the variation of the total profit is influenced by the variation of the turnover, of the number of companies and of number of employees. This are able to widely conclude the present contribution of the tourism sector in the local economy, to show if t he economic functionality of a territorial systems belong to the tourism sector or there is also other economic activities t hat contribute to the complexity of the economic profile. © 2016 The Authors. Published by Elsevier B.V This is an open access article under the CC BY-NC-ND license © 2016 The Authors. Published by Elsevier B.V. (http://creativecommons.org/licenses/by-nc-nd/4.0/). Peer-review under responsibility of the organizing committee of ECOSMART 2015. Peer-review under responsibility of the organizing committee of ECOSMART 2015 Keywords: Tourism activities, complementarity, territorial systems, integrated development, econometric analysis
* Corresponding author. Tel.: +4-078-899-0060; E-mail address:
[email protected]
1878-0296 © 2016 The Authors. Published by Elsevier B.V. This is an open access article under the CC BY-NC-ND license (http://creativecommons.org/licenses/by-nc-nd/4.0/). Peer-review under responsibility of the organizing committee of ECOSMART 2015 doi:10.1016/j.proenv.2016.03.042
Radu-Daniel Pintilii et al. / Procedia Environmental Sciences 32 (2016) 364 – 372
1.
Introduction
Tourism is the sector of national economy, that knew the fastest fluctuation in both, the dynamics and the structure of the phenomenon. Due to the fact that an economic sector is still highly sensitive to changes in economic trends, it may be considered an economic marker. Thus, tourism could be at a time of economic indicator endowed with sensory capabilities, because it may reflect levels of fluctuation of an economy. At least in Romania, this was revealed in 2007-2008, with the onset, the global economic and financial crisis. This has been highlighted in the product chain effect on the development of both global, regional or local. Tourism could have a positive impact and multiplier effect, felt directly through the creation of more jobs, improve transport infrastructure. Its effects could be felt indirectly, through the development of complementary infrastructure or other areas, such as retail, construction, manufacturing, post and telecommunications, even the development of those companies, where tourism is the main activity [1, 2]. After this period of boom, with the onset of the global crisis first affected sector, which recorded decrease in activity was the tourism sector. However the tourism sector, no matter how sensitive can be the intensity and frequency impulses of the whole economy, it can be a real engine of development. It can help in the development of other economic branches chain, but where importance is overwhelming, can influence the evolutionary trajectory of the entire system. Over time, researchers and specialists from various fields (economics, sociology, geography etc.) analyzed the impact of tourism and sustainable tourism. But the principles of sustainable development cannot be transposed onto tourism as a specific economic and social activity [3]. The most pragmatic numerous studies analyzing the economic impact remain the same, whether at national, regional or even local. Following studies, they acknowledged that tourism contributes to economic growth, and conversely, growth and well-being contributes to the development of this sector [4, 5, 6, 7, 8, 9]. An exhaustive analysis of this phenomenon is conducted by the World Tourism Organization, the most important international body such powers. Even in one of its reports, it stated that the contribution of tourism worldwide is about 10% of GDP, with slight growth trend [10]. If global scale, this contribution may seem one of secondary importance, zoom to a much lesser scale analysis (micro level), its importance may even reach 100%. It is those local economies, the mono specialized economies, where tourism activities are essential because their income is provided almost exclusively from tourism activities. 2.
Material and Methods
To highlight the importance of tourism phenomenon in Romania some statistical data from 2001 until 2011 were used. They were obtained from some public and private institutions from Romania, and followed the trend development of some key economic indicators such as number business, profit, number of firms and number of employees, however at NACE codes (Classification of Activities of National Economy). In a first phase, from the total administrative units of Romania, those units with tourism activities were selected. They were selected so that the list of NACE codes, have codes 55, 79 and 91. It should also be noted that, in order not to induce errors in analysis, our selection exclude the codes belonging to catering services. A decision was taken because practice has shown that not all such activities are included in tourism. To observe the extent of the tourism phenomenon in these localities, the four main indicators were summed for each individual year. To avoid certain distortions in the analysis that can be induced by demographic size of each administrative unit, these totals were reported in total economic activity, per administrative territorial unit. However, the latter method could learn and share they have tourism activities in all economic activities, each administrative unit and for each year starting from 2001 and ending with 2011, until the available statistical data disposal. With software for processing and interpretation of statistical data (R-Software), they were analysed and processed, resulting in the certain graphics useful in interpreting the tourist phenomenon in Romania. 3.
Results
In Romania, the development of tourism sector in post-December 89 period occurred in the absence of an adequate framework for coordination. Currently, sector activity is conducted under the coordinates set by the Tourism Development Master Plan, developed over a period of 20 years (2007-2026). Its objectives are to identify
365
366
Radu-Daniel Pintilii et al. / Procedia Environmental Sciences 32 (2016) 364 – 372
any weaknesses in tourism activity and through specific action programs aim to develop tourism efficient, sustainable and competitive. In order to better ilustrate the main tourist destinations in Romania (Table 1), we must watch the preferences of tourists according to the number of overnight stayings in the destinations, provided by the Ministery of Tourism, such as: SPAS, Mountain and Seaside Resorts, Danube Delta, Bucharest and Department Capitals (Tulcea City excluded) and other places of interests and trails. Table 1 Main tourist destinations in Romania, according to the number of tourists (2001-2011) Romanian tourism destinations SPAS Seaside resorts (Constanta City excluded) Mountain Resorts Danube Delta (Tulcea City included) Bucharest and Department Capitals, Tulcea City excluded Other places of interest and trails Total
1995 T. Ro. 718427 94.75 98559 92.56
2000 T. Ro. 677495 96.23 671638 65.12
2005 T. Ro. 650026 94.40 713529 87.64
2008 T. Ro. 727942 96.26 832589 65.01
2012 T. Ro. 696180 95.76 804198 95.48
1055885 71054
93.16 85.08
756380 34462
88.38 86.67
827952 76961
86.39 70.26
998468 96090
89.44 81.85
1121238 88021
89.88 64.44
3311230
84.12
2237397
70.59
2755711
63.00
3362865
67.27
3816873
66.95
995230
94.88
542757
89.28
780917
80.77
1107353
84.33
1159979
84.10
7070385
89.17
4920129
82.38
5805096
75.37
7125307
79.43
7686489
78.45
T. – Tourists, Ro. – Romanians (%) Data source: National Institute of Statistics
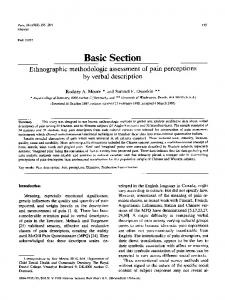
Table 1 shows that the main Romanian tourist destinations are preffered by romanians, with a procent that is over 50% in all cases, illustrating the mass feature of tourism in Romania, SPAS resorts being destination. From the economic point of view, to present the evolution of the tourism phenomenon in Romania, we will focus on key economic indicators, whom we present their evolution from 2001 to 2011. These indicators relate to changes in the number of companies, number of employees, turnover and profit. In the distribution of the number of companies (Figure 1), a general increase trend can be observed, from 147 companies in 2001 to 907 companies in 2008. Due to the Global Economic Crisis the number of companies decrease, touching 494 companies in 2010. The trend line shows a strong increase in case of companies from tourism sector, in comparison with the total number of companies, the critical point being the year 2008. 6
No.25000 20000
4
15000 10000
2
5000 0
0 2001
2002 2003 2004 2005 Companies in Tourism % of total Companies
2006
2007
2008 2009 2010 Total Companies
2011
Linear (Total Companies)
Fig.1 Number of companies (2001-2011) - Data source: UB/1365
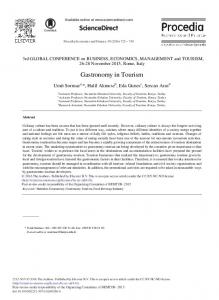
Regarding the number of employees (Figure 2), the situation can be explained from two points of view: on the one hand, as a general point of view, by the instability of the legislation system in Romania (the overtaxing) of the labour force, that stimulates the undeclared work, and on the other hand, as a particular point of view, by the instability of labour force and the low level of salaries from tourism, in Romania.
367
Radu-Daniel Pintilii et al. / Procedia Environmental Sciences 32 (2016) 364 – 372
No.
8.00
200000
7.00 6.00
150000
5.00 100000
4.00 3.00
50000
2.00 1.00
0
0.00 2001
2002
2003
2004
Employees in Tourism
2005
2006
2007
2008
Total Employees
2009
2010
2011
% of Total Employees
Fig. 2 Number of employees (2001-2011) - Data source: UB/1365
Thousands
The general evolution of the turnover (Figure 3), shows a positive trend, but the Global Economic Crisis is the single fact that immediately affects the other economic sectors of the National Economy, after 2008. For the tourism sector, the turnover has a relative constant evolution; the effects of the Global Economic Crisis are felt lately in this economic sector. 14000000
4.50
12000000
4.00 3.50
10000000
3.00
8000000
2.50
6000000
2.00 1.50
4000000
1.00
2000000
0.50 0.00
0 2001
2002
2003
Turnover
2004
2005
2006
2007
Turnover in tourism
2008
2009
2010
2011
% of Total turnover
Fig. 3 Evolution of turnover (2001-2011)
- Data source: UB/1365
Thousands
The fluctuant evolution of the profit, on the Figure 4, can be explained on the Global Economic Crisis, the single fact that contributes to the modifying structure of its distribution. If the evolution of profit from tourism in relatively constant, more fluctuant is the evolution of profit from the other economic activities. 800000
8.00
700000
7.00
600000
6.00
500000
5.00
400000
4.00
300000
3.00
200000
2.00
100000
1.00
0
0.00 2001
2002 Profit
2003
2004
2005
2006
Profit from tourism
Fig. 4 Evolution of profit (2001-2011)
2007
2008
2009
2010
2011
% of Total Profit
- Data source: UB/1365
As in every business the profit is the most important component, and all the involved actors is following it, to better explain the image of the tourism phenomenon, as an important component of the Economy in Romania, an
368
Radu-Daniel Pintilii et al. / Procedia Environmental Sciences 32 (2016) 364 – 372
econometric analysis is recommended. So, in the following we made some graphic representations to identify the relations existing between the profit (as the most important component) and the other key economic indicators (companies, employees and turnover).
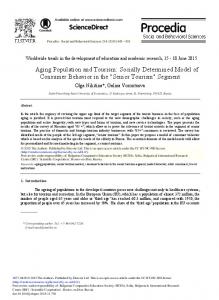
Fig. 5 Relation Profit/Companies from Tourism sector in Romania
In the Figure 5, the multiple plots, realized in R Software, shows the relation between Profit and Companies from Tourism sector in Romania, from 2001 to 2012. The yearly representations (from 2001 to 2012) show a strong correlation between the profit and companies, there is a concentration of small companies that are associated to the small values of the profit and only few companies realize a higher profit.
Radu-Daniel Pintilii et al. / Procedia Environmental Sciences 32 (2016) 364 – 372
Fig. 6 Relation Profit/Employees from Tourism sector in Romania
In the Figure 6, the relation between Profit and the Number of employees from Tourism sector in Romania, show the same situation the small number of employees is associated to a small value of the profit and vice versa. In the Figure 7, the relation between the Profit and the Turnover follows the same trend as in the previous two figures (a smaller profit corresponds to small turnover and the appearance of the big profit associated to big turnover is only occasionally).
369
370
Radu-Daniel Pintilii et al. / Procedia Environmental Sciences 32 (2016) 364 – 372
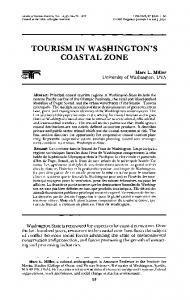
Figure 7 Relation Profit/Turnover from Tourism sector in Romania
All these three representations (Figure 5, 6 and 7) in the plots are determined by the economic situation (context) exiting in Romania for each year of representation, from 2001 to 2012. An interesting situation for the three figures appears in 2011, where the relation between all the components mentioned above is grouped in lower values. The 2011 is a year after the Global Economic Crisis, whose effects were almost catastrophic for some economic sectors in Romania. The tourism sector was one of the economic sectors strongly affected by this crisis and that’s why it heavily recovers after that period. In 2012 it can be observed the rapidly recovery of the profit correlated with the turnover, but a still heavily recovering in rapport with the other two components (Companies and Employees). In fact, the crisis deeply affected the last two mentioned components of the economic system. Regarding the relation existing between Profit and Loss the correlation trend is the same for all the years, it appears that this component (Loss) is not very influenced by the Global Economic Crisis. That’s why for small profits, the losses are bigger than for the big profits where losses are smaller. The idea is that companies with bigger profits better support losses; their adaptive capacity is bigger to some contradictory economic contexts.
Radu-Daniel Pintilii et al. / Procedia Environmental Sciences 32 (2016) 364 – 372
Figure 8 Relation Profit/Loss from Tourism sector in Romania
4.
Discussion and Conclusions
Tourism as an important economic activity proved not to be a very profitable one, on short term. The major investments in this sector need more time to be recovered. That’s why some investors ignore this fact and they only want to recover their investments in tourism rapidly. In this respect they ignore the quality standards of services they provide and sometimes the prices do not reflect the services they offer. On the other hand, the profit obtained in some tourist destinations does not really contribute or its contribution is reduced to the sustainable development of the local economies. This idea comes from the fact that the investments in those tourism areas are not endogenous, they do not belong to the people that belong to the local community. What they really want is only to obtain more and more profit. They do not care about the sustainability of their business and of the environment, they only exploit them. They only use resources of a territory that is a part of other community. The main profit obtained from the tourism destinations goes to the other important polarizing systems with a great functional complexity (Bucharest, Constanța, Iași, Cluj-Napoca, Timișoara), the headquarters of the
371
372
Radu-Daniel Pintilii et al. / Procedia Environmental Sciences 32 (2016) 364 – 372
tourism companies being located there [11, 12, 13, 14, 15, 16]. These cities, mentioned above, have strong economic power and the great private investments of national investors most often come from there. There are a lot of investments, located in the Carpathian Mountains resorts, in the Danube Delta, in the Seaside and other municipalities with tourism resources, whose owners belong to these cities. As a possible solution for the sustainable development of the territorial systems, with dominant tourism functionality is the promotion of some policies that stimulate the re-investment of the profit, at the tourism destination level. That means that an important amount of the profit to be spent there. The other main aspect is that, in some tourism destinations, there are other activities that sustain the local development of the territorial systems, even if on the first sight tourism seems as a main economic activity. As a best example, we can choose only two destinations from other more: Călimănești, where the commerce is the main activity and Băile Herculane, where the construction sector is dominant and the list of examplex could continue with many other exemples. In conclusion we can say that tourism is an additional economic activity, whose dynamics is in strong direct relation to the general economic profile. But only in some territorial systems, the tourism is the base of the economic activity; it’s about the tourism mono specialized territorial systems, where the main profile (structre) of revenues comes from the tourism activities. Acknowledgement This work was supported by a grant of the Romanian National Authority for Scientific Research and Innovation, CNCS-UEFISCDI, project number PN-II-RU-TE-2014-4-0835 and UB/1365 – Spatial Projection of the Economic Pressure on the Forest Ecosystems. References 1. Srinivasan P., Santos Kumar P.K., Ganesh L. Tourism and Economic Growth in Sri Lanka: An ARDL Bounds Testing Approach, The Romanian Economic Journal, 2012, Year XV no. 45, p. 211-226. 2. Datta D., Banerji S. Local tourism initiative in an eastern Himalayan village: sustainable ecotourism or small-scale nature exploitation?, Bulletin of Geography. Socio–Economic Series, 2015, no. 27, p. 33-49. 3. Sharpley, R. Tourism and sustainable development, Exploring the theoretical divide, Journal of Sustainable Development, 2000, no. 8, p. 119. 4. Pauhofová I. Development Specifics of the Rural Region, Journal of Economics, 2004, issue 52, vol. 7, p. 835. 5. Ongan S., Demiroz D.M. The Contribution of Tourism to the Long-Run Turkish Economic Growth, Journal of Economics, 2005, issue 53, vol. 9, p. 880. 6. Michálková A.Strategic Consideration of Regional Networks in Tourism and Their Contradictory Effects, Journal of Economics, 2011, issue 59, vol. 3, p. 310. 7. Petrișor A.I Multi-, Trans - and Inter - Disciplinarity, Essential Conditions for the Sustainable Development of Human Habitat, Urbanism. Architecture. Constructions, 2013, vol. 4, no. 2, p. 43-50. 8. Marrocu E., Paci R., Zara A. Micro-economic determinants of tourist expenditure: A quantile regression approach, Tourism Management, 2015, vol. 50, p. 15-30. 9. Mocior E., Nowak A., Rechcinski M., Franczak F., Hibner J., Kraz P., Tokarczyk N. Sunrise as a tourist attraction in the context of tourist motivation theory: a case study of the peak of Babia Góra (Western Carpathians), Bulletin of Geography. Socio–Economic Series, 2015, no. 30, p. 109-121. 10. Jarvis D., Stoeckl N., Liu H.B. The impact of economic, social and environmental factors on trip satisfaction and the likelihood of visitors returning, Tourism Management, 2016, vol. 52, p.1-18 11. Ko T.G. Medical Tourism System Model, International Journal of Tourism Sciences, 2011, vol. 11, no. 1, p. 18-51. 12. Peptenatu D., Pintilii R.D., Draghici C.C., Merciu C., Mateescu R.D. Management of Environment Risk within Emergency Territorial Systems. Case Study – The Influence Area of Bucharest City, Journal of Environmental Protection and Ecology, 2012, Vol. 4, Issue 13, p. 23602370. 13. Pintilii R.D., Braghina C., Draghici C.C., Saghin I. Territorial imbalances regarding the distribution of creative industries in Romania, Procedia Social and Behavioral Sciences, 2014, vol. 122, p. 179-183. 14. Draghici C.C., Pintilii R.D., Peptenatu D., Comanescu L.G., Sirodoev I. The Role of SPA Tourism in the Development of Local Economies from Romania, Procedia Economics and Finance, 2015, Vol. 23, p. 1573-1577. 15. Petrișor A.I, Assessment of the Green Infrastructure of Bucharest Using CORINE and Urban Atlas Data, Urbanism. Architecture. Constructions, 2015, vol. 6, no. 2, p. 19-24. 16. Rogerson C.M. Restructuring the Geography of Domestic Tourism in South Africa, Bulletin of Geography-Socio-Economic Series, 2015, Vol. 29, Issue 29, p. 119-135, DOI: 10.1515/bog-2015-0029.