TOWARD A NETWORK MAP ALGEBRA Marc P. Armstrong Department of Geography and Program in Applied Mathematical and Computational Sciences The University of Iowa Iowa City, IA 52242 marc-armstrong @ uiowa.edu
Paul J. Densham Centre for Advanced Spatial Analysis Department of Geography University College London 26 Bedford Way London WC1H OAP
[email protected]
ABSTRACT When decision-making groups work together to solve location-selection problems they often experience difficulty in understanding the elements of alternative solutions to problems that are held in common by different stakeholders. Because location selection problems are often addressed using decision support tools that represent the supply of services, and demand for it, on a street network, we have developed an approach, called network map algebra, that can operate on collections of alternatives in order to synthesize, summarize and differentiate between entire solutions or parts of them. This network map algebra uses abstracted representations of solutions in the form of vectors and matrices and requires a set of transformations between these abstracted structures and the conventional structures used by vector-based GIS software.
INTRODUCTION Groups of decision-makers often meet to address complex, ill-structured problems. Although individuals working in isolation normally lack the breadth of experience required to solve such problems, when they work as a group they can pool their expert knowledge, explore their unique perspectives and viewpoints on a problem, and work to resolve the conflicts that result from their differing backgrounds, experiences and opinions. Since complex problems of the type that are routinely encountered in the formulation of public policy often have important spatial components, several issues must be resolved before groups can most effectively use existing geographic information handling and analysis tools to support their decision-making efforts. One important problem is that current software systems do not provide the kinds of geographic tools that are required to support group interaction, visualization and consensus-building activities. The purpose of this paper is to develop the structures and operations needed to generate maps that synthesize the results of a set of location selection scenarios created by either an individual, or two or more group members. Because location-selection algorithms often use networks to provide the spatial structure of movement between supply and demand locations, we place a particular emphasis on the development of a conceptual framework for a network map algebra (NMA) which facilitates the production of maps that are designed to assist group decision-making.
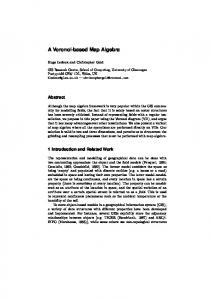
BACKGROUND AND DERIVATION Within the current GIS paradigm, thematic maps are created by assigning symbols to geometric objects that reflect their attributes; for example, a polygon such as a census tract might be shaded to depict average income or a city might be symbolized with a circle proportional to its population. These methods rely on a set of visual variables that are used to guide the choice of appropriate symbols (MacEachren, 1995) and are now well established in GIS and desktop mapping software. In contrast, many methods of locational analysis operate on the attributes of objects and an abstracted form of their topological relations (Densham and Armstrong, 1993). Figure 1 illustrates a multi-step transformation, performed routinely by GIS software, that converts a simple map into a tabular representation that can be used to support analytical NMA operations. In the first step the map is recast into a discrete set of topological nodes. These nodes are uniquely identified and a simple table (ID and locational coordinates) is derived from this representation. To generate map solutions to locational analyses, topological relations in the form of a list of allocations of demand locations to facilities, and attributes in the form of a tabular structure that specifies the volume of demand that each facility serves, are created during analysis and must be reconciled with the geometrical representations of objects in a geographical database (demand locations, facilities, and the underlying transportation network). This process of reconciliation can be accomplished through a series of transformations between maps, abstract data structures, operations on these structures and transformations back to mapped representations. In this section we describe this transformational view (see also Tobler, 1979; Clarke, 1995). Networks are constructed from nodes, points, links and chains. These constitute a set of cartographic primitives that can be analyzed independently or assembled into higher-level structures based on results from analytical operations. For example, a shortest path is computed through a network based on topological connections and distances along chains between nodes. The shortest path between two nodes that lie on different sides of a city, therefore, is a kind of compound object that is built from chains, nodes and their respective topological connections. Likewise, a scenario result from a locational model is reported as a tabular set of allocations of demand locations to one or more supply sites. Thus, for any given supply site the links between it and demand locations, when related to geometrical representations stored in a geographic database (e.g. TIGER files) constitute a compound object that describes the particular geographical characteristics of one possible solution to a location-selection problem. Typically, tabular structures that result from analyses are linked to geometrical representations to facilitate the creation of geographical visualizations (GVIS: MacEachren, 1995) that support locational decision-making (Armstrong et al., 1992).
Node ID
X
Y
1 2 3 4 5 6 7 9 10 11 12
Figure 1. Map abstraction to topological nodes. A network map algebra must be designed to operate on the structures, vectors and matrices that are derived from the topological relations produced by locational models. In a solution to a locational problem, for example, each supply location (facility) is topologically linked to a set of demand locations. Figure 2 illustrates the process through which data are used to create a simple GVIS or to provide input to locational modeling software, such as LADSS (Densham, 1992). The results of such models are often produced in tabular form and specify the assignment of demand to supply locations while satisfying some user-specified optimization criteria such as minimization of average distance between demand and supply locations. This tabular representation is then used with appropriate geographical information to produce maps that show, for example, the relationship between supply and demand locations. In Figure 3 a tabular structure that specifies the identity of a set of nodes can be used to generate a crude map as well as raw data that is input to a location model. The model then computes a set of allocations, based on user-specified criteria, of demand to supply locations has been written in tabular form. However, an additional transformation, also shown in Figure 3, and one that is of particular interest in a NMA context, is a simple binary representation of these relationships between supply and demand locations.
Topol '""'
(
Abstractor
t ]I
Tabular Results
I .^g__ " "^
Netvvork M Ale ebra
X Network Map Algebra Operations
^ *^^ ~"""^^
Struc tures
V
V
Geographic ^\ Visualization J
Figure 2. Transformational flows that support the use of network map algebra. Heavy arrows indicate primary flows while lighter arrows indicate flows that are used less frequently. Rectangles indicate data; rounded rectangles indicate processes. Several types of these transformed representations of solutions are used in NMA operations. Figure 4 shows the derivation of supply vectors for a set of three solutions. In this case each node that is specified as a supply site in a solution is denoted with a "1". Blanks are treated as zeros. More complex structures also can be derived to distill relationships between demand and supply locations. In Figure 5 links between supply and demand locations for the same three solutions are represented as binary allocation of demand matrices (in this
case a "1" represents the allocation of a demand location to a facility). In this way, several characteristics of each solution can be reduced to a matrix form that is then subjected to further analysis using NMA operations. Other types of analytical structures also can be generated (e.g. demand vectors, network shortest paths and second-order neighbors) with the resulting transformations used with NMA operations to move between alternative representations of a problem and its solutions as required by users as they either visualize or analyze their data. ID
X
Y
1 2 3 4 5 6
1
2
3
4
1
1
2
1
3
1
4
1
5
1
6
5
6
1
Figure 3. Transformational view of the location-selection process. Solid arrows indicate allocation of demand to a supply location.
2 ^^ 3 • ————————^
>