Brazilian Journal of Chemical Engineering
ISSN 0104-6632 Printed in Brazil www.abeq.org.br/bjche
Vol. 33, No. 04, pp. 1083 - 1090, October - December, 2016 dx.doi.org/10.1590/0104-6632.20160334s20150374
TOWARD PREDICTIVE MODELS FOR ESTIMATION OF BUBBLE-POINT PRESSURE AND FORMATION VOLUME FACTOR OF CRUDE OIL USING AN INTELLIGENT APPROACH D. Abooali1 and E. Khamehchi2* 1
School of Chemical Engineering, Iran University of Science and Technology, (IUST), Postal Code, 16765-163, Tehran, Iran. 2 Faculty of Petroleum Engineering, Amirkabir University of Technology, Hafez Avenue, 15914, Tehran, Iran. Phone: + 98 (21) 64545154; Fax: + 98 (21) 64543528 E-mail:
[email protected] (Submitted: June 14, 2015 ; Revised: September 1, 2015 ; Accepted: September 2, 2015)
Abstract - Accurate estimation of reservoirs fluid properties, as vital tools of reservoir behavior simulation and reservoir economic investigations, seems to be necessary. In this study, two important properties of crude oil, bubble point pressure (Pb) and formation volume factor (Bob), were modelled on the basis of a number of basic oil properties: temperature, gas solubility, oil API gravity and gas specific gravity. Genetic programming, as a powerful method, was implemented on a set of 137 crude oil data and acceptable correlations were achieved. In order to evaluate models, two test datasets (17 data for Pb and 12 data for Bob) were used. The squared correlation coefficient (R2) and average absolute relative deviation (AARD %) over the total dataset (training + test) are 0.9675 and 8.22% for Pb and 0.9436 and 2.004% for Bob, respectively. Simplicity and high accuracy are the advantages of the obtained models. Keywords: Crude oil; Bubble point pressure; Formation volume factor; Genetic programming.
INTRODUCTION Thermodynamic quantities of crude oil are a set of important features in order to determine technical specifications of oil production process equipment. Designing plenty of systems such as upstream and underground devices, surface operation equipment, etc., requires adequate and accurate information about oil parameters which are achieved, in many cases, from experimental tests along with mathematical correlations and formulas. Laboratory tests are usually expensive and sometimes difficult and time-consuming. However, the application of correlations is economically advantageous and increases the speed of works. Furthermore, the other great use of the correlations is to *To whom correspondence should be addressed
determine oil future specifications and changes taken into great consideration in reservoir simulators. Various pressure-volume-temperature (PVT) properties of crude oil can be estimated by means of equations of state or oil PVT analysis, if a complete set of variables of the oil including temperature, pressure and fluid composition are available. But in many cases, the composition of reservoir fluid is not predetermined, especially in the primary stages of recovery processes. Thus, some correlations are required to be functions of a number of readily available reservoir parameters in order to be used by engineers and scientists in this area. In fact, the main aim of this project was to provide simple and accurate models for prediction of bubble point pressure (Pb) and bubble point formation
1084
D. Abooali and E. Khamehchi
volume factor (Bob) solely as functions of simple and quickly accessible live crudeoil parameters. The parameters are temperature (T), gas solubility (Rs), oil API gravity and gas specific gravity (γg). In a hydrocarbon system at constant temperature, whether single-component or mixture, the bubble point pressure is the maximum pressure at which the first gas bubbles appear (Ahmed, 2010). The state of the system in this condition is called “saturated liquid”. The oil formation volume factor (FVF) is the ratio of the specific volume of oil at its natural temperature and pressure to the specific volume of the oil at standard conditions (i.e. P = 1 atm and T = 60 ˚F). If Bo is measured in the bubble point condition, it will be the bubble point oil formation volume factor (Bob). There are several correlations and methodologies developed and proposed so far for prediction of Pb and Bob. Methods of Standing (1947), Vasquez and Beggs (1980), Glaso (1980), Marhoun (1988) and Petrosky and Farshad (1993), as famous correlations, have been introduced in the literature (Ahmed, 2010). Elsharkawy and Alikhan (1997) presented a set of correlations for gas solubility, oil compressibility (Co) and Bob. Their relation for Bob is as follows:
(
) × R + 63.802 (10 ) × ( T – 60 ) + 0.78 (10 )
Bob = 1 + 40.428 10
−5
s
−5
(
×R s ( T – 60 ) γ g / γ o
−5
(1)
)
in which, γg is gas specific gravity. Khamehchi et al. (2009) also proposed three models for Pb, Rs and bubble point oil viscosity (μob). They called the achieved models “AUT”. Their Pb correlation is given below:
Pb = 107.93 Rs0.9129 × γ g −0.666 × T0.2122 × API −1.08 (2) Some presented correlations or algorithms are based on consistencies of a number of oil components or assays, which should be predetermined (Elsharkawy, 2003; AlQuraishi, 2009; Bandyopadhyay and Sharma, 2011; Farasat et al., 2013). However, the composition-based models have some limitations in their uses in preliminary reservoir investigations and simulations. There are also several methods using the artificial neural network (ANN) technique to predict Pb and Bob (Rasouli et al., 2008; Asadisaghandi and Tahmasebi, 2011). Adaptive network-based fuzzy infer-
ence system (ANFIS) is another new approach that has been applied in this area (Shojaei et al., 2014). Different procedures and methodologies can be used for model development. Artificial neural network (ANN), generalized regression neural networks (GRN), imperialist competitive algorithm (ICA), particle swarm optimization (PSO), adaptive network-based fuzzy inference system (ANFIS), genetic programing (GP), etc. are applied as famous methods in various fields, especially for optimization and prediction purposes. In the present study, a genetic programming based multi-gene symbolic regression algorithm called “GPTIPS” (Searson, 2009) was applied. This is an approved method used by the authors in some projects (Abooali and Khamehchi, 2014). The application of genetic programming for developing simple-to-use correlations for Pb and Bob seems novel. Moreover, applying natural ranges of bubble point pressure, bubble point formation volume factor, temperature, gas solubility, oil API gravity and gas specific gravity has increased the applicability and accuracy of the new developed models. MATERIALS AND METHODS Data Set
The total dataset includes 137 training sets of data from 137 oil samples. Each set includes temperature, solution gas ratio, oil API gravity, gas specific gravity, oil bubble point pressure and formation volume factor. The data were collected from different geographical zones. In order to determine the predictive capability of the models and also to implement a comparison between the new developed models and other correlations, two additional sets – one for Pb including 17 sets of data and the other for Bob which has 12 sets of data – were applied. The data of the additional sets known as “test sets” were gathered from several papers and reference books (Ahmed, 2010; McCain, 1990; Shojaei et al., 2014). The ranges of all parameters are presented in Table 1. Table 1: The range of parameters in the dataset of present study. Quantity Temperature (˚F) Solution gas oil ratio (SCF/STB) Oil API gravity Gas specific gravity (air = 1) Bubble point pressure (psia) Bubble point formation volume factor (bbl/STB)
Brazilian Journal of Chemical Engineering
Range 85 – 306 83 – 2217 21.143 – 124.054 0.216 – 1.872 350 – 5152 1.0955 – 2.027
Toward Predicctive Models for Estimation of Bu ubble-Point Pressuure and Formatio on Volume Factorr of Crude Oil Ussing an Intelligentt Approach
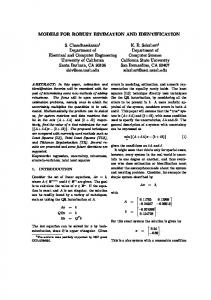
Model M Develoopment Proocedure Genetic prrograming (G GP) is a pow werful methhodology and itss programingg procedure was patternned frrom biological generatiion systems. Genetic pprogramming waas introducedd in the early y 1990s and hhas been developped mostly by b its innovaator John Kooza (1 1992). As ann efficient toool, it has a wide varietyy of ap pplications iin mathematiical and also o computatioonal an nd modelingg projects. Genetic algoriithm (GA), aas a faamous algoriithm based on o genetic programing, iis a trrusted methood in correllation devellopment. Maany new models hhave been produced p by use of GA,, so faar, for differrent phenomeena. In the present p studyy, a kind of regression methood was applieed on the baasis of GP. GP is an evolutionnary methodo ology involvving co omputer proograms in ordder to perforrm tasks. It iis a machine m learnning methodd that biologiically generaates th he random population of mathemaatical functioons under predeteermined resttrictions. The populationn is reepresented ass chromosom mes like synttactic tree strructu ures. The priimary popullation of fun nctions incluudes mathematical m operators opperating on input data. Eaach trree structure is often knoown as a “g gene”. A sim mple gene is shownn in Figure 1. Each genee mainly stannds fo or a functioon. The num mber of gen nes, number of populations aand complexxity of geness can be dettermined m by the user. When the process is specification s n of mathem maticaal models or functions, the GP is often o knownn as “ssymbolic reggression”. Inn convention nal regressioons, att first, the foorm of the model m should d be determinned by the user annd then, moddel parameterrs will be fittted. But B in a sym mbolic regreession, the algorithm a itsself seearches for bboth the moddel form desccribing the ddata behavior and also the moddel parameters.
Figure F 1: A ssimple gene (tree structu ure) with opeerato ors: ×, + and tanh. In GA, aftter random generation g off the first poopulaation (parentss), the overalll primary mo odel is achievved by weighted summation of o all functio ons represennted ass genes withh a bias term m. The weig ght of each ttree
10085
and the bias teerm are calcuulated by an ordinary leaast squ uares technique. A simpple schematiic of a moddel inccluding two gene structuures is show wn in Figure 2. Ass can be seen in Figure 2, in each gene g there are a som me mathemaatical operattors which are a applied on o thee input variab bles. d0 is a bbias term and d d1 and d2 are a weeights of gen nes. The optiimal weightss for the gennes aree automaticaally obtainedd by use of ordinary leaast squ uares. x1, x2 and x3 are innput variables.
gure 2: Oveerall model of two genees with a biias Fig terrm. d0, d1 and a d2 are linear coeffficients of thhe gen nes. In the next step, crossinng over the beest performinng treees and modifications off trees (cuttin ng some parrts of trees and exchanging e cut parts between b them msellves) are implemented to make a neew populatioon (ch hildren), i.e., new tree structures. The weighteed sum mmation of all new genees is repeated and the neew weeights and allso the new bias term arre determineed. Th his process iss iterated andd new popullations are crreateed until the laast populationn contains neew trees (funnctio ons) that are able to solvee the problem m successfullly (Seearson, 2010 0). Complem mentary explaanations aboout GA A are found elsewhere e (SSearson et all., 2010; Kozza, 1992). If the algoriithm creates a number off genes insteaad of one, in fact,, a more accuurate method dology will be b app plied for pro oducing a poopulation off mathematiccal rellations (multti-gene symbbolic regresssion). A multtigen ne consists of o one or m more genes each one beinng an individually y usual GP ttree. Thus, multi-gene m a appro oaches often n give simppler function ns than othher mo odels consistting of one m monolithic GP G tree (Seaarson n, 2010). Th he flowcharrt of geneticc algorithm is sho own in Figurre 3. A genetic algorithm ttoolbox called “GPTIPS S” waas prepared by Searsoon (2009) for use wiith MA ATLAB softtware. It wass written mainly for multtigen ne symbolicc regression application ns. So, all thhe preevious operaations (generrating parentt genes, crosssing g over the beest trees, mut utating, produ ucing childreen,
Vol. 33, No. 04, pp. 1083 - 1090, October - Decem Brazilian Journal J of Chemiccal Engineering V ember, 2016
10 086
D. A Abooali and E. Khamehchi K
ettc.) are carriied out by GPTIPS G to achieve a the bbest co orrelation. M More details about a GPTIP PS can be fouund in n the refereences (Searsson, 2009; Searson S et al., 2010). In this stuudy, GPTIPS S was used to develop nnonliinear correlattions. Input data (trainin ng and test suubseets), includinng experimenntal sets of teemperature, gas so olubility, oill API gravitty and gas specific s gravvity allong with buubble point pressure an nd bubble pooint fo ormation volume factor,, were fed to t the GPTIP PS. Then, T tuningg parameterss were adju usted and c ontrrolled. Runnning the proggram, each correlation c w was ob btained withh acceptable values of staatistical criteeria an nd good accuuracy.
Ev valuation of Model Validdity For evaluatiion of the devveloped mod dels, three com mon statisticall parameterss were calcu ulated: squareed mo corrrelation coeefficient (R2)), root-mean-square deviiatio on (RMSD) and a average absolute relaative deviatioon perrcentage (AA ARD %). A low value of o RMSD annd AA ARD is prefeerred. R2 shouuld be near to t one. n
R2 = 1 −
∑ (yy i =1 n
exp. i
2 − ycal. i )
(33)
∑(yy
exp. i
− yexp. )2
i =1
n
⎛ 1⎞ 2 RM MSD = ⎜ ⎟ (yexp. − ycal. i ) i ⎝ n ⎠ i =1
∑
AR RD ( % ) =
yexp. − y ical. i y exp. i
× 100
(44)
(55)
n
xp. − ycal. yex ⎛1⎞ i i × 10 AA ARD ( % ) = ⎜ ⎟ 00 exp. n yi ⎝ ⎠ i =1
∑
(66)
exp.
wh here yexp. , y cal. annd n are the experimentaal, i , y i preedicted, and d average off experimen ntal dependeent varriables (Bob and Pb) and number of samples s in thhe dattaset, respecttively.
RESU ULTS AND DISCUSSIO ONS Applying th he genetic prrogramming approach, tw wo corrrelations for bubble poiint pressure and formatioon volume factor of crude oill were obtaiined. They are a as follows:
Figuree 3: Genetic algorithm flo owchart.
⎛ ⎞ 1 11.54 R s Pb = 169 ln( R s γ g 3 ) − 26144 ln γ g ln ( R s ) ⎜ γ g + 2 ⎟+ 3 ⎜ γ g + API ⎟⎠ γ g + 0.05948 8 API ⎝
(
)
⎛ R sγg ⎞ ⎛ R s ln(API) ⎞ 0.0004272R s 2 + 1.934 lnn ⎜ − T + + 2746 γ g2 + 472.5 ⎟⎜ ⎟ 2 T + API 2 API ⎠ 2 γ g + 0.05948 API ⎝ ⎠⎝
A − ln ( R s ) ) ( ) (API −0.0003518 (exp ( γ ) ln ( R ) + R ln ( 2 T 2 ) − γ g API ) − 0.003894 ( γ g 2 ) exp ( γ g ) + A ln ( γ g )) + 0.945 1.622 (110 ) ( ( R – exp ( γ ) ln ( T ) ) ( 3 T – API ) + R sAPI
(7)
Bob = 0.0007004 T + 0.0003542 R s + 0.0003534 0 AP API + 0.00042 275 γ g 2 g
−6
s
s
s
2
g
Brazilian Jouurnal of Chemica al Engineering
(8)
Toward Predicctive Models for Estimation of Bu ubble-Point Pressuure and Formatio on Volume Factorr of Crude Oil Ussing an Intelligentt Approach
The statisttical parameeters of the new n developped models m are giiven in Tablle 2 and Tab ble 3 for Pb aand Bob, respectivvely. Figure 4 and Figu ure 5 show the values prediccted by Equation (7) an nd Equation (8) ng to Table 2, versus experrimental datta. Accordin Table T 3, Figuure 4 and Figure 5, the new developped models m are caapable of prrediction and d estimationn of Pb and Bob. IIn Figure 6 and Figure 7, cumulattive
freequency percent versus maximum absolute rellativ ve deviation percent are re shown ov ver the entiire data set for Pb and Bob, rrespectively. As shown in t absolute relative dev viation perceent theese figures, the forr 90.26% off all data estiimated by Equation E (7) is lesss than 20%. For Bob, thhe absolute relative devviatiion percent for f 97.315% of all the daataset is low wer thaan 10%.
Table 2: Statistiical parameeters of the new n developed model foor Pb. ntotal = 154 RMSD Dtotal = 190.84088 psia R2total = 0.9675 AARD Dtotal = 8.2206% %
ntrain = 137 RMSD Dtrain = 169.112 26 psia R2trainn = 0.9695 AARD Dtrain = 8.0395% %
ntest = 17 RMSSDtest = 315.356 62 psia R2testst = 0.9131 AAR RDtest = 9.6795% %
Subscripts “total”, “train”, and “test” are used to o distinguish the rresults related to total data set, traiining data set, and nd test data set, respectively.
Tablle 3: Statistical parametters of the new n developeed model forr Bob. ntotal = 149 RMSD Dtotal = 0.0449 bbbl/STB R2total = 0.9436 AARD Dtotal = 2.0040% %
10087
ntrain = 137 RMSD Dtrain = 0.0456 bbl/STB b R2trainn = 0.9419 AARD Dtrain = 2.0069% %
ntest = 12 RMSSDtest = 0.0360 bbl/STB R2testst = 0.9322 AAR RDtest = 1.9700% %
Subscripts “total”, “train”, and “test” are used to o distinguish the rresults related to total data set, traiining data set, and nd test data set, respectively.
F Figure 4: Predicted P verrsus experim mental bubblle point presssure. R2train and R2test arre ccorrelation cooefficients of training andd test data, respectively.
F Figure 5: Predicted verrsus experim mental bubble point oil formation vvolume facto or. R2train and R2test are correlation coefficcients of train ning and test data, respecctively. t Vol. 33, No. 04, pp. 1083 - 1090, October - Decem Brazilian Journal J of Chemiccal Engineering V ember, 2016
10 088
D. A Abooali and E. Khamehchi K
Figure 6: Cumulativee frequency percent veersus maximum absolute rellative deviattion of the new developed m model for buubble point pressure p overr the whole dataa set (154 data). d As caan be seen,, the absolute rellative deviattions for 73.3 377% of all data are less thaan 10% and absolute relative deviattions for 90.26% of all data are a less than 20%. 2 In order tto evaluate the t new corrrelations aloong with w other m models, a coomparison haas been impplemented m over test datasetts and the results r are ppre-
Figu ure 7: Cum mulative freequency perrcent versus max ximum absolute relative ddeviation of the new develo oped model for bubble ppoint formattion volume factor over all the data sett (149 data).. As can be seen n, absolute reelative deviaations for 91..275% of all the data are less than 5% annd absolute reelative deviations for 97.315 5% of all thee data are less than 10%. nted in Tablee 4, Figure 8 and Figure 9. As a resuult, sen thee prediction capability off the new deeveloped moodelss is higher than that of pre revious relations.
Table 4: C Comparison between em mpirical corrrelations and d the new deeveloped moodels over teest data set. Method Standing Glaso Marhoun Petrosky and d Farshad AUT Present studyy
AARD % 16.951 21.740 11.190 35.199 9.680
Pb (Number of d data=17) Max R RMSD ximum 2 R ((psia) AAR RD% 0.431 8007.127 59.054 0.461 7885.440 50.763 0.676 6008.592 43.582 -0.944 14491.11 94.462 0.913 3115.356 29.317
AAR RD % 2.62 21 2.171 2.292 2.109 1.970
Bob (Num mber of data= =12) Maximum RMSD D m 2 R (bbl/STB B) AARD% % 0.8888 0.0462 2 5.773 0.9011 0.0435 5 6.484 0.9022 0.0434 4 6.774 0.9166 0.0402 2 7.074 0.9322 0.0360 0 4.788
Figure 8: Maximum absolute reelative deviaation versus cum mulative num mber of data for bubble ppoint pressure off the test set (17 ( data). Ass can be seenn, the absolute reelative deviaation curve of the new w developed moodel is lowerr than that off other empiirical correlationss.
Figu ure 9: Max ximum absoolute relativ ve deviation verssus cumulatiive number of data for the bubble poin nt formation n volume facctor for the test set (12 dataa). The averaage of the abbsolute relativ ve deviation of the t new developed mode del is lower than that off otheer empirical correlations..
Brazilian Jouurnal of Chemica al Engineering
Toward Predictive Models for Estimation of Bubble-Point Pressure and Formation Volume Factor of Crude Oil Using an Intelligent Approach
These comparisons demonstrate the superiority of the correlations developed in the present project among proposed models. The experimental values of all dataset along with predicted data have been provided in the supporting materials and information.
CONCLUSIONS
By application of genetic programing methodology, two new models have been achieved for estimation and prediction of bubble point pressure and bubble point formation volume factor, as functions of a number of rapidly measurable oil parameters. One of the useful applications of this kind of model is prediction of oil properties in the future during the reservoir lifetime that is very important, especially for economic studies as well as effective uses in reservoir simulators. A comparison between the new proposed models and some other correlations shows the greater accuracy of the proposed models over previous works.
NOMENCLATURE
AARD%
average absolute relative deviation percentage ANN artificial neural network API oil API gravity ARD% absolute relative deviation percent bbl STB-1 barrel(s) per standard barrels oil formation volume factor Bo Bob bubble point oil formation volume factor oil compressibility at constant Co temperature FVF formation volume factor GP genetic programing GRN generalized regression neural networks ICA imperialist competitive algorithm n number of samples in the dataset Pb bubble point pressure PSO particle swarm optimization PVT pressure – volume – temperature squared correlation coefficient R2 RMSD root-mean-square deviation Rs gas solubility SCF STB-1 standard cubic feet of solution gas per standard barrels of oil T temperature cal. predicted dependent variable of yi component i
y exp. i y
exp.
γg γo μob
1089
experimental dependent variable of component i average of experimental dependent variables gas specific gravity oil specific gravity oil bubble point viscosity REFERENCES
Abooali, D. and Khamehchi, E., Estimation of dynamic viscosity of natural gas based on genetic programming methodology. J. Nat. Gas. Sci. Eng., 21, 1025 (2014). Ahmed, T., Reservoir Engineering Handbook. Gulf Professional Publishing (2010). AlQuraishi, A. A., Determination of crude oil saturation pressure using linear genetic programming. Energy Fuels, 23, 884 (2009). Asadisaghandi, J. and Tahmasebi, P., Comparative evaluation of back-propagation neural network learning algorithms and empirical correlations for prediction of oil PVT properties in Iran oilfields. J. Pet. Sci. Eng., 78, 464 (2011). Bandyopadhyay, P. and Sharma, A., Development of a new semi analytical model for prediction of bubble point pressure of crude oils. J. Pet. Sci. Eng., 78, 719 (2011). Elsharkawy, A. M., An empirical model for estimating the saturation pressures of crude oils. J. Pet. Sci. Eng., 38, 57 (2003). Elsharkawy, A. M. and Alikhan, A. A., Correlations for predicting solution gas/oil ratio, OFVF and undersaturated oil compressibility. J. Pet. Sci. Eng., 17, 291 (1997). Farasat, A., Shokrollahi, A., Arabloo, M., Gharagheizi, F. and Mohammadi, A. H., Toward an intelligent approach for determination of saturation pressure of crude oil. Fuel Process Technol., 115, 201 (2013). Glaso, O., Generalized pressure-volume-temperature correlations. J. Pet. Technol., 32, 785 (1980). Khamehchi, E., Rashidi, F., Rasouli, H. and Ebrahimian, A., Novel empirical correlations for estimation of bubble point pressure, saturated viscosity and gas solubility of crude oils. J. Petrol Sci., 6, 86 (2009). Koza, J., Genetic Programming. Massachusetts Institute of Technology. New York (1992). Marhoun, M. A., PVT Correlations for Middle East Crude Oils. J. Pet. Technol., 40, 650 (1988). McCain, W. D., The Properties of Petroleum Fluids. PennWell Publishing Co (1990).
Brazilian Journal of Chemical Engineering Vol. 33, No. 04, pp. 1083 - 1090, October - December, 2016
1090
D. Abooali and E. Khamehchi
Petrosky, Jr. G. E. and Farshad, F., Pressure-volumetemperature correlations for Gulf of Mexico crude oils. SPE Res. Eval. Eng., 416-420 (1998). Rasouli, H., Rashidi, F. and Ebrahimian, A., Estimating the bubble point pressure and formation volume factor of oil using artificial neural networks. Chem. Eng. Technol., 31, 493 (2008). Searson, D. P., GPTIPS: Genetic Programming & Symbolic Regression for MATLAB. http://gptips. sourceforge.net (2009). Searson, D. P., Leahy, D. E. and Willis, M. J., GPTIPS: An open source genetic programming
toolbox for multigene symbolic regression. IMECS, March 17-19, Hong Kong (2010). Shojaei, M-J., Bahrami, E., Barati, P. and Riahi, S., Adaptive neuro-fuzzy approach for reservoir oil bubble point pressure estimation. J. Nat. Gas. Sci. Eng., 20, 214 (2014). Standing, M. B., A Pressure-volume-temperature correlation for mixtures of California oils and gases. API Drill Prod. Pract., 275-287 (1947). Vazquez, M. and Beggs, H. D., Correlations for fluid physical property prediction. J. Pet. Technol., 32, 968 (1980).
Brazilian Journal of Chemical Engineering