J Appl Physiol 107: 155–160, 2009. First published May 7, 2009; doi:10.1152/japplphysiol.91657.2008.
Improved predictive models for plasma glucose estimation from multi-linear regression analysis of exhaled volatile organic compounds Jane Lee,1 Jerry Ngo,4 Don Blake,3 Simone Meinardi,3 Andria M. Pontello,4 Robert Newcomb,4 and Pietro R. Galassetti1,2,4 Departments of 1Pharmacology, 2Pediatrics, and 3Chemistry, and 4General Clinical Research Center/Institute for Clinical Translational Science, University of California, Irvine, Orange, California Submitted 29 December 2008; accepted in final form 2 May 2009
Lee J, Ngo J, Blake DB, Meinardi S, Pontello AM, Newcomb R, Galassetti PR. Improved predictive models for plasma glucose estimation from multi-linear regression analysis of exhaled volatile organic compounds. J Appl Physiol 107: 155–160, 2009. First published May 7, 2009; doi:10.1152/japplphysiol.91657.2008.—Exhaled volatile organic compounds (VOCs) represent ideal biomarkers of endogenous metabolism and could be used to noninvasively measure circulating variables, including plasma glucose. We previously demonstrated that hyperglycemia in different metabolic settings (glucose ingestion in pediatric Type 1 diabetes) is paralleled by changes in exhaled ethanol, acetone, and methyl nitrate. In this study we integrated these gas changes along with three additional VOCs (2 forms of xylene and ethylbenzene) into multi-linear regression models to predict plasma glucose profiles in 10 healthy young adults, during the 2 h following an intravenous glucose bolus (matched samples of blood, exhaled and room air were collected at 12 separate time points). The four-gas model with highest predictive accuracy estimated plasma glucose in each subject with a mean R value of 0.91 (range 0.70 – 0.98); increasing the number of VOCs in the model only marginally improved predictions (average R with best 5-gas model ⫽ 0.93; with 6-gas model ⫽ 0.95). While practical development of this methodology into clinically usable devices will require optimization of predictive algorithms on large-scale populations, our data prove the feasibility and potential accuracy of breath-based glucose testing. breath analysis; exhaled gases; hyperglycemia; intravenous glucose tolerance test VOLATILE ORGANIC COMPOUNDS (VOCs) present in human breath are potentially ideal biomarkers of endogenous metabolic processes, as human breath samples can be collected noninvasively and painlessly in virtually any condition. Many of these VOCs may be important by-products of physiological or altered endogenous metabolic pathways and can conceivably be developed into prognostic, diagnostic, and monitoring tools for a variety of biomedical fields. Only in recent years have advances in analytical technology drastically reduced prior measurement difficulties, allowing detection of hundreds, possibly thousands, of VOCs in human exhalates at extremely low concentrations (the best technology currently available allows measurements as low as 10 parts per quadrillion by volume). Most of the current studies applying this technology in a number of laboratories from various countries, however, are still at an exploratory stage (27), while concrete, practical applicability of this concept has been limited to a handful of gases present in exhaled breath at relatively high concentra-
Address for reprint requests and other correspondence: P. R. Galassetti, UCI GCRC-Bldg 25-2nd Floor, 101 The City Dr., Orange, CA 92868 (e-mail:
[email protected]). http://www. jap.org
tions, such as exhaled acetone in diabetic ketoacidosis (20, 26) or exhaled urea in gastric H. pylori infection (16). An intriguing application of this technology is the identification and kinetic measurement of exhaled biomarkers of carbohydrate metabolism, with the downstream goal of developing portable devices for the noninvasive measurement of glucose and other molecules relevant to diabetes management. Several prior studies support the possibility of predicting plasma glucose concentrations via correlations with specific VOCs. Exhaled acetone has been a first obvious candidate, and several studies have proposed its use to construct diagnostic tests for diabetes (9); direct estimation of plasma glucose concentrations from exhaled acetone alone, however, has proven impossible. On the other hand, acetone used in combination with exhaled ethanol in a multi-linear regression (MLR) model allowed the prediction of fluctuating plasma glucose concentrations in healthy subjects during an oral glucose tolerance test (10). In a subsequent experiment involving children with Type 1 diabetes, strong correlations between another exhaled VOC, methyl nitrate, and blood glucose profiles were reported (19). The results of these studies appear to indicate that equivalent glucose concentrations (i.e., hyperglycemia of 200 mg/dl) may cause differing exhaled gas patterns based on the overall metabolic conditions accompanying the level of plasma glucose (i.e., exhalation of ethanol due to fermentation by gut bacteria following oral glucose administration or exhalation of methyl nitrate due to the increased lipid peroxidation caused by low insulin in Type 1 diabetes). Thus it appears that to successfully use breath VOC patterns for the prediction of plasma glucose, multiple gases reflecting different aspects of glucose metabolism should be identified and simultaneously integrated into a complex analytical model, accounting for the variability of glucose-induced exhaled air composition. We therefore designed the present study in which an intravenous glucose bolus was administered to a group of healthy subjects (thereby eliminating the possible confounding effect of gastrointestinal glucose absorption), and a broader profile of exhaled gases was used to generate advanced predictive models for plasma glucose, based on MLR analysis of four-, five-, and six-gas clusters. SUBJECTS AND METHODS
All experimental procedures were approved by the University of California, Irvine Institutional Review Board. All study procedures were conducted by specialized personnel at the UCI Institute for Clinical Translational Science (ICTS) and gas analysis was conducted by the Rowland/Blake Research Lab in the UCI Chemistry Department. Subjects. While results from these studies may be important for subject populations of all ages and various pathological conditions, 10
8750-7587/09 $8.00 Copyright © 2009 the American Physiological Society
155
156
EXHALED VOCS AND PLASMA GLUCOSE
healthy young adult volunteers were asked to participate in the study (5 men/5 women, mean 26 ⫾ 4 yr, range 21–33). This small homogeneous group with stable metabolic conditions was chosen to minimize the noise of data acquisition at this relatively early stage in the research. All subjects signed informed consent forms prior to the study and were in general good health, had no evidence or record of recent or chronic illness, did not smoke, and were not on any medications. Female participants had a negative pregnancy test immediately before the start of study procedures. Study procedures. Subjects were admitted to the ICTS lab in the morning following an overnight fast of at least 8 h. Following admission, two intravenous catheters were inserted in the median antecubital veins of both arms for glucose infusion and blood draws. At all study time points, as detailed below, simultaneous plasma glucose, exhaled gas, and room air samples were collected. After 30 min of rest, two baseline samples were collected 10 min apart; over the ensuing 4 min, an intravenous infusion of 50 ml of an aqueous solution containing 25 g of dextrose was administered. Time 0 min was considered the start of the intravenous infusion. Plasma and gas samples were then collected at nine time points (t ⫽ 2.5, 5, 10, 15, 20, 30, 60, 90, and 120 min). Plasma glucose analysis. At each study time point, 0.4 ml blood samples were spun on a microcentrifuge, and plasma glucose was measured in triplicate by the glucose oxidase method using a Beckman Glucose Analyzer II (Beckman Coulter, Fullerton, CA). Gas collection and analysis. After deep inspiration to total lung capacity, subjects were instructed to slowly exhale until near residual capacity into a mouthpiece connected to specially designed, electropolished, 1.9-liter stainless steel canisters, presterilized (baked at 150°C for 12 h) and evacuated to ⬍10⫺5 atm. The canister mouthpiece was connected to a three-way valve, which allowed ventilation and clearance of the first 2–3 s of exhaled air consisting of anatomic dead space to ensure sampling of alveolar air. (CO2 concentrations of ⬃5% demonstrated that the captured samples were nearly entirely of alveolar origin.) Room air samples were also simultaneously collected in identical canisters. The canisters containing breath samples were then transferred to the UCI Atmospheric Chemistry Laboratory and the gas content was cryogenically trapped and injected into a multi-column/multi-detector gas chromatography system including two flame ionization detectors (FIDs), two electron capture detectors (ECDs), and a quadruple mass spectrometer (MSD). The following five column/detector combinations were used for separation and analysis: PLOT/FID, DB-1/FID, DB-5/ECD, RTX-1701/ECD, and DB-5ms/MSD. This method allowed accurate quantification of a large spectrum of volatile organic compounds. A more in-depth description of analytical methods was previously published (6). Data analysis and statistics. The integrated analysis of six gases was used for predictive calculations of plasma glucose. Three of the gases (ethanol, acetone, and methyl nitrate) were chosen as prior work from our laboratory demonstrated their correlation with systemic hyperglycemia (10, 19). The remaining three gases (ethylbenzene, o-xylene, and m/p-xylene) were added to the analysis after visual inspection of exhaled gas patterns from the current protocol revealed kinetic profiles paralleling that of plasma glucose. All predictive models were generated via MLR analysis of multiple gas profiles; estimates of plasma glucose were then derived, which were plotted against measured plasma glucose values, and correlation coefficients between estimated and measured glucose values were then obtained. A model using analysis of all six gases to predict plasma glucose levels in all 10 subjects was first generated. To determine whether similar accuracy could be retained after dropping one or two gases from the analysis, additional predictive models were then created using every possible five- and four-gas combination (six 5-gas combinations and fifteen 4-gas combinations). J Appl Physiol • VOL
As the best four-gas cluster displayed only marginally decreased predictive ability than the best five-gas and the six-gas models, data using these four gases (ethanol, acetone, methyl nitrate, and ethylbenzene) were therefore chosen as the main results of the study. RESULTS
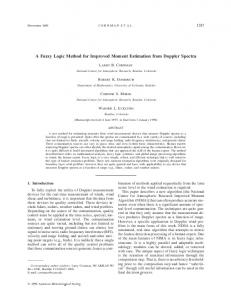
Plasma glucose. The mean baseline, fasting plasma glucose measurement, taken as the average of two blood draws immediately before the start of study, was 94.5 ⫾ 2.4 mg/dl (range 82–109 mg/dl). After administration of intravenous dextrose, peak serum glucose levels of 275.0 ⫾ 9.8 mg/dl (range 231– 317 mg/dl) were measured 2.5 min after the glucose infusion had been completed (Fig. 1). Over the course of the 2-h study, we observed a gradual decline in glucose levels in each subject. At the end of the study, mean plasma glucose measurements were slightly below baseline levels (mean 84.5 ⫾ 1.8 mg/dl, range 74 –94 mg/dl). Correlations between plasma glucose and exhaled gasbased predictions. All studied gases displayed some degree of individual correlation with the corresponding plasma glucose profile. Gas profiles, however, were markedly different from each other (with the exception of the 3 aromatic compounds, generally displaying parallel courses), as shown in Fig. 2. When the profiles of all six gases were used to generate a predictive model for plasma glucose, VOC-derived estimates correlated with actual glucose measurements with a mean correlation coefficient, r, of 0.946 (range 0.701– 0.993). As regression analysis provides the strongest predictive model when the fewest variables are used, we then proceeded to repeat similar analyses after removal of one or two gases. Among the six possible five-gas combinations, the combination yielding the highest mean correlation coefficient (0.931, range 0.699 – 0.991) was ethylbenzene, m/p-xylene, ethanol, acetone, and methyl nitrate. Compared with the six-gas model, only a minimal loss in predictive strength was observed (⬍0.015 points in mean r). When two gases were dropped from the analysis, 16 fourgas combinations were possible; among these, the cluster of ethanol, acetone, methyl nitrate, and ethylbenzene displayed the highest mean correlation with measured glucose (mean r ⫽ 0.913, range 0.698 – 0.977). Among all 16 four-gas combinations, the three models yielding the best prediction of plasma
Fig. 1. Schematic of experimental procedures.
107 • JULY 2009 •
www.jap.org
EXHALED VOCS AND PLASMA GLUCOSE
157
Fig. 2. Mean plasma glucose and exhaled volatile organic compound (VOC) profiles in 10 healthy young adults (5 men/5 women) after injection of a 25 g iv glucose bolus.
glucose all contained the same three gases (ethanol, acetone, methyl nitrate, previously reported in our laboratory to correlate with hyperglycemia) and only one of the three aromatic gases newly incorporated in this study. Compared with the five- and six-gas model, the loss of predictive capacity was minimal (overall difference of 0.033 from six-gas to best four-gas model); plots of estimated and measured plasma glucose values for all 10 subjects using this model are shown in Fig. 3. Especially noteworthy was that even in the subject with the lowest correlation between estimated and measured glucose, predictive strength was maintained when shifting from six- to four-gas models (6-gas 0.701, 5-gas 0.699, 4-gas 0.698; Fig. 4). Gas analysis of infusate. The three aromatic gases used in this analysis (ethylbenzene, o-xylene, and m/p-xylene) are known to be released by the plastic surfaces of medical and laboratory tubing, syringes, and other containers. To determine whether this source of these aromatic gases significantly contributed to collected exhaled breath samples, concentrations of these gases in the study infusate were measured (after the infusate had flown through an identical set of tubing as during study procedures) using a custom gas-stripping apparatus. While small concentrations of these gases were indeed detected in the study infusate, they could account for ⬍5% of the recorded gas peaks, and therefore could have exerted at most a negligible effect on study results. J Appl Physiol • VOL
DISCUSSION
Our study showed that in a group of healthy adults, plasma glucose concentrations fluctuating over 2 h by ⬃ 200 mg/dl (between ⬃100 and ⬃300), following intravenous injection of 25 g of glucose, could be accurately predicted through MLR analysis of the exhaled profiles of six gases collected simultaneously with blood draws. Prior work by our group and other laboratories was originally focused on the attempt to detect correlations between single gases and plasma glucose concentrations (10, 19). It soon became apparent, however, that different exhaled VOC patterns could occur with similar plasma glucose concentrations, depending on overall systemic metabolic conditions. Integrated analysis of multiple exhaled VOCs, which could account for different components of a changing metabolic milieu, appeared to be the logical approach for a gas-based estimation of blood glucose (and indeed of numerous other circulating variables). In the observations presented here, we integrated the exhaled profiles of six gases selected from a total of ⬃80, which were measured in our subject group. Three of the gases (ethanol, acetone, methyl nitrate) were chosen due to their correlation with hyperglycemic conditions proven in prior studies from our laboratory (10, 19). Three additional gases (ethylbenzene, o-xylene, and m/p xylene) were added as they showed the strongest individual correlations with glucose lev-
107 • JULY 2009 •
www.jap.org
158
EXHALED VOCS AND PLASMA GLUCOSE
allow us to speculate on the feasibility and challenges associated with this evolution. One strength of our model is the stability of glucose predictions across a wide range of glycemic levels; measurement error was consistently ⬃20 mg/dl, i.e., ⬃ 20% in the euglycemic range, and under 10% in the tested hyperglycemic range, rendering our estimates physiologically relevant. This error is similar to that observed in currently available continuous glucose monitoring devices. Of note is that this level of accuracy was obtained with the inclusion of
Fig. 3. Plasma glucose profiles in 10 healthy young adults after injection of a 25 g iv glucose bolus. Solid symbols indicate direct glucose measurements, open symbols indicate estimates through multi-linear regression of exhaled VOCs, using the 4-gas predictive model with the highest mean individual correlation coefficient. r ⫽ Pearson’s correlation coefficient.
els in the present dataset. Therefore, the first predictive model that was developed included all six gases. As models requiring the fewest number of variables are most practical for the development of clinical testing devices, we then progressed towards models with fewer gases. In shifting from a six-gas model to a four-gas model, removal of one or two of the three aromatic gases did not substantially affect mean correlation values, suggesting that these gases likely reflect similar components of glucose metabolism, and therefore provide a comparable, interchangeable contribution to the overall strength of the model. The main study outcome variable was therefore chosen as the model based on the four-gas combination yielding the greatest predictive capability, i.e., acetone, ethanol, methyl nitrate, and ethylbenzene. While the reported observations certainly appear promising, a logical point of discussion should be the likelihood of developing this technology into practical, clinically applicable testing procedures. Different aspects of the presented results J Appl Physiol • VOL
Fig. 4. Plasma glucose profiles as directly measured and estimated via multilinear VOC analysis in the experimental subject with strongest correlation between measured and predicted values (top), in the whole group of 10 subjects (middle), and in the subject with the weakest correlation. Shifting from a 6- to a 4-gas model the loss of predictive ability was relatively small and, importantly, did not significantly worsen even in the subjects with weaker predictions. R4, R5, R6 ⫽ Pearson’s correlations coefficients obtained using 4-, 5-, or 6-gas models, respectively.
107 • JULY 2009 •
www.jap.org
EXHALED VOCS AND PLASMA GLUCOSE
time points as early as 2.5 min postglucose infusion, when plasma glucose levels were rapidly changing; we believe that the ability to derive good estimates in these conditions strengthens the conceptual feasibility of exhaled gas-based predictions. Another major strength is the remarkable flexibility of possible mathematical modeling options, based on the large number of gases that may be analyzed. As we improve our understanding of VOC response to metabolic perturbations, progressively more accurate predictive models are being generated in ongoing studies from our laboratory and others. Furthermore, as differing gases may be related to distinct circulating variables, future models may also involve prediction of other components of carbohydrate and lipid metabolism, (insulin, FFAs, cholesterol, triglycerides), and possibly biomarkers of inflammation and oxidative stress. Improvement of predictive models will also have to veer toward the identification of comprehensive algorithms applicable to the general population. While the same set of gases were used for all blood glucose predictions, individualized predictive equations with considerably variable regression parameters were needed for each subject, a result we anticipated at this stage of our research. Even after general predictive algorithms are produced, additional steps will have to be taken before the methodology can be applied to the general population. In particular, accuracy of estimates will have to be tested with multiple patterns of glycemic fluctuations: hypo-/hyperglycemia of varying magnitude and duration, differing rates of glycemic change, and different modalities by which real-life glycemic changes occur (administration of meals with different proportions of carbohydrate/lipid caloric content). The latter point appears especially relevant, considering the multiple, sometimes conflicting, effects of different nutrients on components of endogenous metabolism reflected in complex alterations of exhaled VOC patterns. Clarification of these concerns is well beyond the scope of the present report, and will require extensive analysis of the results from more complex, larger scale studies, already ongoing in our laboratory as well as in others. Given the considerable recent progress, optimization and validation of predictive algorithms seems very achievable in the near future. Evolution of our methodology toward general use also requires the creation of lightweight, low cost devices for breath-based glucose testing. Our current analytical technology is very expensive, time consuming, and uses large, bulky pieces of equipment; once a definitive set of gases has been selected, alternative analytical approaches will be required, some of which (nanotechnology, laser detectors) already allow measurement of some candidate gases in the part per billion/ part per trillion range with substantially reduced construction costs and instrumentation size. Modifications will also be needed in the mechanical aspects of gas collecting, as the current methodology may be impractical for noncooperating patients such as newborns or unconscious patients. Devices will require much smaller volumes (50 –200 ml) and for patients who cannot fully collaborate, low-resistance valve adaptors will offer gas collection over several tidal volume breaths. In the current study, exhaled gas concentrations and plasma glucose changed by several orders of magnitude, indicating that multiple intermediate biochemical steps likely occurred. While these mechanistic details are largely unclear, several known characteristics of these gases may partly explain their J Appl Physiol • VOL
159
connection to glucose metabolism. Acetone, produced via FFA oxidation (13), has been one of the earliest identified gaseous disease biomarkers, being distinctively present in the breath of patients with diabetic ketoacidosis (20, 26), hypoinsulinemic states, and starvation (2, 21). More subtle ketone fluctuations also systematically occur in response to modest, physiological changes in insulin/glucose levels. In our study, an initial small acetone spike was probably caused by the transient increase in hepatic blood flow following glucose injection (4) (1blood flow 3 1 FFA liver load 3 1 hepatic FFA oxidation); subsequently, exhaled acetone decreased (⬃ 33% below baseline at study end), likely due to the anti-lipolytic effect of the insulin response to hyperglycemia. Other groups have attempted to use acetone measurements as diabetes biomarkers; subclinical increases in exhaled acetone were detected in healthy and diabetic adults (9, 29) and in newborns (18), but never organized into the attempt to reconstruct glycemic profiles. Ethanol is not produced by human cells, but small concentrations in blood and breath derive from alcoholic fermentation of glucose by gut bacteria expressing pyruvate decarboxylase (7, 8). Following carbohydrate ingestion, blood and breath ethanol increase; we previously used, in fact, the profile of exhaled ethanol during oral glucose tolerance testing as part of a predictive model estimating plasma glucose (10). While this study administered glucose intravenously, hyperglycemia still caused consistent exhaled ethanol peaks, suggesting that glucose enrichment of gastrointestinal capillaries per se may stimulate gut bacterial fermentation to some degree. Methyl nitrate is formed in the atmosphere by nitric oxide oxidation and methylation (3, 17, 23). In humans, exhaled methyl nitrate exceeds ambient air by 5–10 pptv, and prior studies from our laboratory suggest that this net output is caused by endogenous oxidative processes (19). In fact, increased exhaled methyl nitrate paralleled the rise in systemic FFAs, and consequently lipid peroxidation, which occurs with ingestion of a fat-rich meal in healthy children (11), and with relative hypoinsulinemia in Type I diabetic children (19). In the latter study, as hypoinsulinemia caused marked hyperglycemia, methyl nitrate closely reflected glycemic levels, an effect possibly enhanced by a direct pro-oxidative effect of hyperglycemia (28). As glucose, insulin, and FFAs curves may substantially differ during metabolic perturbations, systemic oxidative status constantly shifts, likely affecting exhaled methyl nitrate levels and likely causing the biphasic shape of the gas in the current study. Xylenes and ethylbenzene from ambient air are inhaled by humans, partly metabolized by the liver (cytochrome P450 system) (22, 25), and exhaled at lower concentrations (1); by-products (methylhyppuric acid, xylenols, phenylglyoxylic and mandelic acids) are excreted in urine (5, 14). Changes in hepatic enzymatic activity, as may be induced by alcohol (12), methyl ethyl ketone (15), and, relevant to our study, by hyperglycemia (24), can affect xylene/ ethylbenzene metabolism and exhaled levels. In our experiments, rapid-onset hyperglycemia likely suppressed hepatic metabolism of the gases, causing the observed exhaled peaks. As noted for acetone, acute changes in hepatic blood flow may also have contributed. In conclusion, in 10 healthy young adults, fluctuating plasma glucose concentrations during the 2 h following an intravenous glucose bolus could be accurately predicted via multilinear regression analysis of exhaled gas profiles collected simulta-
107 • JULY 2009 •
www.jap.org
160
EXHALED VOCS AND PLASMA GLUCOSE
neously with blood draws. These studies prove the conceptual feasibility of breath-based glucose testing, and set a clear step forward toward the development of portable devices translating this technology into practical clinical applications. ACKNOWLEDGMENTS The authors gratefully acknowledge the outstanding support provided by the nurses and staff of the UC Irvine Institute for Clinical Translational Science. GRANTS This work was supported by grants from the Juvenile Diabetes Research Foundation (JDRF #1–2006-76) and NIH (MO1- RR00827-28). REFERENCES 1. Astrand I, Engstrom J, Ovrum P. Exposure to xylene and ethylbenzene. I. Uptake, distribution and elimination in man. Scand J Work Environ Health 4: 185–194, 1978. 2. Balasse EO, Fery F. Ketone body production and disposal: effects of fasting, diabetes, and exercise. Diabetes Metab Rev 5: 247–270, 1989. 3. Blake NJ, Blake DR, Swanson AL, Atlas E, Flocke F, Rowland FS. Latitudinal, vertical, and seasonal variations of C1–C4 alkyl nitrates in the troposphere over the Pacific Ocean during PEM-Tropics A and B: Oceanic and continental sources. J Geophys Res 108: 2003. 4. Bor NM, Alvur M, Ercan M, Bekdik CF. Hepatic blood flow during rapid intravenous glucose tolerance test. Res Exp Med (Berl) 177: 159 – 165, 1980. 5. Climie IJ, Hutson DH, Stoydin G. The metabolism of ethylbenzene hydroperoxide in the rat. Xenobiotica 13: 611– 618, 1983. 6. Colman JJ, Swanson AL, Meinardi S, Sive BC, Blake DR, Rowland FS. Description of the analysis of a wide range of volatile organic compounds in whole air samples collected during PEM-tropics A and B. Anal Chem 73: 3723–3731, 2001. 7. Cope K, Risby T, Diehl AM. Increased gastrointestinal ethanol production in obese mice: implications for fatty liver disease pathogenesis. Gastroenterology 119: 1340 –1347, 2000. 8. Dahshan A, Donovan K. Auto-brewery syndrome in a child with short gut syndrome: case report and review of the literature. J Pediatr Gastroenterol Nutr 33: 214 –215, 2001. 9. Deng C, Zhang W, Zhang J, Zhang X. Rapid determination of acetone in human plasma by gas chromatography-mass spectrometry and solidphase microextraction with on-fiber derivatization. J Chromatogr B Analyt Technol Biomed Life Sci 805: 235–240, 2004. 10. Galassetti P, Novak B, Nemet D, Rose-Gottron C, Cooper DM, Newcomb R, Meinardi S, Zaldivar F, Blake DR. Breath ethanol and acetone as indicators of serum glucose levels: an initial report. Diabetes Technol Ther 7: 115–123, 2005. 11. Galassetti P, Larson J, Iwanaga K, Salsberg S, Eliakim A, Pescatello A. Effect of a high-fat meal on the growth hormone response to exercise in children. J Pediatr Endocrinol Metab 19: 777–786, 2006. 12. Kaneko T, Wang PY, Sato A. Enzyme induction by ethanol consumption affects the pharmacokinetics of inhaled m-xylene only at high levels of exposure. Arch Toxicol 67: 473– 477, 1993.
J Appl Physiol • VOL
13. Koorevaar G, Van Stekelenburg GJ. Mammalian acetoacetate decarboxylase activity. Its distribution in subfractions of human albumin and occurrence in various tissues of the rat. Clin Chim Acta 71: 173–183, 1976. 14. Langman JM. Xylene: its toxicity, measurement of exposure levels, absorption, metabolism and clearance. Pathology 26: 301–309, 1994. 15. Liira J, Riihimaki V, Engstrom K, Pfaffli P. Coexposure of man to m-xylene and methyl ethyl ketone. Kinetics and metabolism. Scand J Work Environ Health 14: 322–327, 1988. 16. Marshall BJ, Plankey MW, Hoffman SR, Boyd CL, Dye KR, Frierson HF Jr, Guerrant RL, McCallum RW. A 20-minute breath test for Helicobacter pylori. Am J Gastroenterol 86: 438 – 445, 1991. 17. Moore RM, Blough NV. A marine source of methyl nitrate. Geophys Res Lett 29: 27–1-27/4, 2002. 18. Nelson N, Lagesson V, Nosratabadi AR, Ludvigsson J, Tagesson C. Exhaled isoprene and acetone in newborn infants and in children with diabetes mellitus. Pediatr Res 44: 363–367, 1998. 19. Novak BJ, Blake DR, Meinardi S, Rowland FS, Pontello A, Cooper DM, Galassetti PR. Exhaled methyl nitrate as a noninvasive marker of hyperglycemia in type 1 diabetes. Proc Natl Acad Sci USA 104: 15613– 15618, 2007. 20. Owen OE, Trapp VE, Skutches CL, Mozzoli MA, Hoeldtke RD, Boden G, Reichard GA Jr. Acetone metabolism during diabetic ketoacidosis. Diabetes 31: 242–248, 1982. 21. Reichard GA Jr, Haff AC, Skutches CL, Paul P, Holroyde CP, Owen OE. Plasma acetone metabolism in the fasting human. J Clin Invest 63: 619 – 626, 1979. 22. Sams C, Loizou GD, Cocker J, Lennard MS. Metabolism of ethylbenzene by human liver microsomes and recombinant human cytochrome P450s (CYP). Toxicol Lett 147: 253–260, 2004. 23. Simpson IJ, Meinardi S, Blake DR, Blake NJ, Rowland FS, Atlas E, Flocke F. A biomass burning source of C1–C4 alkyl nitrates. Geophys Res Lett 29: 1– 4, 2002. 24. Stewart CC, Strother A. Glucose consumption by rats decreases cytochrome P450 enzyme activity by altering hepatic lipids. Life Sci 64: 2163–2172, 1999. 25. Tassaneeyakul W, Birkett DJ, Edwards JW, Veronese ME, Tassaneeyakul W, Tukey RH, Miners JO. Human cytochrome P450 isoform specificity in the regioselective metabolism of toluene and o-, m- and p-xylene. J Pharmacol Exp Ther 276: 101–108, 1996. 26. Tassopoulos CN, Barnett D, Fraser TR. Breath-acetone and blood-sugar measurements in diabetes. Lancet 1: 1282–1286, 1969. 27. Turner C, Parekh B, Walton C, Spanel P, Smith D, Evans M. An exploratory comparative study of volatile compounds in exhaled breath and emitted by skin using selected ion flow tube mass spectrometry. Rapid Commun Mass Spectrom 22: 526 –532, 2008. 28. Yki-Jarvinen H, Bogardus C, Howard BV. Hyperglycemia stimulates carbohydrate oxidation in humans. Am J Physiol Endocrinol Metab 253: E376 –E382, 1987. 29. Zhang Q, Wang P, Li J, Gao X. Diagnosis of diabetes by image detection of breath using gas-sensitive LAPS. Biosens Bioelectron 15: 249 –256, 2000.
107 • JULY 2009 •
www.jap.org