A domain specific diagram consists of features ... of a specific domain, and that diagrams will be .... 1 for the notion of forwarding the contents of the ALU.
TOWARD THE AUTOMATED ASSESSMENT OF ENTITY-RELATIONSHIP DIAGRAMS Kevin Waugh, Pete Thomas and Neil Smith Department of Computing, Faculty of Mathematics and Computing Open University, Milton Keynes, UK, MK7 6AA {k.g.waugh, p.g.thomas, n.smith}@open.ac.uk
ABSTRACT The need to interpret imprecise diagrams (those with malformed, missing or extraneous features) occurs in the automated assessment of diagrams. We outline our proposal for an architecture to enable the interpretation of imprecise diagrams. We discuss our preliminary work on an assessment tool, developed within this architecture, for automatically grading answers to a computer architecture examination question. Early indications are that performance is similar to that of human markers. We will be using Entity-Relationship Diagrams (ERDs) as the primary application area for our investigation of automated assessment. This paper will detail our reasons for choosing this area and outline the work ahead. Keywords automated assessment, diagram understanding entity-relationship modelling.
1. INTRODUCTION Much of the activity in diagrammatic reasoning has been directed towards precise diagrams, such as the use of diagrams in mathematical proofs [4] and visual query interfaces to geographic information systems [1]. An imprecise diagram is one where required features are either malformed or missing, or extraneous features are included. Imprecise diagrams frequently occur in student answers to examination questions. The desire to assess diagrams has arisen from our investigations of the automatic grading of free-form text answers [8] (where the questions require answers that are akin to essays and are not multiple choice questions [2, 10]). The results achieved for text answers have been encouraging [3, 8]. In keeping with the automated assessment of text answers we are investigating the automated Permission to make digital or hard copies of all or part of this work for personal or classroom use is granted without fee provided that copies are not made or distributed for profit or commercial advantage and that copies bear this notice and the full citation on the first page. To copy otherwise, to republish, to post on servers or to redistribute to lists, requires prior specific permission. Teaching, Learning and Assessment in Databases, Edinburgh 2004 © 2004 LTSN Centre for Information and Computer Sciences
assessment of diagrammatic answers. In a wider context we see the automated assessment of diagrams as an example of general diagram interpretation.
2. INTERPRETING GENERAL DIAGRAMS A domain specific diagram consists of features which obey domain specific rules of structure and content (they are not arbitrary combinations of primitives, such as lines, arcs and text). A practitioner working in a specific domain would recognise well-formed diagrams as carrying meaning within that domain; furthermore they would interpret some imprecise diagrams as similar to well formed-diagrams and so infer the diagrams intended meaning. However, a diagram which completely failed to obey the rules of structure and content for the domain would not be interpretable. Different domains may use similar notations and construction rules but their interpretation may be different. Our basic assumption is that both precise and imprecise diagrams will be produced within the rules of a specific domain, and that diagrams will be drawn with the intention that they carry meaningful content in that domain and that meaning is encoded using rules of diagram composition from that domain and also from general diagram rules.
2.1 The interpretation architecture Our general approach to interpreting diagrams consists of five stages: segmentation, assimilation, identification, aggregation, and interpretation. Segmentation and assimilation together translate a raster-based input into a set of diagrammatic primitives, e.g. boxes and text. In the identification stage, domain knowledge is used to identify lowlevel, domain-specific features, the minimal meaningful units. These features are aggregated into higher-level, abstract features. Finally, the diagram is interpreted to produce meaningful results.
2.2 Resolving imprecise diagrams The resolution of imprecise diagrams depends on general diagram knowledge (how generic diagrams are drawn), domain specific diagrammatic knowledge (how this type of diagram is drawn) and domain specific knowledge (what interpretations are
valid within this domain). Inference mechanisms using the identifiable content of the diagram and the domain specific and general knowledge should be able to infer either a plausible interpretation or a repair of the diagram. The resolution may not result in either a complete interpretation of the meaning of the diagram, or a complete repair for the diagram. Depending on the intended application of the diagram it may be acceptable to record plausible alternative or partial resolutions.
3. THE FEASIBILITY STUDY In order to explore the application of our suggested interpretation architecture we investigated the construction of a diagram assessment tool for use in a computer processor architecture examination question. Diagrams were produced by student volunteers during an on-line examination using a simple drawing tool. The students’ examination answers, which included a diagram, were submitted over the Internet to an automatic assessment tool for marking and feedback. These marks were compared with those awarded by human markers.
3.1 Diagram drawing tool We adopted a very simple approach in which the drawing tool supported the creation of diagrams that are limited to two simple geometric objects that we have named boxes and links. A box has a rectangular shape and can contain text. A link is a directed line (arrow) and can also be associated with some text. The text associated with each object can be used for labelling and explanation purposes. Links are limited to joining two boxes (Figure 1). The students are not constrained in how they construct a diagram from the objects. This basic tool proved adequate for the feasibility study [7]. We will develop additional drawing tools as we begin work in other domains (such as ERDs). This approach to the inclusion of additional diagram notations is comparable to that used in the DATsys
course material the student is already familiar with from their study.
3.2 The question and marking scheme The computer processor architecture question set in the examination is shown in Figure 2. Use the drawing tool to draw a diagram that illustrates how the data hazard inherent in the execution of the pair of instructions ADD R2, R3, R1 SUB R1, R5, R4 by a 4-stage pipeline, can be overcome.
Figure 2: examination question
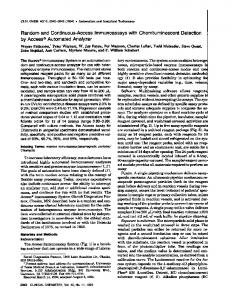
A model solution to this question is shown in Figure 1 in which boxes represent two pipelines each showing the four stages of execution of a machine code instruction (fetch, decode, execute and write). The unlabelled directed links between the boxes shows the order in which the stages occur. The data hazard referred to in the question is the fact that the execute stage of the SUB instruction requires the value of the result, R1, of the ADD instruction before the completion of the write stage of the first pipeline. There is a link labeled forward between the two execute stages showing the required data forwarding. The marking scheme supplied for the examination question is shown in Figure 3. Award marks as follows: 1 for each pipeline, 1 for the link between execute ADD and execute SUB, and 1 for the notion of forwarding the contents of the ALU to replace the contents of R1 (look for the word forward in this link).
Figure 3: marking scheme
A human marker would be expected to adapt the marking scheme or to interpret the student’s imprecise diagram when awarding marks (with the expectation of giving the student the benefit of doubt when faced with a partially correct solution).
3.3 Student solutions Examples of the type of imprecision found in the student solutions are given below (more details on the use of the diagram tool can be found in [7]).
Figure 1: The drawing tool showing the model solution to the examination question.
front-end to the CourseMaster marking system [9]. The approach of devising our own drawing tool enables us to control the format of the internal files and to customize the notations to those of the
3.3.1 Malformed features It proved difficult for students to produce structurally malformed diagrams using the diagram drawing tool. For example, the tool only permitted links to be drawn between two boxes which prevents a link being drawn between two links. However, in one case the student’s diagram consisted of a single box with a text answer typed in the box. Students produced diagrams which were malformed for the computer architecture solution either by
mislabeling the pipeline stages, or by inappropriate linking of stages in the pipelines.
the
3.3.2 Missing features It had been assumed that students would represent the ordering of the stages in a pipeline with links. However, they often showed ordering by the relative position of the boxes, as shown in Figure 4. Another feature commonly omitted was the text labelling for the boxes or the forward label.
forward link between two pipelines. So, a 4-stage pipeline is a set of 3 overlapping associations. The result of the identification stage is the set of all MMUs found in the diagram. The interpretation stage, the application of the marking algorithm, compares the MMUs found in the student solution with the MMUs found in the model solution using the marking scheme to award a grade (detail of this comparison is given below). 3.4.2 Analyzing imprecise diagrams Malformed and missing features are handled by inference mechanisms in the identification stage which identify and attempt to repair such features (in this study extraneous features within the diagram were simply ignored).
Figure 4: a typical student drawing
3.3.3 Extraneous features The most common extraneous feature was a text box containing descriptive or explanatory text; seemingly intended to supplement the diagrams, or to overcome limitations of the drawing tool. Figure 4 shows a comment box at the foot of the diagram.
3.4 Assessment tool In this study the goal of the assessment tool was to recognise { a 4-stage pipeline for the ADD instruction; a 4-stage pipeline for the SUB instruction; the forwarding of the result of the execute stage of the ADD instruction pipeline to the execution stage of the SUB instruction pipeline } and to award marks according to the marking scheme while allowing for variations between student solutions and the model solution. 3.4.1 Analyzing correct diagrams We have implemented the identification and interpretation stages of our architecture in the diagram assessment tool. Since our initial interest is in these stages, we avoided the need for segmentation and assimilation by using the drawing tool for input. Given that our previous work in automatic grading has been successful without the recognition of abstract features, we decided to explore diagram assessment without aggregation. The identification stage involves the construction of the minimal meaningful units (MMUs) from primitives found in the diagrams. In this domain we have taken the MMU to be an association: a pair of boxes connected by a link. An association represents either two stages in a pipeline or the
One such inference uses the domain specific knowledge that the precise drawing of a pipeline should include a link between each pair of stages. If a link is missing then a mechanism to infer a plausible pipeline structure from the available diagram content is required. To resolve missing links it is assumed that two adjacent boxes are associated (that is they represent an imprecisely drawn MMU with an inferred link). Further, we infer that the direction of the link in the imprecise MMU is left-to-right and top-to-bottom (an example of general diagram interpretation knowledge in the absence of domain specific knowledge). This limited form of inference was sufficient for the student solutions we have seen to date. For a diagram assessment tool all possible plausible interpretations of an imprecise diagram need to be presented to the marking algorithm to ensure due credit is given to partially correct solutions. That is, we expect a student to make mistakes and the marking algorithm will determine which of the plausible interpretations or repairs will maximise their mark. 3.4.3 Applying the marking algorithm The marking algorithm, the interpretation stage of our architecture, is guided by the model solution and marking scheme. (How the marking scheme relates to the MMUs in the model solution is reported in [6].) When alternative solutions are acceptable the marking scheme will contain more than one model solution. The model solution is assumed to be a precise diagram; it is correctly drawn using the domain diagram rules and it has an interpretation based on combinations of MMUs within the domain. The model solution is decomposed into MMUs which are then grouped to show how they relate to the marking scheme. The available marks are allocated to the MMUs in these groups. A student solution is analysed using the diagram interpretation tool with the inference mechanisms
enabled. This generates a set of plausible interpretations of the diagram each of which is a set of MMUs (these will include imprecise MMUs). The marking tool will compare each set of MMUs from the student diagram (each plausible interpretation of the student solution) with the model solutions’ sets of MMUs. A similarity measure is calculated from the pair wise comparison of MMUs in the two sets. The presence of imprecise MMUs will weaken the similarity measure to adjust for the presence of inferred features. The mark awarded for each pair of MMUs is calculated by scaling the allocated mark for the MMU by the similarity measure. Each plausible solution is awarded a mark based on the best pair wise matching between that solution and the model solution. The final mark to be awarded for the student solution is found by choosing the highest mark from all the plausible solutions.
3.5 Assessment Results 13 student volunteers used the drawing tool to create their solutions. The answers were graded by the tool and by four independent markers. The mean and standard deviation for the assessment results are given in Figure 5. The maximum mark available for the question was 4.0. The Pearson correlation coefficient for these data is 0.75 (which is significant for a sample of size 13 at the p < 0.01 level, 2-tailed), indicating that the automatic grader performs very similarly to the human markers. Human
Assessment tool
Mean
2.78
2.73
StdDev
1.05
1.09
Figure 5: human vs assessment tool grading
Despite the small sample, the results were sufficiently encouraging to suggest that this is a feasible approach to diagram assessment.
4. INVESTIGATION INTO THE AUTOMATED ASSESSMENT OF ERDS The success of the feasibility study has encouraged us to begin a full-scale investigation focused on the assessment of Entity-Relationship diagrams. The aims of the investigation are to explore issues related to the interpretation architecture and automated assessment. The feasibility study used a relatively simple diagramming notation with limited opportunities for imprecision in diagram generation. Our further investigations require an application domain with sufficient richness to allow a thorough investigation of topics such as the role of aggregation in assessment, and to devise alternative techniques to handle imprecision. Access to experienced human markers, a wider range of question styles and a large collection of student solutions is also required.
4.1 Assessment Issues To maximise the benefit to students, assessment should offer both quantitative and qualitative feedback to support their learning. The feasibility study has demonstrated that quantitative feedback (marking) is achievable within the architecture we outlined. Qualitative feedback can be achieved by extending the marking scheme to include question specific examples of common errors. These can be represented as invalid or aggregated MMUs and associated with appropriate feedback for the error they represent. A mechanism to relate these example errors in the marking scheme to the unmatched and/or imprecise MMUs in the student solution will enable directed feedback.
4.2 Experimenting with ERDs We believe that using ERDs offers scope to explore several areas of diagram interpretation and assessment in our future work. 4.2.1 Investigation of the use of a drawing tool The notations used for ERDs are relatively simple but the ERDs drawn with these notations can be complex. In addition, extending a basic ERD to include things such as attributes and sub-typing allows us to extend the basic ERD notation as the project progresses (increasing the range of MMUs in the diagrams.) This allows us to develop and adapt a basic drawing tool without limiting the complexity of the diagrams that can be produced. The simplicity of the basic notations also allows for the exploration of segmentation and assimilation in the diagram interpretation architecture by using scanned diagrams or diagrams produced by a generic drawing tool as input. There is a risk that a customised drawing tool will supply some of the knowledge and skills a question is intended to assess. Alternative inputs will permit the investigation of the effect of the drawing tool on the students’ creation of solutions; these investigations will form part of our future work. 4.2.2 Assessing different question types The assessment context for ERDs is very rich offering scope to investigate a range of assessment issues. A basic ERD can represent the solution to a wide range of different styles of question and be assessed using different styles of marking scheme. Questions that require the production of an ERD to represent a given relational model will usually have a single correct solution and the marking process mainly involves pattern matching with little interpretation required. A question based around a scenario, however, can require a great deal of domain knowledge to identify alternative equivalent solutions. A range of marking scheme issues can also be explored in this domain. For example, a
marking scheme may offer marks for the occurrence of a properly decomposed m:m relationship but offer fewer marks if the relationship appears in the solution without decomposition. Such issues also offer opportunities to explore issues related to the aggregation of MMUs.
complex questions and improving the diagram interpretation (marking algorithm). The provision of focused feedback based on a student’s submitted ERD is also of concern.
4.2.3 Availability of expertise Finally in an area as potentially subjective as assessment it is important to have access to a wide range of experienced practitioners. These practitioners will be in two groups those who set the questions and marking schemes and those who mark the student solution. We expect to use these experts both in capturing their marking expertise to inform development of the marking algorithm and to validate the results of the automated assessment tools. The widespread use of ERDs in University courses will allow any results we obtain to be validated by a wider community.
The feasibility study has shown that our approach to the representation and interpretation of diagrams is adequate for capturing the basic data from the drawing tool and for the assessment of the solution diagrams [5, 7]. The interpretation architecture shows promise for the separation of concerns to explore different approaches to diagram interpretation.
4.3 Our next steps We are recruiting student volunteers from an Open University undergraduate, database course (M358). This is a 3rd level, tutor supported, distance learning course with a typical student population of around 1,200. The course is supported by over 50 associate lecturers (ALs). It runs from February to October and covers relational database design and implementation at 2nd and 3rd level. Assessment is by four TMAs (tutor marked assignments) and a 3 hour examination. The early TMAs include questions on simple ERD production from basic text descriptions, occurrence diagrams, and relational models. The final TMA includes the production of an extended ERD from a supplied scenario. Students and ALs involved in this course have a wide range of academic and professional backgrounds (this appears typical for database courses which are often available on a wide range of degree courses). The ALs include many with over 10 years experience in the teaching and assessment of databases. We have produced an ERD drawing tool which will be made available to students on the course. The students who volunteer to take part in the study will be asked to submit copies of their unmarked ERDs to the project team by email. Marked ERDs will be forwarded to the course team by the Open University’s assessment handling office. This will give us access to both the students’ raw solutions and the marked solutions, including comments and feedback, produced by the ALs. Our initial experiment will recreate the feasibility study with a basic ERD question taken from the first TMA. Our aim is to evaluate the use of the drawing tool and to validate the result of the feasibility study. Following this experiment we intend to focus on the handling of imprecision by considering more
5. CONCLUSIONS
We have outlined our reasons for choosing ERDs as the primary application area for the further investigation of the automated assessment of diagrams We have identified a number of areas of specific interest for future research, these include the use of diagramming tools in student assessment, capturing and applying general and domain specific knowledge to resolve imprecise diagrams, representing diagrammatic marking schemes and capturing the expertise of experienced markers.
6. ACKNOWLEDGMENT The authors would like to thank the reviewers for their very useful comments on the earlier draft of this paper.
7. REFERENCES [1] Anderson, M., McCartney, R. (2003) Diagram processing: Computing with diagrams, Artificial Intelligence 145 (1-2). [2] Burstein, J., Leacock, C., Swartz, R. (2001). Automated Evaluation of Essays and Short Answers. Fifth International Computer Assisted Assessment Conference, Loughborough University, UK. [3] EAP (2002). Electronic Assessment Project. http://mcs.open.ac.uk/eap [4] Jamnik, M (1998) Automating Diagrammatic Proofs of Arithmetic Arguments, PhD thesis, University of Edinburgh. [5] Smith, N, Thomas, P.G. and Waugh, K. (2004) Interpreting Imprecise Diagrams. Diagrams 2004 - Third International Conference on the Theory and Application of Diagrams, University of Cambridge, UK [6] Thomas, P. (2003) Grading Diagrams Automatically, Technical Report, Computing Department, Open University, UK, TR2004/01. [7] Thomas, P. (2004) Drawing Diagrams in Online Examinations, Technical Report, Computing Department, Open University, UK, TR2004/14.
[8] Thomas, P.G., Price, B., Paine, C. and Richards, M. (2002) Remote Electronic Examinations: an architecture for their production, presentation and grading. British Journal of Educational Technology 33 (5). [9] Tsintsifas A., (2002), A Framework for the Computer Based Assessment of DiagramBased Coursework' Ph.D. Thesis, Computer
Science Department, University of Nottingham, UK [10] Whittington, D. and H. Hunt (1999). Approaches to the Computerised Assessment of Free Text Responses. 3rd International Conference on Computer Assisted Assessment, Loughborough University, Loughborough, UK