this problem is to apply linear data transformation and anomaly detection ... detection techniques are applied on a network connection, analyze it, and determine ...
2013 IEEE 7th International Conference on Software Security and Reliability
Toward Zero-day Attack Identification Using Linear Data Transformation Techniques Ahmed AlEroud, George Karabatis Department of Information Systems University of Maryland, Baltimore County (UMBC), Baltimore, USA {Ahmed21, GeorgeK}@umbc.edu
in analyzing ever-increasing amounts of data, generate a high amount of false alarms, fail to identify unknown (zero-day) attacks, and exhibit a low degree of reliability [1, 2, 3, 4, 5]. Zero-day (unknown) attacks are considered the ultimate challenge for all types of intrusion detection systems [6]. There have been some studies which address the problem of detecting unknown attacks. One approach is to apply unsupervised anomaly detection techniques for the discovery of new attack types [6]. Regardless of how challenging this problem is, its solution will have an immense impact in securing our computer infrastructure. However, the following issues are to be addressed when new mechanisms are introduced to detect zero-day attacks. False alert rate: While unsupervised anomaly detection techniques can detect zero-day attack patterns, they produce large and unmanageable amounts of false alerts [7]. Contextual information fusion: Existing intrusion detection techniques do not consider different categories of contextual (situational) relationships between the entities monitored, such as considering the relationships between the attacks predicted by IDSs. Based on our recent research [8, 9, 10] we have sufficient evidence to claim that the use of contextual information is instrumental in detecting known and zero-day attacks, thus adding another piece in the puzzle of detecting zero-day attacks for both pro-active and reactive protection techniques. Computational complexity of the detection process: the computational complexity of predicting and detecting zeroday attacks is proportional to the amount of data and its dimensions to be considered, which keeps on increasing. IDSs must deal with huge amounts of data at run-time in order to detect intrusions in a reasonable amount of time. In order to address the above problems, we propose an approach that applies linear data transformation and anomaly detection techniques on top of attack signatures, which are represented as attack context profiles to detect zero-day attacks. The proposed detection techniques aim to identify attacks that cannot be captured using signature matching. The approach consists of two phases, the pre-processing (static) phase, during which data are being used to create intrusion
Abstract—Intrusion Detection Systems (IDSs) have been developed for many years, but in general they fall short in efficiently detecting zero-day attacks. A promising approach to this problem is to apply linear data transformation and anomaly detection techniques on top of known attack signatures that convey contextual properties. The linear data transformation technique relies on several discriminant functions, which are used to calculate the estimated probability of zero-day attacks by analyzing network connection features. The anomaly detection technique identifies zero-day attacks using the One Class Nearest Neighbor (1-class NN) algorithm, which has been applied using Singular Value Decomposition (SVD) technique to achieve dimensionality reduction. An experimental prototype has been implemented to evaluate these techniques using data from the NSL-KDD intrusion detection dataset. The results indicate that linear data transformation techniques are quite effective and efficient in detecting zero-day attacks. Index Terms—Intrusion detection, zero-day attack, misuse detection, contextual information, one class nearest neighbor.
I. INTRODUCTION Providing appropriate protection mechanisms is critical to combating cyber security threats, and preserve information system integrity, confidentiality and availability. The protection mechanisms combat cyber threats at two levels, the network level, and the host level. The network-based protection systems monitor network flow using firewalls, antispyware systems, and Network Intrusion Detection Systems (NIDSs). Host based protection systems, monitor the status of workstations using anti-viruses, and intrusion detection systems (IDS) that are installed at the host level. In spite of the increasing efforts in designing preventive security measures, new attack types arise on a regular basis, due to programming errors, design flaws, insider threats, as well as exploitation of inappropriate protection mechanisms. Additionally, attackers keep evolving their strategies, resulting in new attack variations being undetected. Although modern IDSs are definitely useful and they improve steadily, they still struggle This work was partially supported by a grant from Northrop-Grumman Corporation, USA. . 978-0-7695-5021-3/13 $26.00 © 2013 IEEE DOI 10.1109/SERE.2013.16
159
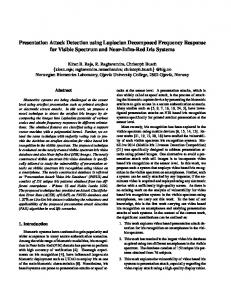
detection models ahead of time that will be used in the next phase; and the detection (run-time) phase, during which, detection techniques are applied on a network connection, analyze it, and determine whether it is a known, a zero-day attack, or a normal activity. The software modules of the prototype that are used in the static phase are: 1. The attack signature module, which defines several known attack signatures as context profiles. Attack signature focus on identifying the activity context of known attacks. Attack signature module is used at run time to detect known attack patterns. 2. The linear data transformation module, which creates several discriminant functions that linearly separate normal patterns from attack patterns. The linear discriminant functions are used at run-time to estimate the probability that a network connection, which does not match any signatures, is indeed a zero-day attack. The estimated zeroday attack probability indicates the deviation from normal activities. 3. The anomaly detection module, which is created using the one-class nearest neighbor anomaly detection algorithm (1-class-NN) [11]. The connections, which do not match any attack signature at run time phase, are compared to sampled normal activity profiles. Based on local density indicators, the anomaly detection module assigns a zero-day anomaly score to a suspicious connection. The zero-day anomaly score is used to raise zero-day alerts about the detected anomalies in network connections. If there is no significant evidence that the incoming connection is a zero-day attack, either by the estimated probability calculated using the linear data transformation module, or the anomaly score assigned by the anomaly detection module, the system deems the connection to be normal activity. The contributions of this work are three-fold: First, we utilize a linear data transformation technique to efficiently detect zero-day attacks. Second, we compare the performance of the linear data transformation technique, with the 1-class NN anomaly detection technique, in terms of detecting zero-day attacks, and the efficiency in the detection process. Third, we implemented a prototype to evaluate the accuracy of detecting zero-day attacks through a series of experiments, which show that the proposed approach has a very good rate of detecting zero-day attacks and also reduces the rate of false positives. The rest of the paper is organized as follows. Section II provides a background on IDSs, and describes the use of machine learning techniques in detecting zero-day attacks, and explains contextual-based intrusion detection. Section III describes our approach in detail. Section IV, illustrates our experiments with the NSL-KDD intrusion detection dataset. Section V concludes our research and discusses future work.
normal system execution. There have been several attempts to classify intrusion detection systems. In [4] the IDSs are classified from several perspectives, such as the data being analyzed by the system (log files data, network data), the time of analysis (online, offline) or the distribution mode utilized in analysis (centralized or distributed). However, most researchers classify IDSs into two major categories [13, 14]: Signature-(misuse) based IDSs: They measure the similarity between the events under analysis and the signatures of known attacks. Alarms are generated if previously known signatures are detected. The advantage of these systems is in their accuracy in detecting known attack patterns; however, they cannot recognize zero-day attacks. Anomaly-based IDSs: They contain an anomaly detection module to detect the patterns that deviate from a set of predefined normal profiles. The main advantage of these systems is their ability to detect new attack types that do not have matching signatures in the system. The major problem in these systems is their inability to precisely define the normal profiles. This results in predicting normal events as attacks. Machine learning techniques in zero-day attack detection: In general, most types of IDSs utilize logic operations, statistical techniques, and machine learning approaches to distinguish between different types of network activities [1, 2, 3, 4, 7, 13, 15, 16, 17, 18]. There have been few studies which address zero-day attack detection problems, most of them utilized unsupervised anomaly detection techniques to discover these types of attacks [1, 4]. Support Vector Machines (SVM) have been utilized by Jungsuk et al. in [6]. Clustering approaches have been used in [3, 4] to discover new attacks types. Hendry et al. in [3] proposed a hybrid supervised and unsupervised clustering algorithm for zero-day attack signature creation. The problem with this approach is the difficulty of creating sufficient and accurate new attack signatures at real-time. Zhichun et al. in [19] proposed a model to detect zero-day worms by analyzing the invariant content of polymorphic worms, making analytical attackresilience guarantees for the signature generation. In [5] Song et al. introduced an approach that can detect zero-day attacks from IDS alerts. The limitation of this approach was the large amount of alerts to be analyzed in order to generate zero day signatures. While such techniques have the capability of detecting zero-day patterns, however, they produce large and unmanageable amounts of false alerts [7]. Contextual-based intrusion detection: Generally, context characterizes the environment of an object; it can be considered as a dynamic grouping mechanism that encloses all information related to a particular situation. According to Brown et al. [20], context is very significant in attack detection process; nevertheless, there are not too many works about contextual-based intrusion detection. In [18] Massicotte et al. studied the effect of correlating IDS attack signatures with static and dynamic network information to derive network context. Contextual information correlation was used in [16] to correlate events which have the same context in order to detect attacks. In this paper we propose to utilize machine learning and database techniques to collect, extract,
II. BACKGROUND AND RELATED WORK Intrusion Detection Systems: There have been several works that addressed the problem of detecting cyber intrusions, which are actions by an unauthorized user to access information [12]. The purpose of IDSs is to differentiate between intrusions and 160
and model contextual information for detection of cyberattacks [8, 9, 10]. The major information dimensions for context identification were suggested by Zimmerman et al. [21]. Using this categorization, we outline some of these context categories, and some of our current work where they are utilized in: 1. The relation category: denotes the neighborhood of an entity (e.g. cyber-attacks that are related to an attack). We utilized this dimension to identify the relationships between cyber-attacks using semantic networks and context in [10]. 2. The activity category: describes events that are applicable to an entity. This category is considered to be a major dimension in intrusion detection as all activities which occur at run-time target a particular entity (computer, subnet, etc.). We utilized this dimensions in creating cyber-attack context profiles in [8]. 3. The individuality category: identifies the features of the entity itself (e.g. characteristics of computers, cyber-attacks, etc.). We utilized this dimension to characterize cyber-attacks. These characteristics are exploited in subsequent sections to detect new types of attacks and were used in [8, 9]. While the emphasis on our previous work was on utilizing relation, activity and individuality contexts to detect known attacks, our main concentration in this work is on utilizing only activity and relation dimensions of context to detect zero-day attacks. We take into account the activity dimension of context to create known attack contextual signatures. Such signatures are represented as profiles of activity-based features that characterize the local context in which specific attacks occur. We utilize the relation dimension of context to identify zero-day attacks as variations of known attack profiles. The relation among real time activities and those defined in known attack signatures is exploited in detecting zero-day attacks. Such relation is described in terms of similarity between incoming activities and features of attack signatures. Similarly, we characterize the local contexts in which various forms of normal activities occur. We create several normal activity profiles that aid in identifying anomalies as zero-day attacks. The relation among real time activities and those defined in normal activity profiles is also exploited in detecting zero-day-attacks. Such a relation is described in terms of the degree of deviation among incoming activities and the stored normal activity profiles. The next section describes our approach in detail.
Anomaly Detection
Normal Activity Sampling
Linear Data Transformation
Bi-Class Sampling
Dimensionality Reduction
Connections to create detection techniques
Network Connections Repositry
No matched Signatures Attack Signatures
Matched Connections to evaluate the Signatures detection techniques
Pooled Covariance Matrices
The static phase
Discriminant Functions
Normal Activity No matched 1- class-NN Profiles(NPs) Signatures anomaly detection The run time phase
Zero-day Known Attacks Estimated Probability (EP) >ZEP
Zero-day Anomaly Score
(AS)>ZAS
Zero-day Attacks
Fig. 1. The approach steps
The events in the dataset are presented in a high level format called connection records (a sample of these connections is shown in table I. Each connection record consists of 41 features (38 numerical and 3 categorical). TABLE I: A SAMPLE OF CONNECTION RECORDS WITH SOME FEATURES CID protocol service flag src Duration Label bytes C1 Tcp Irc Rej 0 Satan 200 C2
Tcp
Bgp
Rej
0
150
Satan
C3
Tcp
Courier
Sh
0
90
Nmap
C4
Tcp
Domain
Sh
0
0
Nmap
Cn
Udp
Domain
Sf
29
0
Normal
The connection records are labeled as normal or attacks, where the attacks are categorized in one of the following four categories: user to root (U2R), remote to local (R2L), denial of service (DoS), and probe. The connections in this repository are divided into two parts: x The connections to generate the detection techniques (the training part): These connections have been utilized during the static phase to create the normal activity profiles (NPs), and to create the discriminant functions; both are used in detecting zero day attacks. x The network connections to evaluate the detection techniques (the evaluation part): these connections are used during run-time to evaluate the rate of detecting zeroday attacks and also to assess the technique’s computational efficiency. The Attack Signatures Module: it consists of known attack signatures, which are formed using the conditional entropy of attacks based on occurrence of particular features in the training connections; hence, they serve as activity context
III. THE APPROACH In this section, we provide an overview of the zero-day attack detection approach and a description of the prototype system. Fig. 1 illustrates the major modules in the system. We now provide an abstract description about the modules of the static phase and then their usage at dynamic (run-time) phase. The Network Connections Repository: a database that stores events collected by network sensors along with their features such as connection protocol, connection duration, services requested, as well as packet flow statistics, etc. The repository data is obtained from the publicly available intrusion detection dataset NSL-KDD [22]. 161
Value decomposition (SVD) dimensionality reduction to efficiently calculate an anomaly score.
quantifiers, meaning that the occurrence of particular events (i.e. feature values) during the connection may increase or decrease the uncertainty about the possibility of particular attacks. In order to create this module, we carried out feature discretization (binning) to convert the numerical features of the training connections into bins. We carried out binning to create attack signatures from the connection record features.
Using the Anomaly Detection Module at run-time: Given an incoming connection record as an input, the 1- class NN algorithm detects the deviation of such connection from the normal activity profiles. This is done by calculating the anomaly score (AS) for the suspicious incoming connection record. The anomaly score is calculated for those connections that are passed to the Anomaly Detection Module by the Attack Signature Module. The anomaly score is compared with a user defined zero-day anomaly (ZAS) threshold to decide whether the connection record is a new attack pattern or a normal behavior. Next, we provide an overview of the steps required to implement the modules of the prototype.
Using attack signatures at run-time: During the run-time phase, the connections in the evaluation part are passed to the Attack Signatures Module. If the connection matches any attack signature, a known attack alert is issued. Some connections might not match any attack signature. These connections may indicate either normal activity or a zero-day attack, so they will be processed by the linear data transformation module or the anomaly detection module. Both modules are used to detect any possible zero-day attacks in these connections. The Linear Data Transformation Module: It implements a process consisting of several steps. First, Bi-class sampling is used to select several samples from connections in the training set. Each sample consists of two sets of connections, normal connections and connections from a single attack type (label). Next, the pooled covariance matrix is calculated for each sample. The pooled covariance matrix is used in defining two discriminant functions for each sample. We utilized Linear Discriminant Analysis (LDA) [23] to generate these discriminant functions and store them as activity profiles that have the capability to discriminate between the activity context of normal and known attacks. Each discriminant function is defined via linear coefficients. Two sets of linear coefficients (two discriminant functions) are defined for each sample, one to linearly describe the activity context in which the sample’s attack label occur, and the other is to describe the sample’s normal activity.
A. The Attack Signatures Module The main purpose of the Attack Signatures Module is to detect any attacks that are relevant and specific to a particular context. The attack signatures represent the activity category of context, as the attack activities are modeled as a set of events with a pre-defined goal. TABLE II. CONDITIONAL PROBABILITIES VALUES FOR SOME ATTACKS/ FEATURES IN THE DATASET Feature Attack Guess Password Ftp write Nmap
Using Data Transformation Module at run-time: The purpose of generating discriminant functions is to use them at run time to estimate the probability of attack labels given the features of connections, which are passed by the Attack Signature Module. Once the estimated probability of each attack label using its corresponding discriminant function is calculated, the highest estimated probability value (EP) is selected. Such a value is compared to a user tunable zero-day cut-off point ZEP, and if the estimated probability (EP) is greater than the cut-off point ZEP, the connection is declared as a zero-day attack.
Service [V]* Telnet Ftp eco_i Login Ftp Ftp_data eco_i private
[CP] * 0.98 0.01 0.01 0.01 0.02 0.97 0.47 0.53
# of shells [V]
[CP]
0
1
0
1
0
1
# of accessed files [V] [CP] 0 1 1
0
0
0.63
1
0.37
0 1
1 0
*[V] Feature value, *[CP] Conditional probability
The Attack Signatures Module consists of several known attack signatures which are stored as profiles. The attack profiles are created using conditional entropy [24]. In the context of intrusion detection, conditional entropy can be expressed as the amount of information needed to infer the degree of uncertainty about attacks based on the occurrence of particular events (connection features). We use conditional entropy to create known attack signatures using their patterns in the training connections [10]. Conditional entropy relies on the conditional probabilities of attack based on the occurrence of particular features values. For instance, table II shows a set of attacks with some connection features (Service, Number of shells, and Number of accessed files). The value column ([V]) lists feature values. The degree of co-occurrence between attacks and such feature values is expressed as conditional probabilities (column [CP]). In general, the higher the values of probability of features when conditioned on an attack (the conditional probability), the lower the conditional entropy of that attack when conditioned on these features, and thus, the
The Anomaly Detection Module: We implemented the anomaly detection module using the one class nearest neighbor algorithm (1- class NN) [11]. The anomaly detection module stores a set of Normal Activity Profiles (NPs) sampled from the Network Connections Repository and labeled as normal. The (1-class NN) algorithm is used at run-time to detect zero-day attacks by measuring the deviation of an incoming connection C from NPs. To reduce the number of numerical dimensions (i.e. features) of both connection record C under evaluation and the sampled NPs we used Singular 162
lower the uncertainty about the occurrence of such an attack. The probability values are used in calculating the conditional entropies of attacks. Eventually, the values of conditional entropy of a particular attack �� on the condition of occurrence of value �� of feature �� are used in creating attack signatures. It can be seen in Table I that the Guess Password attack occurs frequently (CP=0.98) with telnet service. The conditional entropy of guess password when conditioned on telnet service is ≈ 0. However, this is only for one feature. Thus, the features which produce very low conditional entropy are used in creating attack signatures which are expressed as a set of feature value pairs. We use six features to create each attack signature. For example, the following is the signature of Guess Password attack.
in [15], however, it utilizes a single classification function, which is typically not effective in the intrusion detection process. To handle such a limitation, some authors proposed to use it in conjunction with other techniques such as decision trees (DT) to produce multiple classification rules [15], however, there are several problems with these approaches. First, the effectiveness of these approaches relies mainly on statistical distribution of the IDS data used during the learning phase; if the data does not follow a multivariate normal distribution, the extracted patterns will not precisely detect intrusions. Second, when LDA is combined with DT, the number of resulting rules is usually very large, and redundant rules are very possible. Thus, the basic linear discrimination analysis techniques are not very effective on detection of intrusions. To overcome these problems we modify the basic technique by considering local patterns in the data set. We applied linear discrimination on different samples, where each sample consists of several normal connections and all connections of a single attack type (label). We then use the resulting discriminant functions to detect zero-day attacks. We applied the following procedure to use LDA through a linear data transformation process to detect zero-day attacks.
⌈ �� _ � (� �� �), ����_��(���� , ����), ������� � �_��(0), # ���ℎ ��_ �(0), #����_ �(0), # �� �
�� � � � �_ �(0) → �!"$$ %&$$'*+-⌉
At run-time an attack signature matches connection C features, if and only if, for each feature value in connection C, there is at least one matched value for that feature in that attack signature. A known attack alert is raised for each attack whose signature is triggered by the features of connection C. If no signatures are triggered, the connection C features will be processed either by the Linear Data Transformation Module, or by the Anomaly Detection Module.
1. Bi-class Sampling: this step has been carried out by selecting many two-class (normal activity, attack) samples from the training connections. The purpose of creating these samples is to define linear discriminant functions which describe different types of attack and normal activities in the training connection. We selected a normal sample with each attack type (label). Stratified sampling is used to sample normal activities. Additionally, each sample consists of all instances of a particular attack label. The ratio of normal connections to number of attack connections in each sample is (99:1). Let us assume that for all attack patterns in the training part of the dataset, �2 represents the number of normal connections in the sample and �3 represents the number of attack connections in the same sample. The next step is to calculate the pooled covariance matrix for each sample.
B. The Linear Data Transformation Module We use linear data transformation to detect zero-day attacks at run-time. The linear data transformation, which is carried out via linear discriminant analysis, preserves linear relationships between variables. Therefore, the correlation between variable / and the transformed one 1 would be unchanged after such transformation. Typically, the discriminant analysis techniques exploit aggregate statistics (e.g. the mean of numerical features), and the co-variance between numerical features in the original space to produce a set of discriminant functions that fit attack and normal activity patterns in the original feature space. The purposes of such transformation in the context of this work are to: 1. Find a few linear discriminant functions that describe different types of attack and normal activities in the training connections and store them as profiles. This represents a new linear sub-space that describes the attack and normal patterns in the data. 2. Transform the connections that do not match any attack signatures at run time into the same linear sub-space. 3. Calculate the probability of such connections being zeroday attacks, or normal activities.
2. Pooled Covariance Matrix Calculation: The covariance matrices are used to extract sufficient, yet representative statistics about the correlation between the features of training connections. In order to define the discriminant functions for each sample, a matrix called pooled covariance matrix is required. To illustrate the process of creating the pooled covariance matrix, we assume that the dataset has only two numerical features �2 ,�3 .The number of bytes sent from source to destination is one example of such numerical features in the dataset. Let �2 , �3 denote sample covariance matrices. The pooled covariance matrix � is then defined by:
We utilized Linear Discriminant Analysis (LDA) in the linear transformation process. LDA is a method of finding such a linear combination of variables that best separate two or more classes (labels). It is not a classification algorithm, although it makes use of class labels. However, the LDA result is mostly used as part of a linear classifier. One of the main advantages of using LDA is that it is computationally efficient as shown
(�2 − 1)�2 + (�3 − 1)�3 (1) (�2 + �3 − 2) Discriminant Function Definition: Let /̅2 ,8/3 denote the �2 , �3 sample means. We use 8/2 , /̅3 and the pooled �=
3.
163
covariance matrix � in defining two linear discriminant functions (since each sample contains two classes: normal, and attack). Each discriminant function consists of two linear coefficients (since the data in this procedure scenario has only two features), and a function constant. The results are stored in matrix 9 as follows
TABLE III. CONNECTION RECORDS WITH LABELS
9 = (/̅2 − /̅3 ): �;2 / (2) where � is the inverse of the pooled covariance matrix calculated in equation 1. The matrix 9 gives us two entries: x The discriminant function coefficients for normal class sample �2 and a function constant. ;2
x
CID
Duration
C1 C2 C3 C4 C5 C6
181 302 151 0 0 0
Source Bytes 1511 1735 1587 103 103 110
Label Attack Attack Attack Normal Normal Normal
Suppose that these connections do not match any attack signature at run-time. Let us also assume that the linear discrimination space consists of the following pre-calculated pooled covariance matrix � for particular samples in the form (attack �� , normal activity), and their corresponding discriminant function coefficients matrix 9 . For simplicity we consider only one set of discriminant functions.
The discriminant function coefficients for attack class sample �3 and a function constant.
3.2539 −0.2235 �=B H −0.2235 0.6015 −63.5746 1.0674 14.4540 9=B H −0.8048 −0.1144 −1.5486
The same procedure is applied for all samples selected from the training part of the data set. The outcomes of applying these steps are 22 (the number of attack types in the training data) sets of linear functions. Each set consists of two functions with their coefficients, the first function is used to find the probability that a particular incoming connection is a normal activity and the other is used to find the probability that it is an attack. The second function is used to estimate the possibility of zero-day attacks as we show next. At run-time, the connections which are passed from the Attack Signature Module may indicate new attack patterns (zero-day attacks), or new forms of normal activities that have not been previously captured. To find such patterns, our technique is used to detect zero-day attacks with linear computational complexity. The discriminant functions calculated during the static phase are used at run-time to discover zero-day attacks as follows. For any connection with two numerical features (x1, x2) delivered to discriminant functions, two linear scores are calculated: The first one represents the probability of attack, and the second measures the probability that the connection record is a normal activity. The higher the values of the linear score, the higher the certainty about the result. It should be noted that the linear scores are not normalized probabilities and may even take negative values. To obtain the estimated probabilities of attacks or normal activities, we applied softmax transform normalization [25] on linear scores so that they sum up to 1. Since we have several estimated probabilities of attacks (one from each discriminant function), the one with the maximum value is selected. The selected value is compared to a tunable user defined zero-day estimated probability threshold ? . The ? is used to declare the connection as a new zero-day attack if its estimated probability @A value > ? ; otherwise, declare it as a normal activity. The following example explains the zero-day attack detection process using linear coefficients. Example: Table III shows a sample of six incoming connections that are used at run-time. The first three are labeled as attack connections, and the last three as normal activities.
Using � and 9 , the linear score L of attack �� and the normal activity, given the connection records in table II, are calculated as follows. 1. Formulate the connection matrix A using those connections in Table II. The matrix A consists of the duration, source bytes columns and another column with “1” entries. The last column needs to be added to A to make its column dimension consistent with 9 : the (transpose of linear coefficients matrix 9). 2. Multiply A by 9 : to find the attack �� and normal linear scores (L �). Lastly, the attack �� and normal activity estimated probabilities @A are calculated by applying softmax transform on L � as follows. ⎡ ⎢ ⎢ @A = ⎢ ⎢ ⎢ ⎣
����
� �� ���� P �� @A Q����� @A �2 0.972 0.028 ⎤ ⎥ �3 0.980 0.020 ⎥ �R 0.670 0.330 ⎥ �S 0.119 0.891 ⎥ �T 0.236 0.764 ⎥ �U 0.10 0.900 ⎦
Assuming that the ? threshold is 0.6, then �2 , �3 and �R are declared as zero-day attacks, while �S , �T , �U are considered normal activities. C. The Anomaly Detection Module The Anomaly Detection Module has the capability of analyzing connection records that do not have matching signatures. In this work we apply a variation of a semisupervised anomaly detection technique called One Class Nearest Neighbor (1-class NN). This technique has been proposed by Tax et al. in [11]. We modified its implementation to detect anomalies that may reveal zero-day attacks. 1-class NN is one of the density based anomaly detection techniques, which in general presume that 164
result in an almost linear complexity of NN algorithms depending on the selected sample size. 2. Dimensionality Reduction: we used Singular Value Decomposition (SVD) to reduce the number of numerical dimensions (i.e. features) of both the incoming connection record C under evaluation, and the normal activity profile connections. The dimensionality reduction process aims to minimize the nearest neighbor computation time by reducing the number of dimensions used in distance computation.
normal instances occur in dense regions, while anomalies occur far from their closest neighborhoods. Consequently, if a connection record lies in a low density neighborhood it can be declared as anomaly (a zero-day attack). On the other hand, a connection which lies in a dense neighborhood can be declared as normal activity. Nearest neighbor anomaly detection techniques require distance or similarity functions to be defined between instance features. There are several distance measures that can be utilized, and we chose Euclidian distance since it is one of the widely used measures in anomaly detection, and it produces very good results [26]. The 1-class NN compares the connection record local density with its nearest neighbor’s (selected from the normal activity profiles) local density. Typically, the first nearest neighbor is used for local density estimation. The lower the local density of the incoming connection record compared to its nearest neighbor, the higher the probability that the connection is indeed a zero-day attack. The following is the acceptance function that calculates the anomaly score � of connection record C and compares it to a user defined zero-day anomaly threshold ZY[ . |� − QQ \? (�)| � (�) = >