AbstractâState estimation is critical to the operation and control of modern power systems. However, many cyber-attacks, such as false data injection attacks, ...
This article has been accepted for publication in a future issue of this journal, but has not been fully edited. Content may change prior to final publication. Citation information: DOI 10.1109/TII.2018.2825243, IEEE Transactions on Industrial Informatics IEEE TRANSACTIONS ON INDUSTRIAL INFORMATICS
1
Online False Data Injection Attack Detection with Wavelet Transform and Deep Neural Networks James J.Q. Yu, Member, IEEE, Yunhe Hou, Senior Member, IEEE, and Victor O.K. Li, Fellow, IEEE
Abstract—State estimation is critical to the operation and control of modern power systems. However, many cyber-attacks, such as false data injection attacks, can circumvent conventional detection methods and interfere the normal operation of grids. While there exists research focusing on detecting such attacks in DC state estimation, attack detection in AC systems is also critical, since AC state estimation is more widely employed in power utilities. In this paper, we propose a new false data injection attack detection mechanism for AC state estimation. When malicious data are injected in the state vectors, their spatial and temporal data correlations may deviate from those in normal operating conditions. The proposed mechanism can effectively capture such inconsistency by analyzing temporally consecutive estimated system states using wavelet transform and deep neural network techniques. We assess the performance of the proposed mechanism with comprehensive case studies on IEEE 118- and 300-bus power systems. The results indicate that the mechanism can achieve a satisfactory attack detection accuracy. Furthermore, we conduct a preliminary sensitivity test on the control parameters of the proposed mechanism. Index Terms—False data injection attack, AC state estimation, discrete wavelet transform, deep neural network, cyber attack detection.
I. I NTRODUCTION
W
ITH the incorporation of information and communication technologies, power systems are gradually transforming into smart grids [1]. However, power system applications, such as state estimation [2], are facing great challenges due to their dependency on telecommunications. One significant concern is their vulnerability to cyber attacks [3]–[5]. Adversaries of power grids can access and manipulate system variable measurements by either attacking the measurement devices or compromising the communication infrastructures [6]. As a result, compromised system states may interfere the operation of the grid, leading to either physical or economical impacts on the power system. References [7], [8] present comprehensive surveys on the impacts of such cyber attacks. Among common attacks in cyber-physical systems, false data injection attack (FDIA) is considered one of the most challenging threats for the state estimation [7], [9]. Different from other attacks such as distributed denial of service and jamming, successful FDIA can circumvent the conventional residual-based bad data detection mechanism [10]. Without advanced detection mechanism, FDIA can be stealthily launched multiple times, rendering a significant threat to the grid [8]. Much research effort has been devoted to investigating possible ways of constructing FDIA [8]. Most of the existing This work was supported by the Theme-based Research Scheme of the Research Grants Council of Hong Kong, under Grant No. T23-701/14-N.
work on constructing FDIA focuses on attacks in power systems with DC state estimation under different scenarios due to simple analytical models of the system [7]. For instance, a commonly recognized attack scenario is that the adversary has partial configuration information of the power network, and can manipulate a partial set of system variable measurements [9], [11], [12]. In the presented methods, FDIA can successfully bypass conventional detection methods and inject malicious data into the system. In the meantime, FDIA targeting AC state estimation is gradually gaining attention in recent years, and analytical studies have been conducted to construct such attacks. References [13]–[15] present viable methods to perform FDIA in AC state estimation with complete or incomplete system knowledge. To conclude, both DC and AC state estimations are prone to FDIA. At the same time, many results have been reported to defend against FDIA in DC state estimations1 . Various techniques have been employed to detect DC FDIA, such as statistical methods [16], Kalman filter [17], sparse optimization [18], state forecasting [19], [20], network theory [21], timeseries simulation [22], and machine learning [23]–[26]. They all demonstrate satisfactory detection performance and falsealarm rates against DC FDIA. Interested readers can refer to [7] for a survey on the detection methods of FDIA. However, there is still a research gap in the current FDIA detection paradigm. All previously referenced publications investigate attacks targeting DC state estimations, which use different system models from the AC ones employed in most real world utilities [15]. As will be demonstrated in Section IV, conventional DC FDIA detection methods cannot detect AC FDIA with satisfactory performance. Little work has been done on detecting AC FDIA in the literature, especially defending against recent attack patterns, e.g., [14] and [15]. In [27], the authors propose an FDIA detection mechanism for AC state estimation based on the Kullback-Leibler distance of the probability distributions of nominal operating conditions and compromised system states. However, its robustness considering normal power system events, such as load distribution changes, is unknown. As the manipulated system states of new attack methods obey Kirchhoff’s circuit laws [15], it is possible that these attacks can pretend to be normal operating condition changes to avoid being detected. In [28], the authors develop an information-network-based state estimation technique to defend against AC FDIA. In [29], the authors actively change the transmission line parameters to detect AC FDIA. Both studies aim at AC FDIA constructed with 1 FDIA aiming to compromise system states in AC/DC power systems are called AC/DC FDIA in the sequel.
1551-3203 (c) 2018 IEEE. Personal use is permitted, but republication/redistribution requires IEEE permission. See http://www.ieee.org/publications_standards/publications/rights/index.html for more information.
This article has been accepted for publication in a future issue of this journal, but has not been fully edited. Content may change prior to final publication. Citation information: DOI 10.1109/TII.2018.2825243, IEEE Transactions on Industrial Informatics IEEE TRANSACTIONS ON INDUSTRIAL INFORMATICS
full power network information, and their performance on the latest proposed attacks based on partial network information, e.g., [15], is unknown. To bridge the research gap, in this paper, a new AC FDIA detection mechanism is proposed which considers recent AC FDIA patterns. Different from previous work for detecting FDIA, which only adopts the spatial data characteristics in the system state of one time instance to identify attacks, the proposed mechanism also learns from the temporal data correlation presented in consecutive system states. To achieve this, we adopt the discrete wavelet transform (DWT) algorithm and recent advances of deep neural networks (DNN) techniques and construct an intelligent system for AC FDIA detection. In the system, DWT aims to extract the system state features in a period of time, and DNN further learns from the temporalspatial characteristics of the features in a sequence of time periods to distinguish AC FDIA from normal power system operation events. The main contributions of this paper are listed as follows: • This work is among the pioneer studies of using DNN in FDIA detection research. In addition, the proposed mechanism extracts not only spatial (as did in [23], [25]) but also temporal power system dynamic features for attack detection, which is novel and effective. • The proposed mechanism aims to detect FDIA in AC state estimation, especially recent attack patterns with incomplete power network information [15]. • We assess the proposed mechanism with recently proposed FDIA patterns on two power system test cases. The simulation results demonstrate satisfactory attack detection accuracy and false alarm rate. • Parameter sensitivity test is carried out to evaluate the performance and characteristics of the proposed mechanism. The remainder of this paper is organized as follows. In Section II we briefly introduce the current state estimation methods and its vulnerability against FDIA. Section III elaborates on the proposed FDIA detection mechanism, with detailed explanation on the architecture and implementation issues. Section IV demonstrates the numerical results on the tested power systems with parameter sensitivity studies. Finally, we conclude this work in Section V. II. S TATE E STIMATION AND FALSE DATA I NJECTION ATTACK In this section, we first briefly introduce the state estimation method employed by the utilities and the incorporated bad data detection mechanism. Then we give a general pattern of successful FDIA targeting AC state estimation. A. State Estimation and Bad Data Detection The basic principle of state estimation is to estimate the operating condition of the power system using system variable samples from the measurement units [30]. Typical measurements include voltage and complex power injections at buses, and complex power flows on branches. Based on the AC
2
power flow model, we can construct the relationship between measurements z and system states x as follows: z = h(x) + e,
(1)
where h(·) is the nonlinear dependency between measurements and system states, and e is the additive noise with a covariance R. The equations defined by h(·) are determined by the grid topology and transmission line parameters. State ˆ which fits estimation tries to find an estimated system state x the measurements z best according to the dependency h(·) considering sampling noise. Subsequently, given z, h(·), and R, system states can be estimated by minimizing the weighted least-square [30], [31]: ˆ = argmin[z − h(x)]T W[z − h(x)], x x
(2)
where W ≡ diag{R−1 }. In practice, (2) can be solved using iterative approximation methods, e.g., Newton–Raphson method. However, due to the non-linearity of h(·) and the iterative manner of the approximation solutions, solving (2) can be computationally expensive [2]. Furthermore, the convergence is not guaranteed [31]. As an alternative, power system engineers sometimes employ a linearized DC power flow model to approximate the AC model. DC model simplifies the system by making three assumptions: 1) line resistance is negligible, 2) bus voltage profile is flat, and 3) voltage angle deviation over transmission lines is small. As a result, the relationship in (1) can be simplified to z = Hx + e,
(3)
where H is the measurement Jacobian matrix [31]. Accordingly, (2) is transformed into ˆ = argmin[z − Hx]T W[z − Hx], x x
= (H WH)−1 HT Wz ≡ Ez, T
(4)
where E ≡ (HT WH)−1 HT W. This closed-form solution can provide fast estimated states, but also introduce approximation error due to the DC power flow model assumptions [31]. Considering the sampling error of measurement units and potential malicious attacks, current power systems employ a residual-based bad data detection mechanism to protect state estimations [31]. The measurement residual is calculated using the difference between observed measurements z and measurements inferred by the estimated system state, denoted ˆ = h(ˆ ˆ = Hˆ by z x) (AC model) or z x (DC model). Bad data detection mechanism compares the Euclidean norm of ˆ with a threshold τ . If ||r||2 > τ , the residual r = z − z the estimated state is considered compromised by bad data; ˆ is trust-worthy. The value of τ is typically otherwise x determined by a hypothesis test Pr{||r||22 ≥ τ 2 } = α, where α is the confidence level [31]. B. FDIA with Complete Network Information The objective of adversaries to perform FDIA is to mislead ˆa = x ˆ + c as the system operator consider a compromised x the estimated system state, where c is the deviation of power
1551-3203 (c) 2018 IEEE. Personal use is permitted, but republication/redistribution requires IEEE permission. See http://www.ieee.org/publications_standards/publications/rights/index.html for more information.
This article has been accepted for publication in a future issue of this journal, but has not been fully edited. Content may change prior to final publication. Citation information: DOI 10.1109/TII.2018.2825243, IEEE Transactions on Industrial Informatics IEEE TRANSACTIONS ON INDUSTRIAL INFORMATICS
3
system state. To achieve this, an adversary can change the received measurements at the control center to za = z + a, where a is the injected attack vector. To circumvent bad data detection mechanism2 , the attack vector should be constructed as a = h(ˆ x + c) − h(ˆ x).
(5)
In such cases, the Euclidean norm of the residual is unchanged: ||ra ||2 = ||za − h(ˆ xa )||2 = ||z + a − h(ˆ x + c)||2 ˆ||2 = ||r||2 , = ||z − z
(6)
and the attack can bypass the residual-based detection. The detailed attack vector construction process is elaborated in [13], [32]. However, there is one drawback in this FDIA pattern. According to (5), the adversary requires complete knowledge of the grid, including the topology (h(·)) and estimated states (ˆ x). In the meantime, FDIA can only utilize less-than-perfect system information in practice [7]. To consider this limitation, recent work proposed new FDIA patterns using partial system knowledge [14], [15]. For instance, a recently published result in [15] successfully constructs injected attack vectors using voltage angle differences of selected transmission lines, which will be introduced next. C. FDIA with Partial Network Information In [15], the rule of thumb of using partial network information to construct FDIA injection vector is to satisfy the Kirchhoff’s circuit laws, given only selected voltage angle differences. Specifically, the voltage angle differences of lines connecting a compromised bus and another non-compromised one are used to calculate feasible power flows of respective lines, and thus the power injections of the compromised buses are obtained. Those for the other buses can consequently be calculated by the algebraic sum of all connecting buses. Utilizing the above idea, an attack vector can be constructed as follows [15]: 1) Initialize the system state vector [V θ ]T = [V0 θ 0 ]T , where V0 is the initial attack voltage profile. 2) Compute the attack vector [P Q p q]T (bus real/reactive power injection and line flow) using the current [V θ ]T . 3) Check the constructed attack vector against the upper and lower bounds of real power bus injections and real/reactive power line flows [15]: P ≤ P ≤ P , −p ≤ p ≤ p, −q ≤ q ≤ q,
(7)
where the over-lined and under-lined variables are the upper and lower bounds, respectively. If all bounds are satisfied, [V θ ]T is used as the attack vector. Otherwise continue. 4) Calculate the incremental state vector [∆V ∆θθ ]T by solving an optimization problem: minimize
10 X
1T Si
i=1 2 In
the sequel, we consider AC power flow model unless mentioned.
(8a)
∂P /∂V ∆P ∆Q ∂Q/∂V subject to ∆p = ∂p/∂V ∆q ∂q/∂V 0 ∆V
∂P /∂θθ � � ∂Q/∂θθ ∆V ∂p/∂θθ , ∆θθ ∂q/∂θθ 1 (8b)
P ≤ P + ∆P + S1 − S2 ≤ P , − p ≤ p + ∆p + S3 − S4 ≤ p, − q ≤ q + ∆q + S5 − S6 ≤ q,
(8c) (8d) (8e)
V ≤ V + ∆V + S7 − S8 ≤ V ,
(8f)
θ ≤ G(θθ + ∆θθ ) + S9 − S10 ≤ θ ,
(8g)
where G is the coefficient matrix that transforms bus voltage angles into line angle differences. Variables Si are slack control variables that determine the incremental state and attack vector [15]. 5) Update attack vector [V θ ]T ← [V θ ]T + [∆V ∆θθ ]T and go to Step 2. By repeating this process, the adversary can construct an attack vector against AC state estimations without being detected by the residual-based bad data detection method [15]. In addition, as will be illustrated in Section IV, the constructed attack vectors can also bypass the detection of many existing DC FDIA detection methods. Therefore, it is essential to develop a new mechanism that focuses on detecting AC FDIA. III. O NLINE FALSE DATA I NJECTION ATTACK D ETECTION M ECHANISM As analyzed in Section II, well-constructed FDIA can effectively bypass bad data detection mechanism in AC state estimation. This is because the injected false data satisfy Kirchhoff’s circuit laws [15], rendering all residual-based attack detection methods invalid. Thus it is not possible for the system operator to distinguish FDIA from normal power system events given measurements from the same sampling time period. However, this does not make FDIA undetectable. Synchrophasor data of a power system over a period of time can be considered as a temporal-spatial matrix/tensor. It is widely accepted that the data have spatial correlation, which is represented by Kirchhoff’s Laws. At the same time, the temporal correlation also exists in power systems among consecutive time slots, which is especially strong in transient and dynamic operations due to the inertia and momentum in the whole system. In current FDIA constructions, adversaries focus on constructing attack vectors satisfying the spatial dependencies of system variables, i.e. (5), and AC power flow equations [14], [15]. The temporal dependency between consecutive system states, or power system dynamics, is ignored. This correlation in system states can provide more information for the system operator to detect FDIA while reducing false-alarms on normal grid events. Utilizing this principle, in this section we propose an online FDIA detection mechanism using recent advances in deep learning techniques. We first elaborate on the structure and data flow of the proposed mechanism. Then we present the detailed implementation of the mechanism with brief introductions to the techniques employed. Finally, we discuss the
1551-3203 (c) 2018 IEEE. Personal use is permitted, but republication/redistribution requires IEEE permission. See http://www.ieee.org/publications_standards/publications/rights/index.html for more information.
This article has been accepted for publication in a future issue of this journal, but has not been fully edited. Content may change prior to final publication. Citation information: DOI 10.1109/TII.2018.2825243, IEEE Transactions on Industrial Informatics IEEE TRANSACTIONS ON INDUSTRIAL INFORMATICS
4
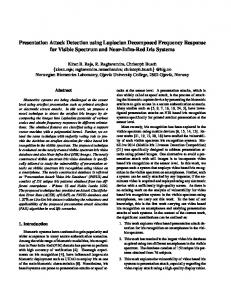
Power Network Knowledge
Power System Variable Measurements
State Estimator
Bad Data Detector
Bad Data Detected
No bad data
History System State
Feature Extractor ... Attack Detector
...
Feature History Database
Proposed FDIA Detector
No Attack
Attack Detected
Fig. 1. Proposed online FDIA detection mechanism with a DNN based attack detector.
offline training and online detection processes of the proposed mechanism. A. Proposed Detection Mechanism The proposed FDIA detection mechanism is depicted in Fig. 1. This mechanism considers the system states and measurements from consecutive discrete sampling time instances, i.e., the time instances when the conventional state estimation takes place. These sampling time instances may have an interval ∆ ranging from milliseconds (PMU-based measurement systems) to a few seconds (conventional SCADA system). At an arbitrary sampling time instance t, the mechanism takes real-time measurements zt and the utility’s knowledge of the power network h(·) as inputs, and develop FDIA attack detection results as the output. The input data first go through an AC ˆt state estimator, which estimates the current system state as x [2], [30], [31]. The estimated state is then tested with the bad data detector to prune any measurements with bad data. In this step, bad data caused by sampling and communication errors can be effectively detected, since they generally do not satisfy the circuit laws, rendering high residual values [8], [31]. After these conventional state estimation processes, the proposed FDIA detection mechanism introduces a new FDIA detector to further analyze the estimated system states. The detector, as shown in the dashed box in Fig. 1, comprises two data processing schemes. It takes the estimated system ˆ t from the previous state estimator as input. The states x system state is first stored in a system state history database. Then a feature extractor identifies the spatial data correlations (features) of the immediately past sixty system states, and the resulting information, denoted by ft , is stored in a feature history database. Subsequently, the features of the current and previous w − 1 sampling time instances are input to an attack detector, which learns the temporal data correlation and detects FDIA. In this process, w is a user-defined control variable. A large w can lead to more features in the time
domain, rendering a thorough system dynamics. However, the computational efficiency may be compromised. We will study the sensitivity of w in Section IV. In this FDIA detector design, it is evident that the detection performance is dominated by the feature extractor and attack detector. These two blocks need to derive the distinguishing spatial-temporal characteristics of the system state dynamics, and make accurate classifications on attack events against others. In this work, we employ DWT algorithm to extract the attack features due to its outstanding feature extraction capability [33], [34]. In addition, existing neural network units are adopted to construct a DNN to further identify attack patterns from the extracted features. Contributed by recent advances of deep learning technologies, DNN is widely recognized as a superior methodology for classification tasks [35]. Variants of DNN have been employed recently in solving many power system operation problems; see [23], [36] for examples. B. DWT-based Feature Extractor DWT is a digital signal processing technique aiming to extract the hidden time-frequency domain characteristics of any input signals. The technique convolves the input data sequence with wavelets, which are zero-mean functions derived from pre-defined mother wavelets. Typically, a wavelet ψa,b (t) can be developed from its mother wavelet ψ(t) as follows: t−b 1 ), ψa,b (t) = p ψ( a |a|
(9)
where a and b are scaling and shifting parameters, respectively. DWT is performed based on discrete form of (9) by discretizing a = 2j and b = 2j × k, j, k ∈ Z. Then this wavelet can be employed to transform a sequence of input signal s(t) using the following equation: Z +∞ ∗ dj,k (s(t), ψ(t)) = s(t)ψj,k (t)dt, (10) −∞ ∗ ψj,k (t)
where is the complex conjugate of discrete wavelet √ ψj,k (t) = ψ(t/2j − k)/ 2j . However, the analytical solutions to (10) is not always obtainable [33], [37], [38]. To address this problem, a widely adopted method proposed in [33] is employed in this work. The basic concept of the method is utilize the multi-resolution decomposition of s(t) at level M , which is defined by X √ 1 s(t) = aM,k ϕ( M − k)/ 2M 2 k
+
M X X j
dj,k ψ(
k
,AM (t) +
X
√ 1 − k)/ 2j j 2
Dj (t),
(11)
j
where aM,k and ϕ(t) are the approximation coefficient at level M and the companion scaling function, respectively [33]. Using this relation, s(t) can be decomposed into an approximation coefficient AM (t) and M detailed coefficients Dj (t). [33] gives the detailed algorithm for this decomposition.
1551-3203 (c) 2018 IEEE. Personal use is permitted, but republication/redistribution requires IEEE permission. See http://www.ieee.org/publications_standards/publications/rights/index.html for more information.
This article has been accepted for publication in a future issue of this journal, but has not been fully edited. Content may change prior to final publication. Citation information: DOI 10.1109/TII.2018.2825243, IEEE Transactions on Industrial Informatics IEEE TRANSACTIONS ON INDUSTRIAL INFORMATICS
5
TABLE I F EATURE E XTRACTION WAVELETS AND D ECOMPOSITION L EVELS M 4 2
Wavelet sym2 sym8
Filter Length 4 16
M 4 2
Dropout: 30%
Filter Length 4 16
Dropout: 30%
Wavelet db2 db8
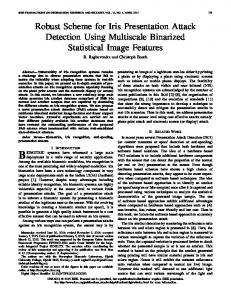
... 128 512 64N
Input
1024
GRU
1024
GRU Fully connected
Fig. 2. Proposed DNN-based attack detector.
From (10) and (11) it can be observed that different wavelets and decomposition levels M can lead to different decomposed signal coefficients. These coefficients will further influence the feature extraction capability of the DWT-based feature extractor. While there should be an optimal setting of wavelets and M values for optimal performance, it is impractical to test all wavelets. As an alternative, they are typically selected strategically according to the data properties [38], [39]. Specifically, when the data contain sufficient sample of signals, db and sym families of wavelets are generally preferred due to their robustness regardless of special data properties [38]. Other wavelets, e.g., bior and coif families, suffer from their longer filter lengths, which can lead to low level of decomposition and bad feature extraction capability [38]. Therefore, in this work, four wavelets from db and sym families are employed to decompose the input signal, i.e., bus voltage magnitudes and phase angles. The wavelets and their respective M values are recorded in Table I. According to (11), in total 16 signal coefficients can be calculated from one input signal. However, the decomposed data sequences are generally too long to be employed in subsequent calculations [34]. In addition, it has been shown that the statistical features of these data sequences can also represent critical features of the input signal [34]. Hence, we adopt the mean and standard deviation values of all coefficients to represent the features of the input signal in the proposed feature extractor. These statistical features have demonstrated their efficacy in the literature for classification tasks, see [34], [38], [39] for examples. Consequently, 16(coefficients)×2(mean and standard deviation)×2N (bus voltage magnitudes and angles)= 64N features are calculated for each system state of an N -bus power system. These features are stored as a representative feature vector of the respective time instance in the feature history database as depicted in Fig. 1. C. DNN-based Attack Detector In the proposed DNN-based attack detector, we adopt existing DNN units to construct a recurrent neural network (RNN) model. This network aims to distinguish attacks from normal power system operating events by learning from the
temporal-spatial system state features extracted by DWT. RNN is a type of neural network which considers both the temporal and spatial dependencies of a sequence of input data. In the constructed network, two types of neuron layers are utilized, namely, gated recurrent unit (GRU) [40] and fully-connected (Dense) layers. Each layer can establish a mathematical relationship between the input and output data. When these layers are chained up, the combined mathematical expression is used to simulate non-linear system models. In this work, we carefully tuned the hyper-parameters of the network, namely, numbers of layers and neurons in each layer, to achieve a satisfactory attack detection accuracy. Fig. 2 presents the schema of the proposed DNN-based attack detector. The constructed RNN model is composed of two GRU layers and two Dense layers. In GRU, given a sequence of input data {ft−w+1 , · · · , ft }, GRU calculates a sequence of output {gt−w+1 , · · · , gt } as follows: gt = zt ⊗ gt−1 + (1 − zt ) ⊗ tanh(wf g ft + wgg (rt ⊗ gt−1 ) + bg ), (12a) zt = sigm(wf z ft + wgz gt−1 + bz ), (12b) rt = sigm(wf r ft + wgr gt−1 + br ), (12c) where ⊗ is the element-wise multiplication operator, and all w and b matrices are the learning parameters of GRU. The Dense layers map the input-output relationship using the following equation: y = actv(wdense ∗ x + bdense ),
(13)
where x and y are the input and output, respectively. wdense and bdense are the learning parameters of Dense layers, and actv is the activation function [41]. After feature extractor processes the current estimated system state, this attack detector first queries the feature history database for the extracted features in the past w sampling time instances. The 64N w features are input into two layers of GRU, each of which has 1024 neurons, to investigate the temporal dependency of these w time instances. The result is fed into two fully-connected layers with 512 and 128 neurons, respectively. Both layers are activated by a sigmoid function. These two layers aim to interpret the temporal dependency generated by GRU into an index indicating whether an FDIA is detected in the studied time span. Finally, the index is considered as the output of the FDIA detector. In this DNN design, hundreds of thousands of learning parameters needs fine-tuning in order to achieve a satisfactory FDIA detection accuracy. However, it has been demonstrated to be impractical to simultaneously optimize so many parameters without considerable overfitting problem, which may lead to poor performance on the accuracy with new data [42]. In the implementation, an effective technique, called “dropout”, is employed to address this issue [42]. This technique randomly sets the output of neurons to zero with a pre-defined probability. The dropped-out neurons thus do not contribute to the calculation. This technique reduces the co-adaptation relationship among neurons, so more robust features can be extracted in the learning process [43]. In the constructed DNN,
1551-3203 (c) 2018 IEEE. Personal use is permitted, but republication/redistribution requires IEEE permission. See http://www.ieee.org/publications_standards/publications/rights/index.html for more information.
This article has been accepted for publication in a future issue of this journal, but has not been fully edited. Content may change prior to final publication. Citation information: DOI 10.1109/TII.2018.2825243, IEEE Transactions on Industrial Informatics IEEE TRANSACTIONS ON INDUSTRIAL INFORMATICS
6
dropout is applied to both of the fully-connected layers at a 30% dropout ratio. D. Offline Training and Online Attack Detection Before using the proposed FDIA detector to identify FDIAs, the optimal values for the network learning parameters, i.e., the values for the w and b matrices/vectors in (12) and (13), need to be firstly optimized. This parameter tuning process is called training, which aims to find the optimal learning parameter set that matches the input and output relationship presented in the training data [44]. The training data can include real attack system dynamics in the operating history. However, due to the relative scarcity of such real data, synthetic simulated power system dynamics subject to FDIA and normal events can be employed to enrich the training dataset for better detection performance. As illustrated in [15] and [32], constructing attack vectors for such systems are notably harder than in DC systems. So the adversaries are quite likely to follow existing patterns for attack, e.g., [15]. In such cases, using synthetic training data generated by these patterns can emulate the real-world attack characteristics, since both attack vectors are computed by algorithms instead of being measured. This data enrichment method is also employed in other FDIA research, e.g., [17]–[19], [23]–[27]. To construct a complete training set, the desired output of the FDIA detector, i.e., yt in Fig. 2, is set according to the following rule: ( 1 FDIA in the past w time instances from t yt = . (14) 0 otherwise {ˆ xt,(i) , yt,(i) }D i=1 ,
Given a collection of D training cases we employ the Adam optimizer [45] to find the optimal values of all learning parameters in the DNN-based attack detector. The binary cross entropy error function is employed as the training objective: minimize −
D X [yt,(i) log yˆt,(i) + (1 − yt,(i) ) log(1 − yˆt,(i) )], i=1
(15) ˆ t,(i) with where yˆt,(i) is the actual FDIA detection result of x the proposed mechanism. For online detection of FDIA, the previously trained learning parameters are utilized to establish the mathematical relationship between power system dynamics and attacks. With estimated power system states, it is trivial to calculate the corresponding yˆt ∈ (0, 1) value. FDIA is detected if this value is greater than 0.5, and vice versa. As will be demonstrated in Section IV, the attack detecting process is fast enough to detect FDIA in an online manner. IV. C ASE S TUDIES In this section, we assess the performance of the proposed AC FDIA detection mechanism on IEEE 118-bus and 300bus power systems. Three sets of analyses are conducted. We first test the general AC FDIA detection accuracy and falsealarm rate of the proposed mechanism, and compare the results
with those in the previous work. Next, we summarize the performance of the proposed mechanism on various groups of attacks with different statistical characteristics. Then we investigate the impact of history window size w and system sampling interval ∆ on the performance. Data volume is critical to the performance of DNN [35]. While too few samples cannot include the characteristics of AC FDIA for learning, too many samples may potentially lead to over-fitting problem. In this work, 200,000 samples are employed to train the proposed DNN. These data are generated by time-domain simulation of power system dynamics, and the attack vectors are developed by the existing attack pattern introduced in Section II-C. In the simulation, we consider both the nominal and randomly selected N − 1 power network topologies3 , and the power network parameters are obtained from [46]. The initial load level is set to be a random value between 80% and 110% of the nominal value. As a result, 200 base operating conditions of each test system are recorded. We generate the power dynamics of normal load changing events and FDIAs based on these conditions. For each operating condition, we first generate 500 random load changing events. In each event, randomly selected loads in the system are changed to new values, ranging from 50% to 150% of their nominal loads. Consequently, the time-domain simulation for the power system dynamics of the 100,000 cases are conducted using DIgSILENT PowerFactory [47]. In addition, we follow the approach in [48], [49] to generate random noise for the dynamics: V˜ ∠θ˜ = V ∠θ + ∆V ∠∆θ, where V ∠θ+∆, ∆V ∠∆θ, and V˜ ∠θ˜ are the simulated voltage phasor, imposed noise phasor, and the resulting voltage phasor in the dataset, respectively. The noise phasor is generated from a truncated complex Gaussian distribution [48]: f (∆V ∠∆θ|0, (10−2 )2 ) = 9|∆V ∠∆θ|2 9 π(1−e−9 )(10−2 )2 |V ∠θ|2 exp(− (10−2 )2 |V ∠θ|2 ) if |∆V ∠∆θ| ≤ 10−2 |∆V ∠∆θ| . 0 otherwise These phasors comply with the PMU accuracy requirement by IEEE Standard for Synchrophasor Data Transfer for Power Systems [50], i.e., the total vector error is no more than 1%. Besides the above 100,000 normal operational cases, we also construct another set of 100,000 FDIA cases with the 200 base operating conditions. For each operating condition, firstly 100 attack cases are constructed with (5) to simulate FDIAs with complete system knowledge. Then 400 other attack cases are constructed using the heuristic summarized in Section II-C, which was developed in [15]. These attack cases are distinguished by their different maximum allowed bus power injections (-50% to +50%), voltage magnitudes (-20% to +20%), angle difference (-15◦ to +15◦ ), and line 3 Most power systems are designed to maintain at least N-1 reliability/stability, and it is quite possible that these systems operate on such topologies, e.g., in maintenance and construction tasks. Therefore, considering N-1 cases is appropriate in order to develop a generalized mechanism for AC FDIA detection.
1551-3203 (c) 2018 IEEE. Personal use is permitted, but republication/redistribution requires IEEE permission. See http://www.ieee.org/publications_standards/publications/rights/index.html for more information.
This article has been accepted for publication in a future issue of this journal, but has not been fully edited. Content may change prior to final publication. Citation information: DOI 10.1109/TII.2018.2825243, IEEE Transactions on Industrial Informatics IEEE TRANSACTIONS ON INDUSTRIAL INFORMATICS
7
Correct Testing False positive cases False negative Correct Training False positive cases False negative Average Detection Time DNN Training Time
118-bus system 45,901 (91.80%) 2291 (4.58%) 1808 (3.62%) 137,943 (91.96%) 6604 (4.40%) 5360 (3.64%) 3.51 ms 2713.2 s
300-bus system 45,422 (90.84%) 2531 (5.06%) 2047 (4.09%) 136,539 (91.02%) 7569 (5.05%) 5892 (3.93%) 7.17 ms 2856.8 s
power flows (up to 1.5 times of the nominal value), whose values are randomly generated according to the record in [15]. Interested readers can refer to this literature for a more detailed introduction on the method to develop valid FDIA attack vectors for AC state estimation. Finally, the attack vector is injected into the power dynamics of the corresponding operating condition to construct an FDIA case. For cross validation, the total 200,000 power dynamics test cases for each test system are randomly divided into a training set and a testing test by 3:1 ratio, which accords with the common practice [36]. The training set is used to train the learning parameters in the DNN, and the testing set is employed to assess the attack detection accuracy. All simulations are conducted on computers with an Intel Core i7-7700 CPU, an nVidia GTX 1080 GPU, and 32GB RAM. The DNN is constructed using TensorFlow for computational speed boost [51]. A. FDIA Detection Performance We first study the general FDIA detection performance of the proposed mechanism. In this test, we set the feature history window size w = 5, and the sampling interval ∆ = 33.3ms to simulate a typical wide-area measurement system. Both test power systems are assessed, and the simulation results are shown in Table II. From the simulation results it can be observed that the proposed mechanism can develop a satisfactory AC FDIA detection accuracy. For both test systems, the detection accuracy is more than 90%, and the mechanism works slightly better on the 118-bus system due to its less complex topology. By comparing the detection results on testing and training cases, it can also be concluded that overfitting is insignificant in the trained DNN. In both test systems, the detection accuracy remains to be more than 90% with new unknown data not used in training. This result demonstrates the satisfactory generalization capability of the proposed mechanism. In addition, we also present the average detection and DNN training times for both test systems. While the former represents the system overhead introduced by the proposed detection method, the latter can describe the complexity of the adopted DNN. From the simulation results it is clear that the overhead is insignificant compared with either the sampling rate (30Hz) or the system frequency (60Hz). While the DNN training time is huge compared with others, this process is typically conducted off-line. For a complete comparison, we also present the simulation results of the other AC FDIA detection mechanism proposed
TABLE III C OMPARISON OF AC FDIA D ETECTION P ERFORMANCE WITH E XISTING AC AND DC FDIA D ETECTION M ETHODS Mechanism Proposed [27, Table I] KLD [27] Kalman Filter [17] Sparse optimization [18]
118-bus system 91.80% 72.05% 70.35% 81.68%
300-bus system 90.84% 65.34% 68.15% 76.51%
Recorded 88.56% -
��� ��
$FFXUDF\���
TABLE II AC FDIA D ETECTION P ERFORMANCE OF THE P ROPOSED M ECHANISM
�� �� �� ��
����EXV�FRPSOH[�SRZHU ����EXV�YROWDJH�PDJQLWXGH ����EXV�YROWDJH�DQJOH 6WURQJ�DWWDFNV
0HGLXP�DWWDFNV
����EXV�FRPSOH[�SRZHU ����EXV�YROWDJH�PDJQLWXGH ����EXV�YROWDJH�DQJOH :HDN�DWWDFNV
Fig. 3. Detection accuracy on FDIAs with different attack strengths.
in [27]. We summarize the data presented in [27, Table I], which is the FDIA detection accuracy on a small-scale IEEE 14-bus system. Since it is unfair to directly compare the results with ours on 118- and 300-bus systems, we also implement the Kullback-Leibler detector (KLD) presented in [27] and test this mechanism on the same systems for reference. The comparison is presented in Table III. From the table it can be observed that the proposed FDIA detection mechanism can remarkably outperform the previous work. The detection accuracy is improved from around 70% by [27] to more than 90%, and the proposed mechanism provides more robust performance when handling normal system operation events. Furthermore, we also employ previously proposed DC FDIA detection mechanisms in the literature to protect the AC test systems for demonstration. Specifically, the methods proposed in [17], [18] are implemented and tested with the same data. The detection accuracy is presented in Table III. It can be observed that DC FDIA detection mechanisms present mediocre fault detection accuracy values at around 70% to 80%. This is due to the fact that AC state estimation is generally more accurate than DC one due to line loss, rendering voltage deviations over transmission lines. This can lead to more difficult FDIA attack construction, but the constructed attack vectors are less perceptible, especially with DC FDIA mechanisms. B. Attacks with Different Statistical Characteristics Besides the previous general accuracy analysis, we are also interested in how the proposed mechanism performs subject to FDIAs with different statistical characteristics. In this subsection, we further summarize the testing performance of the mechanism. We classify all generated FDIAs into
1551-3203 (c) 2018 IEEE. Personal use is permitted, but republication/redistribution requires IEEE permission. See http://www.ieee.org/publications_standards/publications/rights/index.html for more information.
This article has been accepted for publication in a future issue of this journal, but has not been fully edited. Content may change prior to final publication. Citation information: DOI 10.1109/TII.2018.2825243, IEEE Transactions on Industrial Informatics IEEE TRANSACTIONS ON INDUSTRIAL INFORMATICS
8
TABLE IV S ENSITIVITY T EST R ESULTS OF ∆ AND w Value of ∆ Value of w Correct (%) Testing False positive (%) cases False negative (%) Correct (%) Training False positive (%) cases False negative (%) DNN Training time (s)
33.3ms (30Hz Sampling) 2 3 5 7 69.50 81.24 91.80 89.63 15.29 9.11 4.58 5.84 15.21 9.65 3.62 4.53 70.25 81.98 91.96 90.17 15.21 9.28 4.40 5.87 14.54 8.73 3.64 3.96 1463.8 1930.6 2713.2 3871.5
three categories, namely, strong, medium, and weak attacks according to the following rules: • Strong attacks: the average power injection deviation in c exceeds 30% of the nominal value in x, or average voltage magnitude deviation exceeds 10% of the nominal value, or average voltage angle deviation exceeds 5◦ . • Weak attacks: the average deviation of these three system variables are smaller than 10%, 5%, and 2◦ of their nominal values, respectively. • Medium attacks: all other generated FDIAs. These classes can represent the “strength” of attacks in terms of system variable deviations. The detection accuracies of attacks with different statistical characteristics are depicted in Fig. 3. From the figure we can conclude that generally it is easier to detect “stronger” attacks than those with minor system state deviations. This is because a larger sudden change in consecutive system states which does not comply with the nature of system dynamics is a significant indication of FDIA, and the proposed mechanism can successfully capture this feature. Furthermore, it can also be observed that the detection accuracy of the proposed mechanism is greatly influenced by the complex power injection deviation. The influence is not as significant for voltage magnitude deviation, and different angle deviations do not have an obvious impact on the detection performance. This is because normal power system operation events may also introduce frequent complex power injection changes, which increase the false positive detections by the mechanism. Despite the slightly degraded performance on weak attacks, our mechanism can still achieve a satisfactory detection accuracy (greater than 85% in worst case scenarios). C. Impact of History Window Size and Sampling Interval In previous simulations, we assume that the power system states are available at 30Hz. While this configuration emulates the PMU-driven measurement systems, current utilities are still in the process of gradually introducing PMUs on top of the existing SCADA system [52], [53]. Hence it is important to study the performance of the proposed mechanism when it is applied to power system with slower sampling rate, e.g., [52]. In addition, we set the feature history window size to five, and the window size sensitivity and its impact on the offline time needs further investigation. In this section, we study the parameter sensitivities of ∆ and w by testing the proposed mechanism with different parameter values. The value for w is selected from {2, 3, 5, 7},
ON
IEEE 118- BUS S YSTEM
100ms (10Hz Sampling) 2 3 5 7 67.73 77.75 88.74 88.21 16.21 10.93 6.06 5.83 16.06 11.32 5.20 5.97 68.21 78.91 87.77 88.68 16.43 10.98 6.06 5.91 15.36 10.11 6.17 5.41 1507.3 1916.6 2688.3 3960.6
2 63.85 17.86 18.29 64.76 18.33 16.91 1485.7
500ms (2Hz 3 69.45 14.81 15.74 71.28 15.47 13.25 1885.1
Sampling) 5 7 78.77 82.59 10.97 8.91 10.27 8.50 79.50 82.54 11.22 9.17 9.28 8.29 2701.0 3905.1
and three scenarios with different sampling rates are tested. Specifically, ∆ is selected from {33.3, 100, 500} milliseconds, which correspond to 30Hz, 10Hz, and 2Hz system state sampling, respectively. The difference in the sampling rate leads to different numbers of system states in the same period of time, and thus higher sampling rate can better preserve the system dynamics, or input data temporal correlation. We adopt the training and testing data generated for the 118-bus power system, and simulation results are presented in Table IV. From the sensitivity result it can be concluded that in general, five is a good candidate value for parameter w considering the FDIA detection accuracy when the measurements are developed by high-frequency WAMS. For smaller w values, the training process can be significantly shortened due to less computation required in back-propagating gradient deviations in Adam optimizer [45]. However, the less computationally expensive training also leads to inferior detection accuracies regardless of ∆. This is because reducing the feature history window size undermines the completeness of power system dynamics in the time domain, which is a critical factor of the proposed mechanism. On the other hand, while the attack detection accuracy for w = 7 is similar to that of w = 5, the drastically increased training time renders w = 7 less efficient. However, when the sampling interval increases, the more information brought by w = 7 can contribute to detection accuracy improvements, and is therefore more preferred. Comparing the performance with different ∆ values, we can observe that the proposed mechanism can develop more accurate detection results with a higher system variable sampling frequency. The reason for this result is that the system variables sampled at a higher frequency can better represent the system dynamics, which is especially strong in transient and dynamic operations due to the inertia and momentum in the whole system. However, this correlation decays with time due to the mechanical momentum. So shorter time intervals show stronger correlation than longer ones, and the sampled system states at low rates are merely quasi-steadystate approximations of the grid. As previously analyzed, successful detection of FDIA of the proposed mechanism largely depends on the characteristics of system dynamics. Hence it performs better in power systems with high sampling frequencies. Despite this, the proposed mechanism can still provide less than 10% false positive/negative detection with ∆ = 500ms, which is still helpful in identifying FDIAs. Note that with the gradual and steady adoption of PMUs into conventional power grid monitoring systems, it can be
1551-3203 (c) 2018 IEEE. Personal use is permitted, but republication/redistribution requires IEEE permission. See http://www.ieee.org/publications_standards/publications/rights/index.html for more information.
This article has been accepted for publication in a future issue of this journal, but has not been fully edited. Content may change prior to final publication. Citation information: DOI 10.1109/TII.2018.2825243, IEEE Transactions on Industrial Informatics IEEE TRANSACTIONS ON INDUSTRIAL INFORMATICS
expected that system measurements will be provided at a much higher frequency. The proposed mechanism can provide outstanding FDIA detection performance in these systems. V. C ONCLUSIONS In this paper, we propose a new FDIA detection mechanism for AC state estimation. While much research has been conducted for attacks and detections in DC state estimation, little work has focused on the AC counterpart, which is widely adopted by power utilities. As FDIAs can construct compromised system states satisfying Kirchhoff’s circuit laws, conventional residual-based methods have difficulties detecting such attacks. However, current FDIA methods focus on constructing attack vectors satisfying the spatial dependencies of system variables. The temporal dependency of consecutive system states is commonly ignored, which can actually provide more information for system operators to detect FDIAs. The proposed FDIA detector can learn from the system state dynamics in both the space and time domains. Utilizing the extracted time-series features, the detector is capable of distinguishing FDIAs from normal power system operating condition changes. In the proposed mechanism, we employ DWT to efficiently reveal the spatial data characteristics. Then the temporal correlations are captured by a DNN, which then develops the FDIA detection result. To assess the performance of our FDIA detection mechanism, we carry out a series of comprehensive simulations on IEEE 118-bus and 300-bus power systems. In both systems, the proposed detector can achieve outstanding attack detection performance. In addition, our work can outperform the existing FDIA detectors with notable accuracy improvements. Furthermore, we conduct a parameter sensitivity test on two control parameters. The results reveal a trade-off between the training time and detection accuracy, and suggest an appropriate set of these parameters for implementation. Future research of this work can be divided into two parts. On the one hand, the false positive and negative rates of the proposed mechanism may be reduced by improving the structure of DNN and incorporating more advanced DNN techniques. On the other hand, how to apply the proposed mechanism in detecting a wider range of cyber-security attacks is worth investigating. R EFERENCES [1] V. C. Gungor, D. Sahin, T. Kocak et al., “Smart Grid Technologies: Communication Technologies and Standards,” IEEE Transactions on Industrial Informatics, vol. 7, no. 4, pp. 529–539, Nov. 2011. [2] F. F. Wu, “Power system state estimation: A survey,” International Journal of Electrical Power & Energy Systems, vol. 12, no. 2, pp. 80–87, Apr. 1990. [3] Y. Yan, Y. Qian, H. Sharif et al., “A Survey on Smart Grid Communication Infrastructures: Motivations, Requirements and Challenges,” IEEE Communications Surveys Tutorials, vol. 15, no. 1, pp. 5–20, First 2013. [4] C. W. Ten, J. Hong, and C. C. Liu, “Anomaly Detection for Cybersecurity of the Substations,” IEEE Transactions on Smart Grid, vol. 2, no. 4, pp. 865–873, Dec. 2011. [5] S. Sridhar, A. Hahn, and M. Govindarasu, “Cyber-Physical System Security for the Electric Power Grid,” Proceedings of the IEEE, vol. 100, no. 1, pp. 210–224, Jan. 2012.
9
[6] C. W. Ten, G. Manimaran, and C. C. Liu, “Cybersecurity for Critical Infrastructures: Attack and Defense Modeling,” IEEE Transactions on Systems, Man, and Cybernetics A Systems and Humans, vol. 40, no. 4, pp. 853–865, Jul. 2010. [7] G. Liang, J. Zhao, F. Luo et al., “A Review of False Data Injection Attacks Against Modern Power Systems,” IEEE Transactions on Smart Grid, vol. 8, no. 4, pp. 1630–1638, Jul. 2017. [8] R. Deng, G. Xiao, R. Lu et al., “False Data Injection on State Estimation in Power Systems - Attacks, Impacts, and Defense: A Survey,” IEEE Transactions on Industrial Informatics, vol. 13, no. 2, pp. 411–423, Apr. 2017. [9] J. Liang, L. Sankar, and O. Kosut, “Vulnerability Analysis and Consequences of False Data Injection Attack on Power System State Estimation,” IEEE Transactions on Power Systems, vol. 31, no. 5, pp. 3864–3872, Sep. 2016. [10] R. Deng, G. Xiao, and R. Lu, “Defending against false data injection attacks on power system state estimation,” IEEE Transactions on Industrial Informatics, vol. 13, no. 1, pp. 198–207, Feb 2017. [11] Z. H. Yu and W. L. Chin, “Blind False Data Injection Attack Using PCA Approximation Method in Smart Grid,” IEEE Transactions on Smart Grid, vol. 6, no. 3, pp. 1219–1226, May 2015. [12] X. Liu, Z. Bao, D. Lu et al., “Modeling of Local False Data Injection Attacks With Reduced Network Information,” IEEE Transactions on Smart Grid, vol. 6, no. 4, pp. 1686–1696, Jul. 2015. [13] G. Hug and J. A. Giampapa, “Vulnerability Assessment of AC State Estimation With Respect to False Data Injection Cyber-Attacks,” IEEE Transactions on Smart Grid, vol. 3, no. 3, pp. 1362–1370, Sep. 2012. [14] J. Zhao, G. Zhang, Z. Y. Dong et al., “Forecasting-Aided Imperfect False Data Injection Attacks Against Power System Nonlinear State Estimation,” IEEE Transactions on Smart Grid, vol. 7, no. 1, pp. 6– 8, Jan. 2016. [15] X. Liu and Z. Li, “False Data Attacks Against AC State Estimation With Incomplete Network Information,” IEEE Transactions on Smart Grid, in press. [16] S. A. Foroutan and F. R. Salmasi, “Detection of false data injection attacks against state estimation in smart grids based on a mixture gaussian distribution learning method,” IET Cyber-Physical Systems: Theory Applications, vol. 2, no. 4, pp. 161–171, 2017. [17] K. Manandhar, X. Cao, F. Hu et al., “Detection of Faults and Attacks Including False Data Injection Attack in Smart Grid Using Kalman Filter,” IEEE Transactions on Control of Network Systems, vol. 1, no. 4, pp. 370–379, Dec. 2014. [18] L. Liu, M. Esmalifalak, Q. Ding et al., “Detecting False Data Injection Attacks on Power Grid by Sparse Optimization,” IEEE Transactions on Smart Grid, vol. 5, no. 2, pp. 612–621, Mar. 2014. [19] J. Zhao, G. Zhang, M. L. Scala et al., “Short-Term State ForecastingAided Method for Detection of Smart Grid General False Data Injection Attacks,” IEEE Transactions on Smart Grid, vol. 8, no. 4, pp. 1580– 1590, Jul. 2017. [20] R. Xu, R. Wang, Z. Guan et al., “Achieving efficient detection against false data injection attacks in smart grid,” IEEE Access, vol. 5, pp. 13 787–13 798, 2017. [21] Y. Guan and X. Ge, “Distributed attack detection and secure estimation of networked cyber-physical systems against false data injection attacks and jamming attacks,” IEEE Transactions on Signal and Information Processing over Networks, vol. 4, no. 1, pp. 48–59, March 2018. [22] O. Beg, T. Johnson, and A. Davoudi, “Detection of False-data Injection Attacks in Cyber-Physical DC Microgrids,” IEEE Transactions on Industrial Informatics, in press. [23] Y. He, G. J. Mendis, and J. Wei, “Real-time Detection of False Data Injection Attacks in Smart Grid: A Deep Learning-Based Intelligent Mechanism,” IEEE Transactions on Smart Grid, in press. [24] U. Adhikari, T. H. Morris, and S. Pan, “Applying Non-Nested Generalized Exemplars Classification for Cyber-Power Event and Intrusion Detection,” IEEE Transactions on Smart Grid, vol. PP, no. 99, pp. 1–1, 2016. [25] M. Esmalifalak, L. Liu, N. Nguyen et al., “Detecting Stealthy False Data Injection Using Machine Learning in Smart Grid,” IEEE Systems Journal, vol. 11, no. 3, pp. 1644–1652, Sep. 2017. [26] M. Ozay, I. Esnaola, F. T. Y. Vural et al., “Machine Learning Methods for Attack Detection in the Smart Grid,” IEEE Transactions on Neural Networks and Learning Systems, vol. 27, no. 8, pp. 1773–1786, Aug. 2016. [27] G. Chaojun, P. Jirutitijaroen, and M. Motani, “Detecting False Data Injection Attacks in AC State Estimation,” IEEE Transactions on Smart Grid, vol. 6, no. 5, pp. 2476–2483, Sep. 2015.
1551-3203 (c) 2018 IEEE. Personal use is permitted, but republication/redistribution requires IEEE permission. See http://www.ieee.org/publications_standards/publications/rights/index.html for more information.
This article has been accepted for publication in a future issue of this journal, but has not been fully edited. Content may change prior to final publication. Citation information: DOI 10.1109/TII.2018.2825243, IEEE Transactions on Industrial Informatics IEEE TRANSACTIONS ON INDUSTRIAL INFORMATICS
[28] T. Liu, Y. Sun, Y. Liu et al., “Abnormal traffic-indexed state estimation: A cyberphysical fusion approach for smart grid attack detection,” Future Generation Computer Systems, vol. 49, pp. 94 – 103, 2015. [29] J. Tian, R. Tan, X. Guan et al., “Enhanced hidden moving target defense in smart grids,” IEEE Transactions on Smart Grid, vol. PP, no. 99, pp. 1–1, 2018. [30] A. G. Phadke, J. S. Thorp, and K. J. Karimi, “State Estimation with Phasor Measurements,” IEEE Transactions on Power Systems, vol. 1, no. 1, pp. 233–238, Feb. 1986. [31] A. Monticelli, “Electric power system state estimation,” Proceedings of the IEEE, vol. 88, no. 2, pp. 262–282, Feb. 2000. [32] M. A. Rahman and H. Mohsenian-Rad, “False data injection attacks against nonlinear state estimation in smart power grids,” in 2013 IEEE Power Energy Society General Meeting, Jul. 2013, pp. 1–5. [33] S. G. Mallat, “A theory for multiresolution signal decomposition: The wavelet representation,” IEEE Transactions on Pattern Analysis and Machine Intelligence, vol. 11, no. 7, pp. 674–693, Jul. 1989. [34] D. P. Mishra, S. R. Samantaray, and G. Joos, “A Combined Wavelet and Data-Mining Based Intelligent Protection Scheme for Microgrid,” IEEE Transactions on Smart Grid, vol. 7, no. 5, pp. 2295–2304, Sep. 2016. [35] Y. LeCun, Y. Bengio, and G. Hinton, “Deep learning,” Nature, vol. 521, no. 7553, pp. 436–444, May 2015. [36] J. J. Q. Yu, D. J. Hill, A. Y. S. Lam et al., “Intelligent Time-Adaptive Transient Stability Assessment System,” IEEE Transactions on Power Systems, vol. 33, no. 1, pp. 1049–1058, Jan. 2018. [37] E. Magosso, M. Ursino, A. Zaniboni et al., “A wavelet-based energetic approach for the analysis of biomedical signals: Application to the electroencephalogram and electro-oculogram,” Applied Mathematics and Computation, vol. 207, no. 1, pp. 42–62, Jan. 2009. [38] D. Chen, S. Wan, and F. S. Bao, “Epileptic Focus Localization Using Discrete Wavelet Transform Based on Interictal Intracranial EEG,” IEEE Transactions on Neural Systems and Rehabilitation Engineering, vol. 25, no. 5, pp. 413–425, May 2017. [39] J. J. Q. Yu, Y. Hou, A. Y. S. Lam et al., “Intelligent fault detection scheme for microgrids with wavelet-based deep neural networks,” IEEE Transactions on Smart Grid, in press. [40] K. Cho, B. Van Merri¨enboer, C. Gulcehre et al., “Learning Phrase Representations using RNN Encoder–Decoder for Statistical Machine Translation,” in Proceedings of the 2014 Conference on Empirical Methods in Natural Language Processing (EMNLP), Doha, Qatar, Oct. 2014, pp. 1724–1734. [41] R. Reed and R. J. M. II, Neural Smithing: Supervised Learning in Feedforward Artificial Neural Networks. A Bradford Book, Feb. 1999. [42] G. E. Hinton, N. Srivastava, A. Krizhevsky et al., “Improving neural networks by preventing co-adaptation of feature detectors,” arXiv:1207.0580 [cs], Jul. 2012. [43] A. Krizhevsky, I. Sutskever, and G. E. Hinton, “Imagenet classification with deep convolutional neural networks,” in Advances in Neural Information Processing Systems, 2012. [44] R. Lippmann, “An introduction to computing with neural nets,” IEEE ASSP Magazine, vol. 4, no. 2, pp. 4–22, Apr. 1987. [45] D. Kingma and J. Ba, “Adam: A Method for Stochastic Optimization,” in 3rd International Conference for Learning Representations, San Diego, Jul. 2015. [46] A. Semerow, S. H¨ohn, M. Luther et al., “Dynamic Study Model for the interconnected power system of Continental Europe in different simulation tools,” in 2015 IEEE Eindhoven PowerTech, Jun. 2015, pp. 1–6. [47] “PowerFactory - DIgSILENT Germany,” http://www.digsilent.de/index. php/products-powerfactory.html. [48] M. He, V. Vittal, and J. Zhang, “Online dynamic security assessment with missing pmu measurements: A data mining approach,” IEEE Transactions on Power Systems, vol. 28, no. 2, pp. 1969–1977, May 2013. [49] J. J. Q. Yu, A. Y. S. Lam, D. J. Hill et al., “Delay Aware Intelligent Transient Stability Assessment System,” IEEE Access, vol. 5, pp. 17 230–17 239, Aug. 2017. [50] “IEEE Standard for Synchrophasor Data Transfer for Power Systems,” IEEE Std C37.118.2-2011, Dec. 2011. [51] M. Abadi, A. Agarwal, P. Barham et al., “TensorFlow: Large-Scale Machine Learning on Heterogeneous Systems,” Tech. Rep., 2015, software available from tensorflow.org. [52] T. S. Bi, X. H. Qin, and Q. X. Yang, “A novel hybrid state estimator for including synchronized phasor measurements,” Electric Power Systems Research, vol. 78, no. 8, pp. 1343–1352, Aug. 2008.
10
[53] J. J. Yu, A. Y. Lam, D. J. Hill et al., “A unified framework for wide area measurement system planning,” International Journal of Electrical Power & Energy Systems, vol. 96, pp. 43 – 51, 2018.
James J.Q. Yu (S’11–M’15) received the B.Eng. and Ph.D. degree in Electrical and Electronic Engineering from the University of Hong Kong, Pokfulam, Hong Kong, in 2011 and 2015, respectively. He is currently a postdoctoral fellow at the Department of Electrical and Electronic Engineering of the University of Hong Kong. His research interests include smart city technologies, power stability analysis, evolutionary algorithm design and analysis, and deep neural network applications.
Yunhe Hou (M’08–SM’15) received the B.E. and Ph.D. degrees in electrical engineering from Huazhong University of Science and Technology, Wuhan, China, in 1999 and 2005, respectively. He was a Post-Doctoral Research Fellow at Tsinghua University, Beijing, China, from 2005 to 2007, and a Post-Doctoral Researcher at Iowa State University, Ames, IA, USA, and the University College Dublin, Dublin, Ireland, from 2008 to 2009. He was also a Visiting Scientist at the Laboratory for Information and Decision Systems, Massachusetts Institute of Technology, Cambridge, MA, USA, in 2010. Since 2017, he has been a Guest Professor with Huazhong University of Science and Technology, China. He joined the faculty of the University of Hong Kong, Hong Kong, in 2009, where he is currently an Associate Professor with the Department of Electrical and Electronic Engineering. Dr. Hou is an Editor of the IEEE Transactions on Smart Grid and Journal of Modern Power Systems and Clean Energy.
Victor O.K. Li (S’80–M’81–F’92) received SB, SM, EE and ScD degrees in Electrical Engineering and Computer Science from MIT in 1977, 1979, 1980, and 1981, respectively. He is Chair Professor of Information Engineering and Head of the Department of Electrical and Electronic Engineering at the University of Hong Kong (HKU). He has also served as Assoc. Dean of Engineering and Managing Director of Versitech Ltd., the technology transfer and commercial arm of HKU. He served on the Board of China.com Ltd., and is now serving on the board of Sunevision Holdings Ltd., listed on the Hong Kong Stock Exchange. Previously, he was Professor of Electrical Engineering at the University of Southern California (USC), Los Angeles, California, USA, and Director of the USC Communication Sciences Institute. Sought by government, industry, and academic organizations, he has lectured and consulted extensively around the world. He has received numerous awards, including the PRC Ministry of Education Changjiang Chair Professorship at Tsinghua University, the UK Royal Academy of Engineering Senior Visiting Fellowship in Communications, the Croucher Foundation Senior Research Fellowship, and the Order of the Bronze Bauhinia Star, Government of the Hong Kong Special Administrative Region, China. He is a Registered Professional Engineer and a Fellow of the IEEE, the IAE, and the HKIE.
1551-3203 (c) 2018 IEEE. Personal use is permitted, but republication/redistribution requires IEEE permission. See http://www.ieee.org/publications_standards/publications/rights/index.html for more information.