Aug 22, 2001 - in this paper. The Ovaltine tool [2] helps deter- mine relevant overheads for a parallel OpenMP pro- grams compared to a serial implementation.
FORSCHUNGSZENTRUM JÜLICH GmbH Zentralinstitut für Angewandte Mathematik D-52425 Jülich, Tel. (02461) 61-6402
Interner Bericht
Towards a Performance Tool Interface for OpenMP: An Approach Based on Directive Rewriting
Bernd Mohr, Allen D. Malony*, Sameer Shende*, Felix Wolf
FZJ-ZAM-IB-2001-07
August 2001 (letzte Änderung: 22.08.2001)
(*)
Dept. of Computer and Information Science University of Oregon
Preprint: Proceedings EWOMP 2001, Barcelona, September 2001
Towards a Performance Tool Interface for OpenMP: An Approach Based on Directive Rewriting Bernd Mohr+ , Allen D. Malony∗ , Sameer Shende∗ , and Felix Wolf+ ∗
Dept. of Computer and Information Science University of Oregon {malony,sameer}@cs.uoregon.edu
Abstract. In this article we propose a “standard” performance tool interface for OpenMP, similar in spirit to the MPI profiling interface in its intent to define a clear and portable API that makes OpenMP execution events visible to performance libraries. When used together with the MPI profiling interface, it also allows tools to be built for hybrid applications that mix shared and distributed memory programming. We describe an instrumentation approach based on OpenMP directive rewriting that generates calls to the interface and passes context information (e.g., source code locations) in a portable and efficient way. Our proposed OpenMP performance API further allows user functions and arbitrary code regions to be marked and performance measurement to be controlled using new proposed OpenMP directives. The directive transformations we define are implemented in a source-tosource translation tool called Opari. We have used it to integrate the Tau performance analysis framework [13] and the automatic event trace analyzer expert [17, 18] with the proposed OpenMP performance interface. Together, these tools show that a portable and robust solution to performance analysis of OpenMP and hybrid applications is possible.
1
Introduction
With the advent of any proposed language system for expressing parallel operation (whether as a true parallel language (e.g., ZPL [6]), parallel extensions to sequential language (e.g., UPC [4]), or parallel compiler directives (e.g., HPF [9])) questions soon arise regarding how performance instrumentation and measurement will be conducted, and how performance data will be analyzed and mapped to the language-level (high-level) parallel abstractions. Several issues make this an interesting prob-
+
Research Centre J¨ ulich, ZAM J¨ ulich, Germany {b.mohr,f.wolf}@fz-juelich.de
lem. First, the language system implements a model for parallelism whose explicit parallel operation is generally hidden from the programmer. As such, parallel performance events may not be accessible directly, requiring instead support from underlying runtime software to observe them in full. When such support is unavailable, performance must be inferred from model properties. Second, the language system typically transforms the program into its parallel executable form, making it necessary to track code transformations closely so that performance data can be correctly mapped to the userlevel source. The more complex the transformations, the more difficult the performance mapping will be. Last, high-level language expression of parallelism often goes hand-in-hand with an interest for crossplatform portability of the language system. Users will naturally desire the programming and performance tools to be portable as well. For the performance tool developer, these issues complicate decisions regarding choice of tool technology and implementation approach. In this paper, we consider the problem of designing a performance tool interface for OpenMP. Three goals for a performance tool interface for OpenMP are considered: • Expose OpenMP parallel execution to the performance system. Here we are concerned about what execution events and state data are observable for performance measurement through the interface. • Make the interface portable across different platforms and for different performance tools. Portability in this regard requires the definition of the interface semantics and how information is to be accessed. • Allow alternative implementations of the interface. Since OpenMP programs can be compiled in different ways, similar flexibility is important for the performance interface.
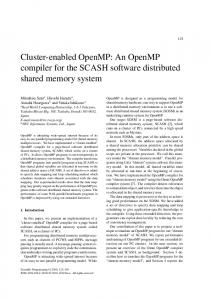
EVENTS master slave
Parallel Region Operation
S
1111master starts serial execution 0000
X
1111parallel region begins 0000
X
STARTUP
1111slaves started 001111111 11 0000000 0000 1111team begins parallel execution 0000000 0000 1111111
X
X X
X X
X X
P
1111team threads hit barrier 001 11 0000000 0000 1111111 0 0000000 1111111 0 1 slaves end; master exits barrier 0 1 0 SHUTDOWN 1 0 1 0 S 1 1111master resumes serial execution 0000 0 1
X
Figure 1: OpenMP Parallel Region Operation Showing States and Events
While our study focuses mainly on the instrumen- refined in focus: tation interface, as that is where events are monitored and the operational state is queried, clearly • Level 1: serial and parallel states (with nestthe type of performance measurement will determine ing) the scope of analyses possible. Ideally, the flexibility • Level 2: work sharing states (per team thread) of the interface will support multiple measurement capabilities. • Level 3: synchronization states (per/across team threads)
2
A Performance Model for OpenMP
• Level 4: runtime system (thread) states In this way, performance observation can be targeted at the level(s) of interest using events specific to the level. Events are defined to identify points of state transitions (begin/end, enter/exit), allowing OpenMP programs to be thought of as multithreaded execution graphs with states as nodes and events as edges. A performance instrumentation interface would allow monitoring of events and access to state information.
OpenMP is a parallel programming language system used to express shared memory parallelism. It is based on the model of (nested) fork-join parallelism and the notion of parallel regions where computational work is shared and spread across multiple threads of execution (a thread team); see Figure 1. The language constructs provide for thread synchronization (explicitly and implicitly) to enforce consisFigure 1 shows a diagram of OpenMP parallel region tency in operation. OpenMP is implemented using operation. Identified are serial (S) and parallel (P) comment-style compiler directives (in Fortran) and states, parallel startup (STARTUP) and shutdown pragmas (in C and C++). (SHUTDOWN) states, and different events at differA performance model for OpenMP can be defined ent levels for master and slave threads. Based on this based on its execution events and states. We ad- diagram, and given a workable performance instruvocate multiple performance views based on a hier- mentation interface, we can develop measurement archy of execution states where each level is more tools for capturing serial and parallel performance.
Before
After
Before
After
!$OMP PARALLEL structured block !$OMP END PARALLEL
call pomp parallel fork(d) !$OMP PARALLEL call pomp parallel begin(d) structured block call pomp barrier enter(d) !$OMP BARRIER call pomp barrier exit(d) call pomp parallel end(d) !$OMP END PARALLEL call pomp parallel join(d)
!$OMP DO do loop !$OMP END DO
call pomp do enter(d) !$OMP DO do loop !$OMP END DO NOWAIT call pomp barrier enter(d) !$OMP BARRIER call pomp barrier exit(d) call pomp do exit(d)
Before
After
Before
After
!$OMP WORKSHARE structured block !$OMP END WORKSHARE
call pomp workshare enter(d) !$OMP WORKSHARE structured block !$OMP END WORKSHARE NOWAIT call pomp barrier enter(d) !$OMP BARRIER call pomp barrier exit(d) call pomp workshare exit(d)
!$OMP SECTIONS !$OMP SECTION structured block !$OMP SECTION structured block !$OMP END SECTIONS
!$OMP BARRIER
call pomp barrier enter(d) !$OMP BARRIER call pomp barrier exit(d)
call pomp sections enter(d) !$OMP SECTIONS !$OMP SECTION call pomp section begin(d) structured block call pomp section end(d) !$OMP SECTION call pomp section begin(d) structured block call pomp section end(d) !$OMP END SECTIONS NOWAIT call pomp barrier enter(d) !$OMP BARRIER call pomp barrier exit(d) call pomp sections exit(d)
Before
After
Before
After
!$OMP CRITICAL structured block !$OMP END CRITICAL
call pomp critical enter(d) !$OMP CRITICAL call pomp critical begin(d) structured block call pomp critical end(d) !$OMP END CRITICAL call pomp critical exit(d)
!$OMP SINGLE structured block !$OMP END SINGLE
call pomp single enter(d) !$OMP SINGLE call pomp single begin(d) structured block call pomp single end(d) !$OMP END SINGLE NOWAIT call pomp barrier enter(d) !$OMP BARRIER call pomp barrier exit(d) call pomp single exit(d)
Before
After
Before
After
!$OMP ATOMIC atomic expression
call pomp atomic enter(d) !$OMP ATOMIC atomic expression call pomp atomic exit(d)
!$OMP MASTER structured block !$OMP END MASTER
!$OMP MASTER call pomp master begin(d) structured block call pomp master end(d) !$OMP END MASTER
Table 1: Proposed OpenMP Directive Transformations.
3
OpenMP Performance Tool Interface
How should a performance interface be developed to meet the goals for OpenMP? Although different interfaces are possible (see [5, 10]), the basic idea behind our proposal is to define an API to a standardized performance monitoring library that can be used to instrument the user’s application program. This instrumentation could be done by a source-to-source translation tool prior to the actual compilation or within an OpenMP compilation sys-
tem. Performance tool developers then only need to implement the functions of this interface to enable their tool to measure and analyze OpenMP programs. Different measurement modes (e.g., profiling [2] and tracing [5, 7, 10]) can easily be accommodated in this way. In the following, we present various aspects of our proposal for a standardized performance tool interface using directive rewriting for its implementation. Fortran90 OpenMP 2.0 syntax is used in examples and tables. Of course, the transformations equally apply to C/C++.
3.1
OpenMP Directive Instrumenta- SECTIONS, and PARALLEL WORKSHARE) can be defined in the same manner. They are basically the tion
We specify the instrumentation of OpenMP directives in terms of directive transformations because, first, this allows a description independent of the base programming language, and second, the specification is tied directly to the programming model the application programmer understands. Our transformation rules insert calls to pomp NAME TYPE(d) in a manner appropriate for each OpenMP directive, where NAME is replaced by the name of the directive, TYPE is either fork, join, enter, exit, begin, or end, and d is a context descriptor (described in Section 3.5). fork and join mark the location where the execution model switches from sequential to parallel and vice versa, enter and exit flag the entering and exiting of OpenMP constructs and finally, begin and end mark the start and end of structured blocks used as bodies for the OpenMP directives. Table 1 gives an overview about our proposed transformations and performance library routines. To improve readability, optional clauses to the directives, as allowed by the OpenMP standards, are not shown.
combination of transformations for the corresponding single OpenMP constructs. The only difference is that clauses specified for the combined construct have to be distributed to the single OpenMP constructs in such a way that it complies with the OpenMP standard (e.g., SCHEDULE, ORDERED, and LASTPRIVATE clauses have to be specified with the inner DO directive). Table 2 shows the proposed transformation for the OpenMP combined parallel work-sharing constructs.
3.2
OpenMP Run-time Library Routine Instrumentation
To monitor OpenMP run-time library routine calls, the transformation process replaces these calls by calls to the performance tool interface library. For example, a call to omp set lock() is transformed into a call to pomp set lock(). In the implementation of the performance tool interface function, the original corresponding OpenMP run-time library routine must be called, and in addition, all necessary data for the performance tool can be collected. Currently, we think it is sufficient to use this procedure for the omp ### lock() and omp ### nest lock() routines, because they are most relevant for the observation of OpenMP performance behavior.
In order to be able to measure the synchronization time at the implicit barrier at the end of DO, SECTIONS, WORKSHARE, or SINGLE directives, we use the following method: If, as shown in the table, the original corresponding END directive does not include a NOWAIT clause, NOWAIT is added and the implicit barrier is made explicit. Of course, if there is a NOWAIT clause in the original END directive, then this step is not necessary. To distinguish these bar- 3.3 Performance Monitoring Library Control riers from (user-specified) explicit barriers, in this case the pomp barrier ###() functions are passed the context descriptor of the enclosing construct (in- In addition to the performance library interface, we propose to add a new directive to OpenMP to give stead of the descriptor of the explicit barrier). the programmer control over when the performance Unfortunately, this method cannot be used for collection is done: measuring the barrier waiting time at the end of !$OMP INST [INIT|FINALIZE|ON|OFF] parallel directives because they do not have a NOWAIT clause. Therefore, we add an explicit bar- For normal OpenMP compilation this directive is igrier with corresponding performance interface calls nored. Otherwise, it is translated into pomp init(), here. For source-to-source translation tools imple- pomp finalize(), pomp on(), and pomp off() calls menting the proposed transformations, this means when performance instrumentation is requested. that actually two barriers get called. But the sec- Another approach (which does not extend the set ond (implicit) barrier should execute and succeed of OpenMP directives) would be to have the proimmediately because the threads of the OpenMP grammer add the performance tool interface calls team are already synchronized by the first barrier. directly, but this then requires either stub routines, Of course, a OpenMP compiler can insert the per- conditional compilation, or the removal of the informance interface calls directly around the implicit strumentation to be used when performance monibarrier, thereby avoiding this overhead. toring is not desired. Our proposed new directive Transformation rules for the combined parallel approach is more portable, effective, and easier to work-sharing constructs (PARALLEL DO, PARALLEL maintain.
Before
After
!$OMP PARALLEL DO clauses ... do loop !$OMP END PARALLEL DO
call pomp parallel fork(d) !$OMP PARALLEL other-clauses ... call pomp parallel begin(d) call pomp do enter(d) !$OMP DO schedule-clauses, ordered-clauses, lastprivate-clauses do loop !$OMP END DO NOWAIT call pomp barrier enter(d) !$OMP BARRIER call pomp barrier exit(d) call pomp do exit(d) call pomp parallel end(d) !$OMP END PARALLEL call pomp parallel join(d)
Before
After
!$OMP PARALLEL SECTIONS clauses ... !$OMP SECTION structured block !$OMP END PARALLEL SECTIONS
call pomp parallel fork(d) !$OMP PARALLEL other-clauses ... call pomp parallel begin(d) call pomp sections enter(d) !$OMP SECTIONS lastprivate-clauses !$OMP SECTION call pomp section begin(d) structured block call pomp section end(d) !$OMP END SECTIONS NOWAIT call pomp barrier enter(d) !$OMP BARRIER call pomp barrier exit(d) call pomp sections exit(d) call pomp parallel end(d) !$OMP END PARALLEL call pomp parallel join(d)
Before
After
!$OMP PARALLEL WORKSHARE clauses ... structured block !$OMP END PARALLEL WORKSHARE
call pomp parallel fork(d) !$OMP PARALLEL clauses ... call pomp parallel begin(d) call pomp workshare enter(d) !$OMP WORKSHARE structured block !$OMP END WORKSHARE NOWAIT call pomp barrier enter(d) !$OMP BARRIER call pomp barrier exit(d) call pomp workshare exit(d) call pomp parallel end(d) !$OMP END PARALLEL call pomp parallel join(d)
Table 2: Proposed OpenMP Combined Parallel Work-sharing Directive Transformations.
3.4
User Code Instrumentation
rective mechanism similar to that described in the last subsection, such as
For large application programs it is usually not suf!$OMP INST BEGIN ( ) ficient to just collect OpenMP related events. The arbitrary user code OpenMP compiler should also insert appropriate !$OMP INST END ( ) pomp begin() and pomp end() calls at the beginning and end of each user function. In this case the The directives are translated into pomp begin() and context descriptor describes the user function. pomp end() calls. Again, techniques can be used to In addition, users may desire to mark arbitrary (non- avoid extending OpenMP, but with the same disfunction) code regions. This can be done with a di- advantages as described in the last section. Fur-
1. Full context information, including source code location, is available to the performance tool interface functions. 2. Run-time overhead for implementing this approach is minimal: just one address is passed as an argument. In addition, providing space for storing performance data (in the form of the data field), the performance tool interface functions do not need to dynamically allocate memory for this purpose (which is very costly). 3. The context data is kept together with the (instrumented) executable so it avoids problems of locating (the right) separate context description file(s) at run-time. 4. Finally, it allows for separate compilation. This is important for today’s large complex application codes.
thermore, the transformation tool / compiler cannot generate the context descriptor for this user defined region, so another (less efficient) mechanism would have to be used here.
3.5
Context Descriptors
An important aspect of the performance instrumentation is how the performance tool interface routines get access to context information, in order to relate the collected performance information back to the source code and OpenMP constructs.
We propose the following: For each instrumented OpenMP construct, user function, and user-specified region, the instrumentor generates a context descriptor in the global static memory segment of the compilation unit which contains the construct or region. 3.6 C/C++ OpenMP Pragma InAll monitoring function calls related to this construmentation struct or region are passed the address of this descriptor (called d in Tables 1 and 2). The proposed definition of the context descriptor (in C syntax) is: The transformations for Fortran OpenMP directives described in Tables 1 and 2 equally apply to C/C++ typedef struct ompregdescr { OpenMP pragmas. The main difference is that the char* name; extent of C/C++ OpenMP pragmas is determined char* sub_name; by the structured block following it, and not by an int num_sections; explicit END pragma as in Fortran. This has the folchar* file_name; lowing consequences for pragma instrumentation: int begin_line1, begin_lineN; int end_line1, end_lineN; WORD data[4]; struct ompregdescr* next; } OMPRegDescr;
The fields of the context descriptor have the following meaning: name contains the name of the OpenMP construct or the string "region" for user functions and regions. sub name stores the name of named critical regions or the name of user functions and regions. In case of the sections OpenMP directives, num sections provides the number of sections, otherwise it is set to 0. The next five fields (file name, begin line1, begin lineN, end line1, end lineN) describe the source code location of the OpenMP construct or user region: the source file name, and the first and last line number of the opening and of the corresponding END OpenMP directive. The field data can be used by the performance tool interface functions to store performance data related to this construct or region (e.g., counters or timers). Finally, the next component allows for chaining context descriptors together at run-time, so that at the end of the program the list of descriptors can be traversed and the collected performance data can be stored away and analyzed. This approach has many advantages over other methods (e.g., using unique identifiers):
• Instrumentation for the “closing” part of the pragma follows the structured block. • Adding a nowait clause (to allow the make implicit barriers explicit) has to be done for the “opening” part of the pragma. • The structured block of a C/C++ OpenMP ### pragma will be transformed by wrapping it with pomp ### begin(d) and pomp ### end(d) calls which in turn are enclosed in a block (i.e., using {...}). All other changes are simple differences in language (e.g., no call keyword and using #pragma omp instead of !$OMP).
4
Prototype Implementation
As a proof of concept and a means for experimentation, we implemented Opari (OpenMP Pragma And Region Instrumentor). It is a source-to-source translator which performs the OpenMP directive and API call transformations as described in this paper, including the proposed !$OMP INST directives. The current prototype implements full Fortran77 and Fortran90 OpenMP 2.0 and full C/C++ OpenMP 1.0 support. The instrumentation of user
functions (based on PDT [12]) is under way. The tool consists of about 2000 lines of C++ code.
4.1
Integration into EXPERT
Being just a source-to-source translator based on a (very) fuzzy parser, and not a full compiler, Opari has the following small limitations:
The expert tool environment [17, 18] is aimed at automatically uncovering performance problems in event traces of MPI, OpenMP, or hybrid applications running on complex, large SMP clusters. The Fortran work on expert is carried out as a part of the kojak • The !$OMP END DO and !$OMP END PARALLEL project [11] and is embedded in the esprit working DO directives are required (not optional, as de- group apart [1]. scribed in the OpenMP standard). • The atomic expression controlled by a !$OMP expert analyzes the performance behavior along ATOMIC directive has to be on a line all by it- three dimensions: performance problem category, dynamic call tree position, and location. Each of self. the analyzed dimensions is organized in a hierarC/C++ chy. Performance problems are organized from more • Structured blocks describing the extent of an general (“There is an MPI related problem”) to very OpenMP pragma need to be either compound specific ones (“Messages sent in wrong order ”). The statements ({...}), or simple statements. In dynamic call tree is a natural hierarchy showing calladdition, for loops are supported only after ing stack relationships. Finally, the location dimension represents the hierarchical hardware and softomp for and omp parallel for pragmas. • Complex statements like if-then-else or do- ware architecture of SMP clusters consisting of the while need to be enclosed in a block ({...}). levels machine, node, process, and thread. We did not find these limitations overly restrictive during our tests and experiments. They rarely apply for well-written code. If they do, the original source code can easily be fixed. Of course, it is possible to remove these limitations by enhancing Opari’s parsing capabilities. Finally, if the performance measurement environment does not support the automatic recording of user functions entries and exits, and therefore cannot automatically instrument the program’s main function, the Opari runtime measurement library has to be initialized by a !$OMP INST INIT directive / pragma prior to any other OpenMP pragma. To integrate performance tools with the proposed OpenMP performance interface, two issues must be addressed. First, the OpenMP program must be instrumented with the appropriate performance calls. We have shown how Opari provides the necessary directive transformations to do this automatically. Second, a performance library must be developed to implement the OpenMP performance API for the particular performance tool. The following describes two performance tools, expert and Tau that have been integrated with the proposed OpenMP performance interface. In each case, both OpenMP applications and hybrid (OpenMP+MPI) applications are supported. The latter demonstrates the ability to combine the OpenMP performance interface with other performance interface mechanisms in a seamless manner.
The range of performance problems known to expert are not hard-coded into the tool but are provided as a collection of performance property specifications. This makes expert extensible and very flexible. A performance property specification consists of • a compound event (i.e., an event pattern describing the nature of the performance problem), • instructions to calculate the so-called severity of the property, determining its influence on the performance of the analyzed application, • its parent performance property, • instructions on how to initialize the property and how to display collected performance data or property related results. Performance property specifications are on a very high level of abstraction that goes beyond simple performance metrics and allows expert to explain performance problems in terms of the underlying programming model(s). Specifications are written in the event trace analysis language earl [16], an extension of the Python scripting language. earl provides efficient access to an event trace at the level of the abstractions of the parallel programming models (e.g., region stack, message queue, or collective operation) making it easy to write performance property specifications. expert’s analysis process relies on event traces as performance data source, because event traces preserve the temporal and spatial relationship among individual events, which are necessary to prove many
interesting performance properties. Event traces are recorded in the newly designed epilog format that, in contrast to traditional trace data formats, is suitable to represent the executions of MPI, OpenMP, or hybrid parallel applications being distributed across one or more (possibly large) clusters of SMP nodes. It supports storage of all necessary source code and call site information, hardware performance counter values, and marking of collectively executed operations for both MPI and OpenMP. The implementation of epilog is thread safe, a necessary feature not always present in most traditional tools.
the node/context/thread levels, this information can be mapped to the particular parallel software and system execution platform under consideration. Tau supports a flexible instrumentation model that allows access to a measurement API at several stages of program compilation and execution. The instrumentation identifies code segments, provides for mapping of low-level execution events to highlevel computation entities, and works with multithreaded and message passing parallel execution models. It interfaces with the Tau measurement model that can capture data for function, method, basic block, and statement execution. Profiling and tracing form the two measurement choices that Tau provides. Performance experiments can be composed from different measurement modules, including ones that access hardware performance monitors. The Tau data analysis and presentation utilities offer text-based and graphical tools to visualize the performance data as well as bridges to thirdparty software, such as Vampir [14] for sophisticated trace analysis and visualization.
Traces can be generated for C, C++, and Fortran applications just by linking to the epilog tracing library. To intercept user function calls and returns, we use the internal profiling interface of the PGI compiler suite [15] being installed on our LINUX SMP cluster testbed. For capturing OpenMP events, we implemented the pomp library functions in terms of epilog tracing calls, and then use Opari to instrument the user application. For example, the omp for enter() and omp for exit() interface implementation for instrumentation of the As with expert, Tau implements the OpenMP #pragma omp parallel for directive for C/C++ performance API in a library that captures the would look like the following in epilog: OpenMP events and uses Tau’s performance measurement facility to record performance data. For void pomp_for_enter(OMPRegDescr* r) { example, the pomp implementation of the same funcstruct ElgRegion* e; tions as in Section 4.1 would look like the following if (! (e = (struct ElgRegion*)(r->data[0]))) in Tau: e = ElgRegion_Init(r); elg_enter(e->rid);
} void pomp_for_exit(OMPRegDescr* r) { elg_omp_collexit(); }
What is important to notice is how the region descriptor is utilized to collect performance data per OpenMP construct. For hybrid applications using OpenMP and MPI, MPI-specific events can also be generated by a appropriate wrapper function library utilizing the MPI standard profiling interface.
4.2
Integration into TAU
The Tau performance system [13] provides robust technology for performance instrumentation, measurement, and analysis for complex parallel systems. It targets a general computation model consisting of shared-memory nodes where contexts reside, each providing a virtual address space shared by multiple threads of execution. The model is general enough to apply to many high-performance scalable parallel systems and programming paradigms. Because Tau enables performance information to be captured at
TAU_GLOBAL_TIMER(tfor,‘‘for enter/exit’’, ‘‘[OpenMP]’’,OpenMP); void pomp_for_enter(OMPRegDescr* r) { #ifdef TAU_AGGREGATE_OPENMP_TIMINGS TAU_GLOBAL_TIMER_START(tfor); #endif #ifdef TAU_OPENMP_REGION_VIEW TauStartOpenMPRegionTimer(r); #endif } void pomp_for_exit(OMPRegDescr* r) { #ifdef TAU_AGGREGATE_OPENMP_TIMINGS TAU_GLOBAL_TIMER_STOP(); #endif #ifdef TAU_OPENMP_REGION_VIEW TauStopOpenMPRegionTimer(r); #endif }
Tau supports construct-based as well as regionbased performance measurement. Construct-based measurement uses globally accessible timers to aggregate construct-specific performance cost over all regions. In the case of region-based measurement, like expert, the region descriptor is used to select the specific performance data for that context. Fol-
lowing this instrumentation approach, all of Tau’s functionality is accessible to the user, including the ability to select profiling or tracing, enable hardware performance monitoring, and add MPI instrumentation for performance measurement of hybrid applications.
5
Related Work
Given the interest in OpenMP in the last few years, several research efforts have addressed performance measurement and analysis of OpenMP execution, but none of these efforts have considered a common performance tool interface in the manner proposed in this paper. The Ovaltine tool [2] helps determine relevant overheads for a parallel OpenMP programs compared to a serial implementation. It uses the Polaris Fortran 77 parser to build a basic abstract syntax tree which it then instruments with counters and timers to determine overheads for various OpenMP constructs and code segments. The nature of the Ovaltine performance measurements suggests that our OpenMP performance API could be applied directly to generate the OpenMP events of interest, allowing greater range to performance tools for use in overhead analysis.
OpenMP instrumentation is provided by the Guide compiler for both profiling and tracing, and the Guide runtime system handles recording of thread events. Being compiler-based, the monitoring of OpenMP performance can be quite detailed and tightly integrated in the execution environment. However, the lack of an external API seriously prevents other performance tools for observing OpenMP execution events. The performance interface we proposed could be applied in the VGV context in the same manner as above. The pomp calls could be implemented in a library for VGV, mapping the OpenMP actions to Vampir state transition calls at appropriate points. Another approach might be to have the Guide compiler generate the pomp instrumentation, allowing other pomp-compatible performance interface libraries to be used.
Lastly, the JOMP [3] system is a source-to-source compiler that transforms OpenMP-like directives for Java to multi-thread Java statements that implement the equivalent OpenMP parallel operations. It has similarities to our work in that it supports performance instrumentation as part of its directive transformation [8]. This instrumentation generates events for analysis by Paraver [7]. In a similar manner, the JOMP compiler could be modified to generate pomp calls. In this case, since JOMP manages its own threads to implement parallelism, it may be OMPtrace [5] is a dynamic instrumentation pack- necessary to implement runtime support for pomp age used to trace OpenMP execution on SGI and libraries to access thread information. IBM platforms. It provides for automatic capture of OpenMP runtime system (RTS) events by intercepting calls to the RTS library. User functions Conclusion and Future Work can also be instrumented to generate trace events. 6 The main advantage of OMPtrace is that there is no need to re-compile the OpenMP program for This paper proposes a portable performance interperformance analysis. In essence, OMPtrace uses face for OpenMP to aid in the integration of perthe RTS interface as the performance tool inter- formance tools in OpenMP programming environface, relying on interception at dynamic link time for ments. Defined as a library API, the interface exinstrumentation. Unfortunately, this approach re- poses OpenMP execution events of interest (e.g., selies on OpenMP compiler transformations that turn quential, parallel, and synchronization events) for OpenMP constructs into function calls, and on dy- performance observation, and passes OpenMP connamic shared library operation. To bypass these text descriptors to inform the performance interrestrictions, the OpenMP performance interface we face library of region-specific information. Because propose could provide a suitable target for the per- OpenMP uses compiler directives (pragmas) to exformance tracing part of OMPtrace. A compatible press shared memory parallelism, our definition of pomp library would need to be developed to generate the performance tool API must be consistent with equivalent OMPtrace events and hardware counter the operational semantics of the directives. To show data. In this manner, the Paraver [7] tool for anal- how this is accomplished, we describe how the API ysis and visualization of OMPtrace data could be is used in rewriting OpenMP directives in funcused without modification. tionally equivalent, but source-instrumented forms. The Opari tool can perform this OpenMP directive The VGV tool combines the OpenMP compiler rewriting automatically, inserting pomp performance tools (Guide, GuideView) from KAI with the calls where appropriate. Vampir/Vampirtrace tracing tools from Pallas for OpenMP performance analysis and visualization. The benefits of the proposed performance interface
are several. First, it gives a performance API tar- [6] B. Chamberlain et al., “The Case for High Level get for source-to-source instrumentation tools (e.g., Parallel Programming in ZPL,” IEEE CompuOpari), allowing for instrumented OpenMP codes tational Science and Engineering, 5(3):76-86, that are portable across compilers and machine plat1998. forms. Second, the performance library interface [7] European Center for Parallelism of provides a target for tool developers to port perforBarcelona (CEPBA), Paraver – Paralmance measurement systems. This enables multiple lel Program Visualization and Analysis performance tools to be used in OpenMP perforTool – Reference Manual, November, 2000. mance analysis. We show how expert and Tau are http://www.cepba.upc.es/paraver. integrated by redefining the pomp calls. Third, the API also offers a target for OpenMP compilers to [8] J. Guitart et al., “Performance Analysis Tools for Parallel Java Applications on Sharedgenerate pomp calls that can both access internal, memory Systems,” Int’l. Conf. on Parallel Procompiler-specific performance libraries and external cessing (ICPP’01), September, 2001. performance packages. Finally, if the OpenMP community could adopt an OpenMP performance in- [9] HPF. http://softlib.rice.edu/HPFF/. terface such as the one we proposed, it would significantly improve the integration and compatibil- [10] J. Hoeflinger et al., “An Integrated Performance Visualizer for MPI/OpenMP Proity between compilers and performance tools, and, grams,” Workshop on OpenMP Applications perhaps more importantly, the portability of perforand Tools (WOMPAT 2001), July, 2001. mance analysis techniques. In the future, we hope to work with the OpenMP [11] KOJAK (Kit for Objective Judgment and Knowledge-based Detection of Bottlenecks). standards organization to promote the definition http://www.fz-juelich.de/zam/kojak/. for a performance tool API, offering our proposal here for consideration. We will enhance the [12] K.A. Lindlan, J. Cuny, A.D. Malony, S. Opari source-to-source instrumentation approach Shende, B. Mohr, R. Rivenburgh, C. Raswith support for user function instrumentation using mussen, “Tool Framework for Static and DyPDT [12]. Other opportunities are also possible with namic Analysis of Object-Oriented Software the integration of the API in OpenMP compilers and with Templates,” Proc. Supercomputing 2000, the use of other performance technologies for instruDallas/Texas, USA, November, 2000. mentation and measurement. We hope to work with [13] A. Malony, S. Shende, “Performance TechnolKAI and Pallas to investigate the use of our proogy for Complex Parallel and Distributed Sysposed performance tool interface in the KAP/Pro tems,” Proc. 3rd Workshop on Distributed and Guide compiler with Vampirtrace as the basis for Parallel Systems, DAPSYS 2000, (Eds. G. Kotthe pomp performance library implementation. sis, P. Kacsuk), pp. 37–46, 2000.
References
[14] Pallas GmbH, “VAMPIR: Visualization and Analysis of MPI Resources”. http://www.pallas.de/pages/vampir.htm.
[1] ESPRIT Working Group APART (Automatic [15] Portland Group Inc. Private Communication. Performance Analysis: Resources and Tools). [16] F. Wolf, B. Mohr, “EARL - A Programmable http://www.fz-juelich.de/apart/. and Extensible Toolkit for Analyzing Event [2] M. Bane and G. Riley, “Overheads Profiler Traces of Message Passing Programs,” Proc. of for OpenMP Codes,” European Workshop on the 7th Int’l. Conf. on High-Performance ComOpenMP (EWOMP 2000), September, 2000. puting and Networking, HPCN’99, A. Hoek[3] J. Bull et al., “Towards OpenMP for Java,” stra and B. Hertzberger, eds., Amsterdam (The European Workshop on OpenMP (EWOMP Netherlands), 1999, pp. 503–512. 2000), September, 2000. [17] F. Wolf, B. Mohr, “Automatic Performance [4] W. Carlson et al. “Introduction to UPC Analysis of MPI Applications Based on Event and Language Specification,” Technical ReTraces,” Proc. of the European Conf. on Parport CCS-TR-99-157, George Mason Univerallel Computing, Euro-Par 2000, Munich (Gersity, May, 1999. many), August 2000, pp. 123–132. [5] J. Caubet et al., “A Dynamic Tracing Mech- [18] F. Wolf, B. Mohr, “Automatic Performance anism for Performance Analysis of OpenMP Analysis of SMP Cluster Applications,” Tech. Applications,” Workshop on OpenMP ApplicaRep. IB 2001-05, Research Centre J¨ ulich, 2001. tions and Tools (WOMPAT 2001), July, 2001.