Towards a Standard Performance Tool Interface for Global Address Space Languages Adam Leko1, Dan Bonachea2, Hung-Hsun Su1, Hans Sherburne1, Bryan Golden1, and Alan D. George1 1
Department of Computer and Electrical Engineering University of Florida {leko,su,sherburne,golden,george}@hcs.ufl.edu 2 Department of Computer Science University of California at Berkeley
[email protected]
Abstract. Due to the wide range of compilers and the lack of a standardized performance tool interface, writers of performance tools face many challenges when incorporating support for global address space languages such as Unified Parallel C (UPC), Titanium, and Co-Array Fortran (CAF). This extended abstract summarizes our Global Address Space Performance tool interface (GASP), which is flexible enough to be adapted into current global address space compiler and runtime infrastructures with minimal effort while allowing tools to gather much information about the performance of global address space programs.
1 Introduction Global address space (GAS) languages such as Titanium [1], Unified Parallel C (UPC) [2], and Co-Array Fortran (CAF) [3] offer parallel programmers several advantages over languages that require programmers to manually specify communication between nodes. The global address space provides a convenient environment similar to threaded programming on shared-memory machines, but comes at the cost of increased complexity in GAS compiler and runtime systems. This approach gives parallel programmers a much-needed increase in productivity; however GAS compilers handle low-level communication and performance is often sensitive to data locality. The difficulty of performance analysis for GAS programs has been aggravated by the lack of performance analysis tools supporting GAS languages. The relative youth of GAS languages compared with other programming models such as MPI is partly responsible for the lack of tool support, but tool developers face a major roadblock even if they wish to add GAS support in their tools: there is no standard performance tool interface that can be used to portably gather performance information from GAS programs at runtime. The extensive and almost exclusive use of the MPI profiling
interface [4] by MPI performance tools illustrates the utility of a common performance tool interface. One alternative to a standard tool interface would be to have each tool rely upon its own instrumentation method. For instance, one tool developer could create a source instrumentation system to support UPC, while others could use DynInst [5] or other binary patching tools to insert instrumentation code directly in Titanium executables. This approach has several drawbacks, however. First of all, it results in a large amount of duplicated effort, since the absence of a standard interface would result in each tool developer independently creating their instrumentation systems from the ground up. Second, creating and testing instrumentation systems is not a trivial task, especially when multiple platforms have to be supported. Finally, because of the extra levels of abstractions that GAS languages offer to users, it may not be possible to gain complete information about a program’s performance by simply inserting instrumentation code at the source or binary levels. Software caching systems, for instance, add a dynamic aspect to a program’s performance, and tools that rely upon traditional instrumentation alone will not have access to detailed information such as the cache miss or hit ratios for particular memory regions. To rectify this situation, we developed GASP (Global Address Space Performance tool interface), a performance tool interface for GAS languages. In a nutshell, we are trying to help programmers answer the question “How can I make my GAS program run faster?” by providing tool developers with a consistent interface so that their performance tools can help users identify and fix performance bottlenecks.
2
Overview of GASP
The GASP interface defines a standard method of interaction between a user’s code, a performance tool, and a GAS compiler and/or runtime system. This interaction is event-based and comes in the form of “callbacks” to a standard function provided by tool writers. The callbacks may come from instrumentation code placed directly in an executable, from an instrumented runtime library, or any other method. This simple callback scheme affords developers of GAS systems much flexibility in how instrumentation may be performed on user programs, which is critical because GAS systems may differ wildly in their implementation, even when compared to other GAS systems supporting the same language. Events which may generate callbacks include global address space put/get communication operations, various language-appropriate synchronization operations, calls to standard language libraries (allocation, bulk data movement, collectives, etc), entry and exit of user-defined functions, and even programmatically-defined applicationspecific events. Applications are permitted to lexically or dynamically select specific program regions to be instrumented, and specific tools may direct the compiler’s instrumentation process to reduce overhead for irrelevant callbacks. Space restrictions do not allow us to give an in-depth discussion of the form and semantics of each callback here, but these details can be found in [6].
25.00%
LU CG FT IS
20.00%
15.00%
10.00%
5.00%
0.00% simpleprof
simpleprof-local
simpleprof-func
simpleprof-func-local
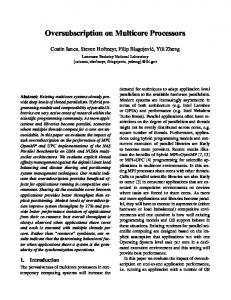
Fig. 1. GASP overhead introduced by the simpleprof tool
It is worth mentioning that we have attempted to minimize the amount of work end users need to perform to analyze their programs using GASP-enabled tools. In particular, we strongly advocate the use of compiler “wrapper scripts” that oversee the tedious details of instrumenting user code and linking against appropriate performance tool libraries. We hope that our user-centric view will help reverse the long-standing trend of users shunning parallel tools in favor of simpler, less scalable methods [7].
3
Experimental Results
To test the feasibility of our GASP interface, we have added experimental support for GASP in Berkeley UPC [8]. The instrumentation code was added to the UPC runtime in just a few weeks, illustrating the low implementation overhead of the interface. We have also created a toy performance tool named “simpleprof” that records the sum of time spent for each line of UPC code that causes shared memory accesses. Weighing in at only 300 lines of C and UPC code, this tool is very simple but very effective at finding time-consuming UPC shared memory accesses. To obtain a measure of the overhead associated with the profiling interface, we tested simpleprof with the UPC versions of the NPB 2.4 benchmarks (CG, FT, and IS) and the UPC version of the Splash-2 LU benchmark on an eight-node dual-Opteron cluster connected via InfiniBand using the Berkeley UPC vapi conduit. These overheads are shown in Figure 1. In Figure 1, the “-local” and “-func” labels indicate if local shared memory accesses and function entry/exit events were instrumented (respectively) by the Berkeley compiler. GASP allows users to specify whether they want these entities to be instru-
mented during compile time, as with some programs (such as programs that call small functions repeatedly) adding instrumentation code for these types of events can have a significant impact on execution time. As is shown by the figure, when combined with an efficient tool our experimental GASP implementation has minimal overhead. This trend is encouraging, especially given the fine-grained nature of these UPC programs.
4
Conclusions
From our experimental implementation, we have shown that our GASP interface represents a feasible method for providing performance tools with a standard method of interacting with GAS systems. We hope that the GASP interface becomes widely supported by GAS systems and widely adopted by performance tools, as the interface itself significantly decreases the barriers to entry associated with supporting GAS languages in a performance tool.
References 1. K. Yelick, L. Semenzato, G. Pike, C. Miyamoto, B. Liblit, A. Krishnamurthy, P. Hilfinger, S. Graham, D. Gay, P. Colella, and A. Aiken, “Titanium: A High-Performance Java Dialect,” Workshop on Java for High-Performance Network Computing, Las Vegas, Nevada, June 1998. 2. UPC Consortium, “UPC Language Specifications, v1.2,” Lawrence Berkeley National Lab Tech. rep. LBNL-59208, 2005. 3. B. Numrich and J. Reid, “Co-Array Fortran for Parallel Programming,” ACM Fortran Forum, 17(2), pp. 1–31, 1998. 4. MPI Forum, “MPI: A message-passing interface standard,” Chapter 8, Tech. rep., University of Tennessee, Knoxville, TN, 1994. 5. B. Buck and J. K. Hollingsworth, “An API for Runtime Code Patching,” The International Journal of High Performance Computing Applications, 14(4), pp. 317–329, Winter 2000. 6. A. Leko, D. Bonachea, H. Su, B. Golden, H. Sherburne, and A. George, “GASP: A Performance Tool Interface for Global Address Space Languages, v1.4,” HCS Lab Whitepaper, November 2005. 7. C. Cook, C. Pancake, “What Users Need in Parallel Tool Support,” in Proceedings of the Scalable High Performance Computing Conference, pp. 40–47, Starkville, Mississippi, 1994. 8. W. Chen, D. Bonachea, J. Duell, P. Husbands, C. Iancu, and K. Yelick, “A Performance Analysis of the Berkeley UPC Compiler,” 17th Annual International Conference on Supercomputing, San Francisco, CA, June 2003.