May 21, 2006 - tration testing, add-on security software and penetrate-and- patch maintenance. ... graphs, which encode information about security activities.
Towards a Structured Unified Process for Software Security Shanai Ardi, David Byers, Nahid Shahmehri Department of computer and information science Linkopings ¨ universitet SE-58183 Linkoping, ¨ Sweden {shaar,davby,nahsh}@ida.liu.se
ABSTRACT
the total cost of the Code Red worm has been estimated at $2.6 billion, and the Nachi worm affected operations at Air Canada and CSX railroad. Both exploited buffer overflow vulnerabilities, a class of vulnerabilities that has been known since at least 1988. Efforts are being made to reduce vulnerabilities in software, but the industry clearly has a long way to go. Security flaws can be prevented in many ways, but our interest lies in processes for developing secure software. Most current approaches to this are essentially ad hoc application of best practices or “secure programming techniques”. Since they are usually based on experience, they do indeed help prevent flaws, but it is difficult to say with any certainty what vulnerabilities are prevented and to what extent, or to say whether there are alternative ways of achieving the same effects. More importantly, perhaps, their ad hoc nature makes evolving the process to meet new threats, or adapting it to specific situations something of a hit-and-miss affair. Our work has two primary goals: defining validated software development process components that enhance security throughout the software lifecycle (and a method to create such components), and developing a process improvement methodology that allows these components to evolve as new threats and vulnerabilities are discovered. The process components will take the form of configurable phase-based “process plugins” that address software security in various phases of the software lifecycle. We aim to be process agnostic in order to reduce the effort involved in applying our results and to make our results applicable in a wide range of situations. We are particularly concerned that our results be applicable in agile processes such as extreme programming [1, 2] or feature-driven development [13] as well as in more conventional development processes [6, 10]. We intend to validate our results through empirical studies. Our approach to defining process components is based on a thorough analysis of vulnerabilities and their causes, similar to root cause analysis. The results are represented as a graph, which we call vulnerability cause graph (VCG). Each cause is then analyzed individually to determine how it can be mitigated. The structure of the VCG and the analysis of each individual cause are used to derive a second structure, called a security activity graph (SAG), that is used to determine which activities need to be present in the development process in order to prevent specific vulnerabilities. VCGs and SAGs provide the basis for improving software development practices in a structured manner, allowing us
Security is often an afterthought when developing software, and is often bolted on late in development or even during deployment or maintenance, through activities such as penetration testing, add-on security software and penetrate-andpatch maintenance. We believe that security needs to be built in to the software from the beginning, and that security activities need to take place throughout the software lifecycle. Accomplishing this effectively and efficiently requires structured approach combining a detailed understanding on what causes vulnerabilities, and how specific activities combine to prevent them. In this paper we introduce key elements of the approach we are taking: vulnerability cause graphs, which encode information about vulnerability causes, and security activity graphs, which encode information about security activities. We discuss how these can be applied to design software development processes (or changes to processes) that eliminate software vulnerabilities.
Categories and Subject Descriptors D.2.0 [Software Engineering]: General
General Terms Security
Keywords Software security, software development process, vulnerability analysis
1.
INTRODUCTION
Vulnerabilities – security-related flaws – in software affect us almost daily, have forced us to change how we use computers and are at the center of some of the most spectacular and costly computer failures in recent years. For example,
Permission to make digital or hard copies of all or part of this work for personal or classroom use is granted without fee provided that copies are not made or distributed for profit or commercial advantage and that copies bear this notice and the full citation on the first page. To copy otherwise, to republish, to post on servers or to redistribute to lists, requires prior specific permission and/or a fee. SESS’06, May 20–21, 2006, Shanghai, China. Copyright 2006 ACM 1-59593-085-X/06/0005 ...$5.00.
3
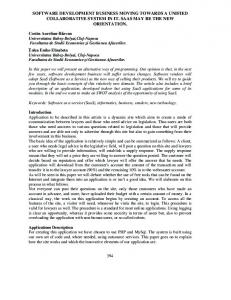
nerabilities and that eliminating Cause B will eliminate Vulnerability B, while eliminating Vulnerability A will require eliminating either Root cause or both Cause A and Cause B (all assuming that the graph is a complete characterization of the vulnerabilities).
to quantify the effect that activities in software development have on preventing vulnerabilities. VCGs allow us to focus on vulnerabilities and their causes, and in some cases leverage experience with root cause analysis. They give us a better understanding of vulnerabilities and how they are related to each other through e.g. common causes. SAGs, which are generated from VCGs using a formal process, focuses on development activities and allows us to reason about tradeoffs between different activities. We envision a workflow developing process components that iterates over the following six steps. The workflow would be carried out by e.g. a security expert or software process engineer. This paper covers steps one (partially), two, and three, and discusses the remaining steps to some extent. Create VCG
Enumerate mitigation techniques
Generate SAG
Simplify SAG
Select activities
Root cause
Cause B
Vulnerability A
Vulnerability B
Figure 1: First-generation vulnerability cause graph
Define process component
Vulnerability cause graphs are the first step towards constructing security activity graphs, which are in turn used to guide activities in the development process. Systematic construction of VCGs is the topic of a forthcoming paper. We are currently developing the concept of VCGs and are exploring the first generation of our model. This model is deliberately simple: unnecessary generality would simply make it difficult to apply in practice. Some limitations that may need to be addressed in the future are discussed in section 7.
The major contributions of this paper are vulnerability cause graphs, security activity graphs, associated algorithms and proposed applications. Initially, we will focus on vulnerabilities in C programs. The C programming language has been extremely popular and has a number of properties that are problematic from a security point of view (e.g. no range or bounds checking, NULL-terminated strings, and many C library conventions) [3, 7, 17].
2.
Cause A
3. SECURITY ACTIVITY GRAPHS
VULNERABILITY CAUSE GRAPHS
A security activity graph (SAG) relates activities during software development to preventing potential vulnerabilities in the final product. Every vulnerability has a corresponding SAG. SAGs are very loosely based on ideas from fault tree analysis [9]. Security activity graphs are essentially graphical representations of terms in first order predicate calculus, but graphs are easier to communicate and can easily be annotated with metadata. For this reason, we prefer to use the graphical representation whenever convenient. The fundamental type of vertex in a SAG is an activity. Such vertices represent software development activities that may impact security, and take on boolean values. An activity is true if the activity is implemented perfectly during software development and false otherwise. In addition to activities, there are gates which are simply functions of their inputs (which in turn are outputs from activities or other gates). The most important graph elements are listed in table 1 (a few others have been proposed, but are not used in this paper). Every activity vertex is classified as part of a particular software development phase: requirements, design, implementation or testing, so that mitigation techniques based on the activities can be included in the appropriate development phase.
Vulnerability cause graphs (VCGs) relate causes to vulnerabilities in the final software product. Each vertex in a graph represents a cause or a vulnerability, and each directed edge represents a relationship between two causes or between a cause and a vulnerability. A vulnerability cause graph is a directed acyclic graph in which vertices represent vulnerabilities and their causes. Vertices with no successors are known as vulnerabilities, and represent classes of potential vulnerabilities in software being developed (analysis may start with specific instances of known vulnerabilities, but ultimately the goal is to prevent whole classes of vulnerabilities). Examples could include “integer overflow” or “race condition”. Vertices with successors are known as causes, and represent conditions or events that may lead to vulnerabilities being present in the software being developed. Examples include “use of unsafe API” or “data file can contain executable code”. A vertex N is said to be blocked if the conditions or events it represents are mitigated through actions during software development or if its immediate predecessors in the VCG are blocked. To prevent a vulnerability V from being present in software being developed, the vertex representing that vulnerability must be blocked. Intuitively, vertices in the VCG with no predecessors represent root causes of vulnerabilities, and traversing the graph from the root causes indicates progressively lower-level causes of vulnerabilities. Mitigating all the predecessors of a cause C in the graph either prevents that cause from occurring or makes it irrelevant. Figure 1 shows an example of a small VCG. Here we can see that Vulnerability A is caused by either Cause A or Cause B, and that those in turn are caused by Root cause. This implies that eliminating Root cause will eliminate both vul-
3.1 Constructing Security Activity Graphs Security activity graphs are constructed from vulnerability cause graphs in a structured manner. First, mitigation techniques for each cause are enumerated. Some mitigation techniques may be repeated in several different vulnerabilities. Second, SAG fragments are created for each set of mitigation techniques. Finally, these are combined to create the SAG.
4
Graphical representation F × I1
Function
Logic equivalent
Use of strcat +
And gate
I2 . . . In
×
F = I1 ∧ I2 ∧ · · · ∧ In
A A B C D E F G H
F + I1
Or gate
F = I1 ∨ I2 ∨ · · · ∨ In
Split gate
F1 = I, F2 = I, . . . , Fn = I
I2 . . . In
F1 F2 . . . Fn S
Use Use Use Use Use Use Use Use
× B
C
D
F
G
H
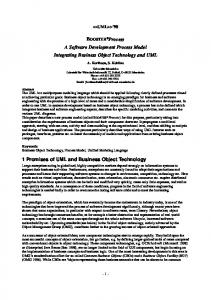
Figure 2: Security activity graph fragment Use of strcat
F
Name
E
×
preprocessor to prevent calls to strcat strlcat instead of strcat preprocessor to prevent calls to strcat safe string library code inspection to find calls to strcat strlcat instead of strcat code inspection to find calls to strcat safe string library
I
C
×
× Activity
+
F =C A
Vulnerability
A B C D
N/A
I
Use Use Use Use
+ B
C
D
preprocessor to prevent calls to strcat code inspection to find calls to strcat strlcat instead of strcat safe string library
Figure 3: Simplified security activity graph fragment
Table 1: Security activity graph elements
Enumeration of mitigation techniques
Combining graph fragments
We assume that every cause in the VCG can be mitigated through application of one or more mitigation techniques (this assumption is somewhat unrealistic, and will be relaxed in the future). Mitigation techniques are expressed as combinations of concrete primitive actions. For example, if a cause is “Use of strcat”, it might be mitigated by “Use strlcat instead of strcat” together with “Use preprocessor to prevent calls to strcat”. It might also be mitigated with “Use safe string library” together with “Use preprocessor to prevent calls to strcat”; or with “Use code inspection to detect calls to strcat” together with “Use strlcat instead of strcat”. Other possibilities also suggest themselves. These are then re-expressed as first order predicate logic formulas using the concrete primitive actions as predicates. For example, “Use of strcat” could be mitigated by (Use preprocessor to prevent calls to strcat∧ Use strlcat instead of strcat)∨ (Use preprocessor to prevent calls to strcat∧ Use safe string library)∨ (Use code inspection to find calls to strcat∧ Use strlcat instead of strcat)∨ (Use code inspection to find calls to strcat∧ Use safe string library) This can be expressed as a SAG fragment, shown graphically in figure 2. Naturally, the expression (and hence graph) may be simplified using rules of first order predicate logic. An alternate, logically equivalent, version is shown in figure 3.
Once fragments have been created for all vulnerabilities in the VCG, they are connected to each other to form SAGs for each vulnerability in the VCG, using a recursive procedure, based on the definition of the VCG. The following helper functions are used in the listing below: mitigations returns the mitigations (SAG fragment) for a given vertex (if there are none, it returns a vertex containing False, indicating that the cause cannot be mitigated); predecessors returns the predecessors of a given vertex in a given graph; first returns the first element of a list; and rest returns all but the first element of a list. The construction algorithm is as follows: def sag(n,g): if | predecessors(n,g)| = 0: return mitigations(n) else return mitigations(n) ∨ sag2(predecessors(n,g),g) def sag2(ns, g ): if |ns| = 1: return sag(first (ns),g) else return sag(first (ns),g) ∧ sag2(rest (ns), g) The VCG is traversed bottom-up from a vulnerability. For any vertex, the graph is constructed by joining the mitigations of the vertex to the conjunction of SAGs constructed at
5
causes have the greatest impact on security, which in turn could be used to prioritize mitigation techniques.
all predecessors, using an or gate. This mimics the concept of blocked in the VCG definition. Duplication of expressions occurs if there is more than one path from a vulnerability to any given root cause (a cause without predecessors), but such duplication does not affect the meaning of the graph, only its size, and can be reduced through simplification of the resulting expression.
4.2 Development Process Design Security activity graphs can be used to design additions to software development processes that are intended to eliminate specific vulnerabilities; this is the main goal of our work. Given a complete and correct SAG for a particular vulnerability, pick a subset of all activities so that if they are all true, the input to the vulnerability vertex becomes true. Assuming that the corresponding activities are all implemented perfectly, the vulnerability will be prevented. Exactly which activities to pick depends on factors external to our current work, such as limitations on e.g. platform or language selection or attributes of the overall development process being used. The SAG clarifies what options are available and what tradeoffs must be made between mitigation techniques. Furthermore, VCGs and SAGs can be used for process improvement. As new knowledge is gained, it is added to the graphs. This will show whether current activities are still adequate, or if changes to the process must be made.
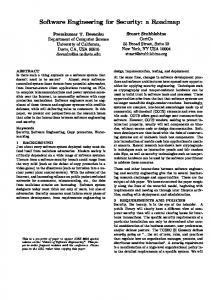
Example The following is an abstract example of how the procedure works using the VCG in figure 1. The example focuses on vulnerability A. The first step is manual enumeration of mitigation techniques. In this example, assume the root cause can be mitigated by M1 ; cause A can be mitigated by (M2 ∧M3 )∨(M2 ∧ M4 ); and cause B can be mitigated by (M2 ∧M4 )∨M5 (each Mi represents some mitigation technique). The security activity graph is then constructed by calling sag(v,g), where v is vulnerability A and g in the VCG. The result will be (((M2 ∧ M3 ) ∨ (M2 ∧ M4 )) ∨ M1 ) ∧ (((M2 ∧ M4 ) ∨ M5 ) ∨ M1 ); shown in graphical form in figure 4 Vulnerability A
4.3 Analyzing Development Activities
+ +
+
+ × M2
M1
× M3
M2
Security activity graphs can also be used to determine the security consequences of activities (or lack of activities) in software development. This can be used to evaluate proposed changes to the software development process, or the effectiveness of a proposed activity. This analysis is performed by setting the activity in question to true or false (as appropriate) and analyzing how this affects the value of the graph at the vulnerability of interest. If the outcome goes from true to false, the SAG can help determine what other activities need to be taken to compensate for the change. In the future, when we have introduced non-boolean values in SAGs, this type of analysis will quantify the impact that a particular development activity has on preventing a vulnerability, in the context of an existing process. This would be a very valuable tool for evaluating proposed process changes.
×
False
M4
M2
+ ×
M1 M5
M4
Figure 4: Example of generated security activity graph The generated SAG contains a great deal of duplication and unnecessary vertices. More sophisticated generation algorithms or post-generation simplification could result in a simpler graph, such as that in figure 5. Vulnerability A + ×
5. EXAMPLE: INTEGER OVERFLOW/UNDERFLOW PROBLEMS
M1 +
M2
This example shows how vulnerability cause graphs and security activity graphs can be used to analyze certain integer overflow vulnerabilities. We show VCGs, enumeration of mitigation techniques and simplified SAGs, and discuss how the results could be used in software development.
×
M4 M3
M5
Figure 5: Simplified security activity graph
Create vulnerability cause graph
4.
POTENTIAL APPLICATIONS
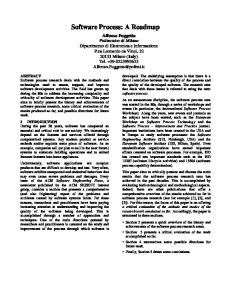
The vulnerability cause graph for certain kinds of integer overflow/underflow problems is shown in figure 6. Note that this VCG is not intended to be a complete characterization of the vulnerability; it is simply an illustration. In this example we have categorized causes roughly in requirementsrelated, design-related and implementation-related causes. The categories are indicated by the prefixes R, D and I, respectively, to improve readability. This VCG tell us, for example, that in order to avoid certain integer overflow problems, a language that does not
Vulnerability cause graphs and security activity graphs have several potential applications that we are investigating; other applications may also exist.
4.1 Understanding Vulnerabilities The primary use of vulnerability cause graphs is to understand vulnerabilities. We use VCGs to create SAGs, but they can be used in other applications where the causes of vulnerabilities are important. VCGs also clarify which
6
I2b Verify that results of functions returning large integer are not assigned to small variables I2c Implement bounds checking on all function parameters I3 Design aspects in D1 not adhered to
R1 D1
D2
I1
I2
I3
I4
I3a Verify through static analysis [I3a1] or inspection [I3a2] that bounds are adhered to or implement explicit bounds checks before all variable assignments [I1a] I1b Verify correct use of operators in expressions I1c Ensure that variables are initialized before use I1d Verify that no assignments are supposed to be comparisons I1e Verify that values of large integer types are not assigned to small integer types without bounds checking I4 Design aspects in D2 not adhered to I4a Verify through static analysis [I4a1] or inspection [I4a2] that actual call graph matches expected call graph I4b Verify that actual function signatures match expected function signatures
Integer wrap-around R1 D1 D2 I1 I2 I3 I4
Use of language susceptible to wrap-around problems Lack of clear upper/lower variable bounds Function interactions unknown at design time Lack of explicit bounds checks Function interactions not verified Design aspects in D1 not adhered to Design aspects in D2 not adhered to
Figure 6: Vulnerability cause graph for wraparounds due to integer over/underflows place limits on integer sizes can be used; failing that, clear bounds on variables need to be defined early and adhered to during development, or explicit bounds checks will be required during implementation. This VCG contains a pattern that will recur in most, if not every VCG: for every design-related cause, there is another cause representing the event that the design is not followed. Although we could have included a single vertex “design not followed”, this would lead to SAGs containing mitigation techniques irrelevant to the specific vulnerability.
Security activity graphs Expressed as predicate logic, where M (X) are the mitigation techniques for X in predicate logic form, applying the SAG creation algorithm to the VCG would result in a graph equivalent to False∨ ((M (I1) ∨ ((M (D1) ∨ M (R1)) ∧ (M (I3) ∨ M (R1))))∧ (M (I2) ∨ ((M (D2) ∨ M (R1)) ∧ (M (I4) ∨ M (R1)))))
Enumerate mitigation techniques For wrap-around errors we have identified the following mitigation techniques [5, 16]. Again, these are intended as examples, not complete characterizations of the causes.
which, expanded using the labels for each mitigation technique in the list above, is: False∨ (((I1a ∧ I1b ∧ I1c ∧ I1d ∧ I1e) ∨ (((D1a ∧ D2b) ∨ R1a)∧ (((I1a ∨ I3a2 ∨ I3a3) ∧ I1b ∧ I1c ∧ I1d ∧ I1e) ∨ R1a)))∧ ((I2a ∧ I2b ∧ I2) ∨ (((D2a ∧ D2b) ∨ R1a)∧ (((I4a1 ∨ I4a2) ∧ I4b) ∨ R1a))))
R1 Use of language susceptible to wrap-around problems R1a Use language that supports only bignums D1 Lack of clear upper/lower variable bounds D1a Define bounds for all variables D1b Define out-of-bounds behavior
This expression can be simplified by promoting R1a (mitigation at the requirements phase) towards the top of the graph and eliminating duplicated activities. The final result is shown in figure 7. This graph clearly shows the impact of activities in the requirements phase, and also shows how activities in the design phase must be complemented with activities in the implementation phase.
D2 Function interactions unknown at design time D2a Define how functions and modules interact in the software D2b Define flow of data within functions I1 Lack of explicit bounds checks I1a Implement explicit bounds checks before all assignments I1b Verify correct use of operators in expressions I1c Ensure that variables are initialized before use I1d Verify that no assignments are supposed to be comparisons I1e Verify that values of large integer types are not assigned to small integer types without bounds checking
6. RELATED WORK There are several proposals for security guidelines for software development. Microsoft defines security-focused development process goals as a set of high level guidelines and introduces a trustworthy computing security development lifecycle based on those goals [11]. The proposed development lifecycle is a spiral development process, which is roughly followed by Microsoft. Examples of proposed high-level goals are creating a central security team, raising awareness through education, understanding the adversaries, and using secure design practices [4]. McGraw defines
I2 Function interactions not verified I2a Verify that large integers are not passed to small parameters
7
Integer wrap-around + ×
R1a × I1b
I1c
I1d
I1e
×
I1a D1a
+
×
+ I2a + D2b
I3a2
I2b
I2c
D2a
× +
D2b I4a1
I4b I4a2
I3a3
Figure 7: Simplified SAG for integer wrap-around
7. FUTURE WORK
software security as a system-wide issue, which requires both security mechanisms (e.g. access control), design for security and robust design. He focuses on applying security best practices like risk analysis, security reviews and penetration testing, to various software artifacts (e.g. design and code) [12]. Both Lipner and McGraw focus on certain aspects of the secure software problem and provide recommendation lists, but the high-level nature of these make them difficult to apply and evaluate. Our work takes a more structured approach. We start with the problem itself: vulnerabilities in software, and work from there up to concrete mitigation techniques, which in some cases will implement the high-level recommendations proposed by e.g. Lipner and McGraw. Another approach is taken by CLASP (Comprehensive, Lightweight Application Security Process) [16], an application security process and extension to the Rational Unified Process [6]. CLASP consists of role-based activities for development team members, and it provides a root cause database of problems in code with information about how they can lead to vulnerabilities in software. Our work differs from CLASP in several important ways. We take a phase-based rather than role-based approach, which we think will be easier to apply to wide range of processes; we aim for documented industrial validation of the effects of our process; and we consider configurability by end users (i.e. process designers and developers) and continuous process improvement key goals of our work. Developing software using experience-based best practices does help prevent vulnerabilities, and at first glance, our work may appear to offer little advantage over this approach. However, we believe that it does offer several important long-term benefits. Most importantly, our approach is configurable and it is designed to support continuous process improvement in a structured way. Furthermore, we expect that activity selection will not require a security expert, as all necessary information will have been encoded into the SAG. It is likely that many current best practices will be present in SAGs as security activities, but they will be placed in context, clarifying exactly what they do, and what the alternatives are. There are a number of tools today that range from modeling tools for specifications and design to code analyzers [14]. These tools address various aspects of software security but they tend to be applied in an ad hoc manner. By including tools as mitigation techniques in SAGs, our work can clarify exactly what role specific tools can play in software development, and what effects they can be expected to have.
We have applied the idea vulnerability cause graphs and security activity graphs to integer overflow problems and other buffer overflow problems, and are currently exploring the application of these ideas to other types of vulnerabilities, categorized according to a system based on the work of Landwehr et al. [8]. There is a great deal of work ahead before VCGs and SAGs can be applied as effectively as we want to real-world problems and processes. The most important points we have identified are the following:
Extension to the entire lifecycle Vulnerability cause graphs and security activity graphs must be able to express issues throughout the entire lifecycle of a system. Extension to testing is straightforward (it requires no changes to the fundamentals presented here); extension to deployment and maintenance may require changes to the formalism if circular dependencies are discovered.
Complete characterization of vulnerabilities We need to completely characterize a set of vulnerabilities in order to verify that VCGs and SAGs are sufficiently expressive to model several important vulnerabilities, their causes and associated mitigation techniques. We currently have partial characterizations of a number of problems related to buffer overflows.
Non-boolean models Currently, we assume that mitigation techniques (sometimes several in conjunction) are 100% effective at eliminating vulnerability causes. We are unable to model mitigation techniques that merely reduce the risk of a vulnerability. One of our priorities for the future is extending VCGs and SAGs so risk-reducing mitigation techniques can be accurately modeled and combined.
Cost modeling If it were possible to attach costs to activities in security activity graphs, it might be possible to quantify tradeoffs between cost and security, or optimize the selection of activities given a desired cost or level of mitigation. Together with non-boolean modeling, this should make SAGs usable for risk management.
Order, priority and preference The current version of VCGs and SAGs do not express order, priority or preference between actions. To some extent,
8
order is implied by the actions, but we expect that explicit ordering will be needed at some point. Similarly, it is likely that we will want to express preference or priority between actions; however, non-boolean graphs combined with cost modeling should clarify preference between actions in a more flexible way.
Finally, in addition to our main goals, VCGs and SAGs seem to lend themselves to other applications such as process analysis, and, in the future, cost-benefit and risk analysis.
9. ACKNOWLEDGEMENTS We would like to thank Claudiu Duma, whose many helpful comments have helped improve this paper. This research is supported by VINNOVA, the Swedish Governmental Agency for Innovation Systems.
Empirical validation The use and effectiveness of VCGs and SAGs must be empirically validated. We plan to do this in collaboration with two major system vendors who are already proficient at developing secure software but wish to improve further.
10. REFERENCES [1] K. Beck. Embracing change with extreme programming. IEEE Computer, 32(10):70–77, 1999. [2] K. Beck. Extreme Programming Explained: Embrace Change. Addison-Wesley, 1999. [3] G. Hoglund and G. McGraw. Exploiting Software: How to Break Code. Addison-Wesley, 2004. [4] M. Howard. Building more secure software with improved development processes. Security & Privacy Magazine, 2(6):63–65, Nov-Dec 2004. [5] M. Howard and D. LeBlanc. Writing Secure Code. Microsoft Press, 2003. [6] I. Jacobson, G. Booch, and J. Rumbaugh. Unified Software Development Process. Addison-Wesley, 1999. [7] J. Koziol, D. Litchfield, D. Aitel, C. Anley, S. Eren, N. Mehta, and R. Hassel. The Shellcoder’s Handbook: Discovering and Exploiting Security Holes. Wiley, 2004. [8] C. Landwehr, A. Bull, J. McDermott, and W. Choi. A taxonomy of computer program security flaws, with examples. ACM Computing Surveys, 26(3):211–255, 1994. [9] W. S. Lee, D. L. Grosh, F. A. Tillman, and C. H. Lie. Fault tree analysis, methods and applications – a review. IEEE Transactions on Reliability, R-34, August 1985. [10] R. C. Linger. Cleanroom process model. IEEE Software, 11(2):50–56, March 1994. [11] S. B. Lipner. The trustworthy computing security development lifecycle. In Proceedings of the 20th Annual Computer Security Applications Conference, pages 2–13. IEEE Computer Society, December 2004. [12] G. McGraw. Software security. Security & Privacy Magazine, 2(2):80–83, Mar-Apr 2004. [13] S. R. Palmer and J. M. Felsing. A Practical Guide to Feature-Driven Development. Prentice-Hall, 2002. [14] S. T. Redwine and N. Davis. Task force for improving security across the development lifecycle task force report, Appendix B: Processes to produce secure software, 2004. [15] SSE-CMM website. http://www.sse-cmm.org/ (accessed June 2005). [16] J. Viega. The CLASP application security process, 2005. http://www.securesoftware.com/ (accessed June 2005). [17] J. Viega and G. McGraw. Building Secure Software. Addison-Wesley, 2002.
Define methodology for using VCGs and SAGs We have a good idea how VCGs and SAGs can be used to improve the software development process, but we need to further refine and document a methodology suitable for use by software engineers. Such a methodology must address how to choose activities based on the needs of the software and the capability of the organization. We also see a connection to models such as SSE-CMM [15]. Our methodology should assist those who wish to target a particular maturity level (or equivalent) in choosing security-related activities.
Tool support Use of VCGs and SAGs will require tool support. Complete graphs are likely to be very large, and combined with multiple vulnerabilities, keeping track of all the data will be very difficult. To date, we have implemented tools that convert VCGs to SAGs and to visualize SAGs. These tools have been used for many of the examples in this paper.
8.
CONCLUSIONS
In this paper we have introduced two graphs to assist process designers and developers improve security throughout the software development process: vulnerability cause graphs (VCGs), which encode knowledge of vulnerabilities and their causes, and security activity graphs (SAGs), which are generated from VCGs and encode knowledge of how activities in software development combine to prevent vulnerabilities. It is important to recognize that a process designed to enhance security in software cannot be static: if it does not evolve as threats evolve, then its overall utility will start decreasing very day it is conceived. For this reason, a long term goal of our work is to develop a methodology for improving process components to handle new threats and vulnerabilities as they evolve. We think that VCGs and SAGs will support process improvement effectively. We do not think that ad hoc improvement of security in the software development processes is sustainable. Therefore, we aim to define a structured methodology for both developing and improving process components. VCGs and SAGs will be at the core of this methodology. The abundance of different software development methodologies is certainly proof that no single process fits everyone. Furthermore, not every system has the same requirements on security. We aim to be agnostic with respect to process and security requirements, so configurability (with respect to development process and security requirement) is an important long term goal – hence “unified”. Again, VCGs and SAGs appear to support this.
9