[3] Andy Gill. Debugging Haskell by observing intermediate data structures. Electronic Notes in Theoretical Computer Science, 41(1), 2001. 2000 ACM.
Towards a Theory of Tracing for Functional Programs based on Graph Rewriting Olaf Chitil and Yong Luo Computing Laboratory University of Kent Canterbury, United Kingdom
Abstract The tracer Hat records in a detailed trace the computation of a program written in the lazy functional language Haskell. The trace can then be viewed in various ways to support program comprehension and debugging. Here we describe a model of the trace that captures its essential properties and allows formal reasoning. The trace structure was inspired by standard graph rewriting implementations of functional languages. The trace is a graph which is constructed by graph rewriting but goes beyond simple term graphs. Key words: Tracing, debugging, Haskell, augmented redex trail.
1
Tracing Functional Programs
Usually, a computation is treated as a black box that performs input and output actions. However, we have to look into the black box when we want to see how the different parts of the program cause the computation to perform the input/output actions. The most common need for doing this is debugging: When there is a disparity between the actual and the intended semantics of a program, we need to locate the part of the program that causes the disparity. Other reasons for observing how a program works are checking internal consistency properties (cf. assertions), reverse-engineering of an insufficiently documented program, and learning to program. Tracing is the process of obtaining additional information about the internal workings of a computation. Conventional forms of tracing are the introduction of specific statements in a program for logging information about the computation progress and the use of debuggers for stepping through a computation and inspecting the computation state. For lazy functional languages different tracing methods have been developed for two reasons. First, conventional methods are unsuitable, because intermediate expressions with large unevaluated subexpressions are hard to read and the lazy reduction strategy is too complex for human This paper is electronically published in Electronic Notes in Theoretical Computer Science URL: www.elsevier.nl/locate/entcs
Chitil and Luo
programmers to follow. Second, conventional tracing methods reflect only the computational model of imperative programs: a long sequence of state transformations. In contrast, functional programmers want to ignore lowlevel operational details, in particular evaluation order, but take advantage of properties such as explicit data flow and absence of side effects. Several tracing systems for lazy functional languages are available, all for Haskell [11,6,3,12,9]. All systems take a two-phase approach to tracing: (i) During the computation information about the computation is recorded in a data structure, the trace. (ii) After termination of the computation the trace is used to view the computation. Usually an interactive tool displays fragments of the computation on demand. The programmer uses their knowledge of the intended behaviour of the program to locate faults. A trace is a complex graph of expression components; most trace structures also incorporate links to the source program. The trace as concrete data structure liberates the viewer from time and the sequential evaluation strategy. Each tracing method gives a different view of a computation; in practice, the views are complementary and can productively be used together [2]. Hence the Haskell tracer Hat integrates several methods [12]. During a computation a single unified trace is generated, the augmented redex trail (ART). Separate tools provide different views of the ART, for example algorithmic debugging [10,6,9], following redex trails [11] and observing functions [3].
2
The Aim: A Theory of Tracing
Hat transforms a Haskell program into a new Haskell program. When the compiled new program is executed, it writes the ART to a file in addition to any normal I/O the original program would perform. This indirect definition of the ART through program transformation makes it hard to determine the ART of even a simple computation by hand. Because two programs are involved, the original and the transformed one, it is hard to disentangle which assumptions about the semantics of each are made. The ART also includes many special constructs, because Haskell is a large and complex language. Therefore our aim is to give a direct and simple definition of the ART that captures its essential properties and will enable us to formally relate a view to the semantics of a program. Thus viewed information has a clear meaning and can be used correctly to understand a program and locate program faults. We concentrate on the ART because it was already distilled as a unified trace from several other traces. This focus on the ART does not preclude revisions of its definition in the light of new insights. We are aware of several shortcomings (lack of information) that we intend to remove. Although the ART is only used for Haskell, it is suitable for both strict and non-strict pure functional languages, as our definition shall clarify. 2
Chitil and Luo
3
What is a Trace?
A trace consists of information about a computation. It (partially) describes how the computation of a program obtained its outputs from its inputs. However, if computation is deterministic (as we assume here), then the complete computation is already determined by the program and its inputs. So is a trace hence superfluous? No. Any detail of a computation can be reconstructed from program and inputs by rerunning the computation, but that would be expensive. The purpose of a trace is to provide quick and easy access to any desired information. Most viewing tools are interactive; hence they have to provide demanded bits of information quickly, in particular independent of the length of the computation. Operational semantics provide descriptions of computations. Both a sequence of expressions M0 → M1 → M2 → . . . of a small-step operational semantics and the proof tree of a big-step natural semantics are descriptions of computations. However, they are unsuitable as traces not just because they do not provide quick access to all desired information, but more obviously because they are full of redundancies. In both these descriptions most parts of expressions are replicated many times. A trace has to be as compact as possible to describe long computations.
4
The Origin of the Augmented Redex Trail
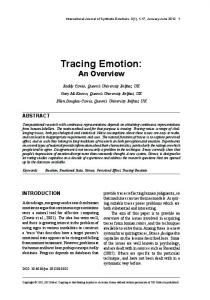
Term graph rewriting [8] provides an operational semantics for functional programs that is abstract and closely related to standard term rewriting semantics. In contrast to terms/expressions, graphs allow the sharing of common subexpressions as it happens in real implementations of functional languages, such as the G-machine [4] or the more efficient STG-machine [7]. Term graph rewriting can correctly model the asymptotic time and space complexity of real implementations [1]. For us, sharing is the key for a space efficient trace structure and closeness to the implementation also promises easy creation of a trace. Consider the representation of the Haskell expression sort [’t’] as term graph ([’t’] is syntactic sugar for (:) ’t’ []): • •• ••
sort •• :
[] ’t’
3
Chitil and Luo
The function sort is defined by the following two rewrite rules: sort [] = [] sort (x:xs) = insert x (sort xs) We perform a rewriting step with the second equation: • ••
•• →
••
sort •• :
[]
••
•• sort
insert
’t’
For this rewriting step we have added new graph nodes that represent the right-hand side of the used rewrite rule. We have a new root node denoting the top of the expression. To ensure that the new top node is correctly shared (when the redex is only part of a larger expression), implementations actually overwrite the top node of the redex with the top node of the reduct. Some graph nodes become unreachable from the root and are removed by a garbage collector: • •• •• []
insert
•• sort
’t’
It is vital for the efficiency of graph rewriting that each rewriting step only adds a small number of new nodes; subexpressions that are bound to the variables of the rewrite rule are shared with the redex graph and hence need not be added. For tracing a computation we simply do not overwrite the redex with the reduct, but construct the reduct separately, still sharing subexpressions with the redex as above. We connect the top nodes of redex and reduct by a special reduction edge. Using also the rewrite rules sort [] = [] insert x [] = [x] 4
Chitil and Luo
we obtain the following trace of a complete computation (dotted arrows are reduction edges): •
••
•• ••
sort •• :
•• []
•• •• sort
insert
••
[]
[]
:
’t’
This is the augmented redex trail (ART) of the computation. It is a compact but detailed representation of the computation; in particular, it directly relates each redex with its reduct. Its creation in both practise and theoretical model is greatly simplified by the fact that each reduction step only adds to the trace but never modifies the already existing parts. As described here, the ART has no information about the order of reduction steps. It does not say that sort [] → [] happened before insert ’t’ [] → [’t’]. This information is irrelevant for most views provided by Hat. This observation agrees with our idea that functional programmers abstract from time. Because Hat writes the nodes of the ART into file in the order of their creation, timing information is actually available. If it later proves necessary, we can easily add it to our model.
5
Programs
Operational semantics for functional languages that describe sharing, in particular the widely used semantics of Launchbury [5] and its variations, are based on an initial translation into a small core calculus that is rather different from programming constructs mostly used in programs. Such a core calculus is suitable for compilers. In contrast, a trace supports a programmer in understanding how a program works. Hence it is important that the trace relates to the program as originally written. We limit ourselves to the most frequently used program language features: named functions and pattern matching. Our programs are higher-order term rewriting systems. variable f, g, x, y expression
M, N := x | C
variable data constructor
| M N application 5
Chitil and Luo
Each data constructor is associated with a natural number, its arity. A data constructor application CM1 . . . Mn is fully applied if n is the arity of C. A pattern P is an expression formed only from variables and fully applied data constructors. f P1 . . . Pn = M for n ≥ 0 is a rewriting rule for the variable f . A program is a set of rewriting rules. The left-hand sides of any two rewriting rules for the same variable must have the same number of patterns and they must not have a common instance. Thus the term rewriting system of the program is confluent.
6
Formalising a Trace Graph
Graphs have the disadvantage that the choice of node and edge elements is usually irrelevant because we are mostly interested in the labels. The notion of graph morphism becomes central, because we do not want to distinguish isomorphic graphs. Isomorphism classes of graphs are inconvenient to handle. Hence we choose a standard representation of graphs where a node describes the path from the root of the graph to the node. A node is a (possibly empty) string of the letters l, r and t, where l means following the left argument of an application, r means following the right argument of an application, and t means following a reduction edge to the top of the reduct. node letter
i, j := l | r | t
node n, m, o ∈ {l, r, t}∗ Because of sharing, several paths may lead to the same node in the graph. However, in trace graphs there exist canonical paths: We start with the term graph of the start expression that has no sharing, so every node has a unique path. In every rewrite step we add a number of nodes, each of which has exactly one incoming edge, so a unique path as well. Rewriting also leads to sharing of already existing nodes, but we do not change the identity of a node because of that. So a node describes the single path by which it was reachable at creation time and thus nodes even contain useful information. Here our previous example with node identities: • ǫ
t
•• l
r
sort rl rll
:
tl
•• rr
•• rlr
[]
tll
tr
•• trl
insert
’t’
6
tt
•• ••
sort
trt
[]
ttl ttll
:
•• ttr
••
[]
Chitil and Luo
We do not explicitly include reduction edges in the graph, because they are already implicitly given through our choice of nodes. A reduction edge always points from a node n to the node nt. If and only if node nt exists in the graph, there is a reduction edge from node n to node nt. The real Hat ART also includes so-called parent edges that we have not mentioned yet. Each node has a parent edge that points to the top node of the redex that caused its creation. For example, the parent of node tll is node ǫ. The parent of node trt is node tr. This information is also encoded in our nodes: parent(nt) := n parent(nl) := parent(n) parent(nr) := parent(n) parent(ǫ) := undefined Each node is labelled with a node expression, which may point to further nodes. node expression T := x variable | C
data constructor
| n
indirection
| n m application Similar to functional implementations we need an indirection node expression. To record a reduction we have to add at least one node. If we reduce with a projection, such as id x = x, then a new indirection node will be created, which points to the argument of id. Definition 6.1 A trace graph is a partial function G : n 7→ T such that its domain is prefix-closed, that is, if ni ∈ dom(G), then n ∈ dom(G). We sometimes regard a trace graph G as a set of tuples {(n, G(n)) | n ∈ dom(G)}. A trace graph is closed if all nodes occurring in its node expressions are in its domain. When composing two trace graphs we have to rename the nodes of at least one of them. ( nm if m ∈ D prefix(D, n)(m) := m otherwise We extend the renaming function prefix to node expressions and then combine two trace graphs G1 and G2 with mi = n ∈ / dom(G1 ) but m ∈ dom(G1 ) as follows: G1 +n G2 := G1 ∪ (prefix(dom(G2 ), n) ◦ G2 ◦ prefix(dom(G2 ), n)) 7
Chitil and Luo
Defining a non-sharing graph for a given expression is straightforward. However, looking ahead at the next section we want to consider expressions that may also contain nodes. This makes the definition slightly more complex: graph(x) = {(ǫ, x)} graph(C) = {(ǫ, C)} graph(n) = {(ǫ, n)} {(ǫ, M N )} {(ǫ, l N )} + graph(M ) l graph(M N ) = {(ǫ, M r)} +r graph(N ) ({(ǫ, l r)} +l graph(M )) +r graph(N )
if M and N are nodes if only N is a node if only M is a node otherwise
Because of reduction edges, a single node of a trace graph may represent many expressions. For example, the most evaluated form of node n of graph G is mefG (n), obtained by always following reduction edges: ( mefG (nt) if nt ∈ dom(G) mefG (n) = meftG (G(n)) otherwise meftG (x) = x meftG (C) = C meftG (n) = mefG (n) meftG (m n) = mefG (m) mefG (n)
7
A Reduction Step
We define a reduction step in terms of substitution on expressions. To obtain correct sharing, the substitution substitutes nodes instead of expressions, so we work on expressions that contain nodes. The function pmef obtains all partial most evaluated forms from a node, expressions that include nodes. For our example trace graph pmefG (ǫ) = {ǫ, ttl ttr, ttl [], (ttll ttlr) ttr, ((:) ttlr) ttr, . . .}. pmefG (n) = {n} ∪ pmeftG (endG (n)) ( endG (nt) if nt ∈ dom(G) endG (n) = G(n) otherwise pmeftG (x) = {x} pmeftG (C) = {C} pmeftG (n) = pmeftG (endG (n)) pmeftG (m n) = {M N | M ∈ pmefG (m), N ∈ pmefG (n)}
Definition 7.1 The rewrite relation → on trace graphs is defined as follows. Let n ∈ dom(G) with nt ∈ / dom(G). If there is a rewriting rule L = R in the 8
Chitil and Luo
program and a substitution of nodes for variables σ such that Lσ ∈ pmefG (n), then G → G +nt graph(Rσ). Trace graph rewriting is subcommutative, that is, for G → G1 and G → G2 exists G′ with G1 →= G′ and G2 →= G′ . Definition 7.2 A trace graph G with graph(M ) →∗ G for some expression M is an augmented redex trail (ART). An ART is closed and acyclic. We have not yet defined any reduction strategy for a lazy or eager functional language. The structure of the ART is independent of any reduction strategy and we hope to formulate and prove most properties of interest without reference to any reduction strategy.
8
Further Work
Here we have presented and motivated the basic definitions for a theory of tracing. We are still wondering if some definitions, in particular trace graph rewriting, can be simplified to simplify proofs. There are still many properties to prove. Algorithmic debugging is a semi-automatic method for locating a faulty rewrite rule in a program [10,6,9]. The method is based on a tree-based representation of the computation, the evaluation dependency tree (EDT). The EDT can easily be constructed from the ART. Using the ART we have proved that if a computation yields an incorrect result, then algorithmic debugging correctly locates the faulty rewrite rule. Currently we are studying two extensions of the ART model. First, we add local rewrite rules to the program. Information about the value of a free variable, such as variable x of function f in the definition g x y z = f y + f z where f v = v + x needs to be available in the trace. Second, the current ART is acyclic, but implementations of lazy functional languages actually create cyclic graphs for constants such as ones = 1 : ones The real ART produced by Hat also contains cycles in such cases and it is well known that these cause problems for example for algorithmic debugging. We intend to compare definitions of ARTs with and without cycles to determine which information is lost. 9
Chitil and Luo
References [1] Adam Bakewell. Using term-graph rewriting models to analyse relative space efficiency. In TERMGRAPH 2002 International Workshop on Term Graph Rewriting, volume 72 of Electronic Notes in Theoretical Computer Science. Elsevier Science Publishers, 2002. [2] Olaf Chitil, Colin Runciman, and Malcolm Wallace. Freja, Hat and Hood — A comparative evaluation of three systems for tracing and debugging lazy functional programs. In Markus Mohnen and Pieter Koopman, editors, Implementation of Functional Languages, 12th International Workshop, IFL 2000, LNCS 2011, pages 176–193. Springer, 2001. [3] Andy Gill. Debugging Haskell by observing intermediate data structures. Electronic Notes in Theoretical Computer Science, 41(1), 2001. 2000 ACM SIGPLAN Haskell Workshop. [4] Thomas Johnsson. Efficient compilation of lazy evaluation. In Proceedings of the SIGPLAN ’84 Symposium on Compiler Construction, pages 58–69. ACM Press, 1984. [5] John Launchbury. A natural semantics for lazy evaluation. In Conference Record of the Twentieth Annual ACM SIGPLAN-SIGACT Symposium on Principles of Programming Languages, pages 144–154. ACM Press, 1993. [6] Henrik Nilsson. Declarative Debugging for Lazy Functional Languages. PhD thesis, Link¨ oping, Sweden, May 1998. [7] Simon L. Peyton Jones. Implementing lazy functional languages on stock hardware: The spineless tagless G-machine. Journal of Functional Programming, 2(2):127–202, April 1992. [8] Detlef Plump. Term graph rewriting. In H. Ehrig, G. Engels, H.-J. Kreowski, and G. Rozenberg, editors, Handbook of Graph Grammars and Computing by Graph Transformation, chapter 1, pages 3–61. World Scientific, 1999. Volume 2: Applications, Languages and Tools. [9] B. Pope and Lee Naish. Practical aspects of declarative debugging in Haskell-98. In Fifth ACM SIGPLAN Conference on Principles and Practice of Declarative Programming, pages 230–240, 2003. [10] E. Y. Shapiro. Algorithmic Program Debugging. MIT Press, 1983. [11] Jan Sparud and Colin Runciman. Tracing lazy functional computations using redex trails. In H. Glaser, P. Hartel, and H. Kuchen, editors, Proc. 9th Intl. Symposium on Programming Languages, Implementations, Logics and Programs (PLILP’97), pages 291–308. Springer LNCS Vol. 1292, September 1997. [12] Malcolm Wallace, Olaf Chitil, Thorsten Brehm, and Colin Runciman. Multipleview tracing for Haskell: a new Hat. In Preliminary Proceedings of the 2001 ACM SIGPLAN Haskell Workshop, UU-CS-2001-23. Universiteit Utrecht, 2001. Final proceedings to appear in ENTCS 59(2).
10