gant analysis of RAPD markers as described by Michel- more et al. (1991) ..... Schwartz HF, Pastor Corrales MA, Singh SP (1982) New sources of resistance to ...
Theor Appl Genet (1993) 85:513-520
9 Springer-Verlag 1993
Towards an integrated linkage map of common bean 2. Development of an RFLP-based linkage map R.O. Nodari 1,,, S . M . Tsai 1,**, R.L. Gilbertson
2,
and P. Gepts 1
1 Department of Agronomy and Range Science, University of California, Davis, CA 95616-8515, USA 2 Department of Plant Pathology, University of California, Davis, CA 95616-8680, USA Received December 1, 1991; Accepted May 5, 1992 Communicated by A.L. Kahler
Summary. A restriction fragment length polymorphism (RFLP)-based linkage map for common bean (Phaseolus vulgaris L.) covering 827 centiMorgans (cM) was developed based on a F2 mapping population derived from a cross between BAT93 and Jalo EEP558. The parental genotypes were chosen because they exhibited differences in evolutionary origin, allozymes, phaseolin type, and for several agronomic traits. The segregation of 152 markers was analyzed, including 115 RFLP loci, 7 isozyme loci, 8 random amplified polymorphic D N A (RAPD) marker loci, and 19 loci corresponding to 15 clones of known genes, I virus resistance gene, 1 flower color gene, and 1 seed color pattern gene. Using M A P M A K E R and L I N K A G E - I , we were able to assign 143 markers to 15 linkage groups, whereas 9 markers remained unassigned. The average interval between markers was 6.5 cM; only one interval was larger than 30 cM. A small fraction (9%) of the markers deviated significantly from the expected Mendelian ratios (1 : 2:1 or 3 : 1) and mapped into four clusters. Probes of known genes belonged to three categories: seed proteins, pathogen response genes, and Rhizobium response genes. Within each category, sequences homologous to the various probes were unlinked. The I gene for bean common mosaic virus resistance is the first disease resistance gene to be located on the common bean genetic linkage map.
Key words: RFLP - RAPD - Linkage map - Bean Common Mosaic Virus resistance - Segregation distortion
* Permanent address: Department of Crop Science, Universidade Federal de Santa Catarina, Caixa Postal 476, 88049-Florianopolis, S.C., Brazil ** Permanent address: CENA, Universidade de Silo Paulo, Caixa Postal 96, 13400-Piracicaba, SP, Brazil Correspondence to: P. Gepts
Introduction The current linkage map of common bean (Phaseolus vulgaris; 2n = 2x = 22) is poorly developed. It consists of a small number of linkage groups that include genes controlling mostly morphological and pigmentation traits such as flower and seed color or color patterning (reviewed by Bassett 1991; Gepts 1988). Many of these traits are subject to epistatic, pleiotropic, and environmental effects, and with the exception of the locus for phaseolin seed protein and loci for ribosomal RNA, none has been assigned to a particular chromosome (Schumann et al. 1990; Durante et al. 1977). Restriction fragment length polymorphisms (RFLPs) can be used as genetic markers to construct a saturated linkage map (Botstein et al. 1980). In the past 5 years, RFLP linkage maps have been developed for Arabidopsis thaliana "(Reiter et al. 1992) and several crops such as barley (Heun et al. 1991), Brassica napus (Landry et al. 1991), Brassica rapa (Song et al. 1991), lettuce (Kesseli et al. 1990), maize (Coe et al. 1990), potato (Bonierbale et al. 1988; Gebhardt et al. 1989), rice (McCouch et al. 1988), soybean (Diers et al. 1992), and tomato (Paterson et al. 1991). The advantages of RFLP markers over morphological and biochemical markers include their relatively high number, absence of pleiotropic and epistatic effects, and higher frequency of polymorphism. Preliminary studies with a set of approximately 60 random PstI clones hybridized to genomic D N A digested with three restriction enzymes revealed high levels of R F L P in common bean. These levels reach 80-90% between the Middle American and Andean gene pools and 50-60% within these gene pools (Nodari et al. 1992). In the work presented here we have used RFLPs to develop a linkage map of common bean for use in evolutionary, genetic, and breeding studies. We also identified linkages
514 between R F L P loci and other molecular markers including RAPDs, isozymes, and seed proteins. We mapped sequences involved in responses to pathogens and Rhizobium. Furthermore, we mapped the I gene for bean comm o n mosaic virus resistance.
Material and methods Plant material The two parents of the F z mapping population were selected because they had divergent evolutionary origins and exhibited contrasting disease responses. BAT93 is a breeding line developed at the Centro Internacionalde Agricultura Tropical (CIAT, Call, Colombia) and was derived from a double cross involving four Middle American genotypes (Veranic 2, PI 207262, Jamapa, and Great Northern Tara). Jalo EEP558 was a selection from the Andean landrace Jalo obtained at the Esta~go Experimental de Pato de Minas (Minas Gerais, Brazil). Phaseolin and isozyme profiles of BAT93 and Jalo EEP558 confirmed their Middle American and Andean evolutionary origins, respectively (Koenig et al. 1989b; Singh et al. 1991 b). BAT93 is resistant to bean common mosaic virus (BCMV), rust (Uromyees phaseoli), common bacterial blight (Xanthomonas phaseoli), and anthracnose (Colletotrichum lindemuthianum), but is susceptible to angular leaf spot (Phaeoisariopsis angularis). Jalo EEP558 exhibits opposite reactions to the same pathogens (Schwartz et al. 1982; S. Singh, personal communication; R. Stavely, personal communication). Jalo EEP558 develops a large number of nodules after inoculation with Rhizobium tropici, whereas BAT93 develops few nodules (Tsai et al. unpublished results). The two parents also differ in morpho-agronomic traits such as seed size, flower color, presence of the seed corona, and length of the fifth internode (Singh et al. 1991 a). An F z mapping population of 75 greenhouse-grown individuals was obtained after selfing of the F 1 generation under insect-free conditions.
Markers: source and nomenclature Genomic clones and probes of known genes Segregations for RFLPs detected by genomic clones and probes of known genes were determined in the F z population of 75 individuals. Two genomic libraries, EcoRI-BamHI (clones numbered from GUC001 to GUC999) and PstI (clones numbered from GUC1001 to GUC1862), were constructed as described in Nodari et al. (1992). Single-copy clones were selected after hybridization of the insert with total radiolabeled bean genomic DNA as described in Nodari et al. (1992). The following sequences were also used for RFLP mapping: nuclear ribosomal RNA gene (pHA2; Jorgensen et al. 1987), s-amylase inhibitor (pHU20; Moreno and Chrispeels 1989), seed lectin or phytohemagglutinin (PMcPHA; M. Chrispeels, personal communication), phaseolin (pPhasMC31; Slightom et al. 1983), cellulase (pBAC10; Tucker and Milligan 1991), chitinase (pCH18, Broglie et al. 1986), glucanase (PG101; Edington et al. 1991), chalcone isomerase (pCHI1; Mehdy and Lamb 1987), chalcone synthase (pCHS1; Ryder etal. 1984), phenylalanine ammonia-lyase (pPAL5; Edwards et al. 1985), pathogenesis-related proteins 1 and 2 (pEIT23 and pEIT14a; Walter et al. 1990), glutamine synthetase (PCPGS2; DPS Verma, personal communication), sucrose synthetase (nodulin-100; Fuller et al. /983; Thummler and Verma 1987), and uricase (pNOD35; Nguyen et al. 1985). When the same probe detected more than one polymorphic band,
fragments of decreasing size were labeled alphabetically with an additional lower case letter. The same rule was followed for RAPD markers. Random amplified polymorphic DNA (RAPD) DNA sequences from the parents and 54 randomly chosen plants of the F 2 mapping population were amplified with randomn 10-mer primers (Kit A, Operon, Alameda, CA) in a thermal cycler (Ericomp). The cycling parameters (40 cycles) for denaturation, annealing and extension were: i rain at 94~ 1 min at 35 ~ and 2 min at 72 ~ respectively. One last cycle of 10 min at 72 ~ was performed to complete the reaction. Amplification was carried out with 25 ng of total genomic DNA in a 25 gl solution containing 1 x buffer (10 x = 100 mM TRIS-HC1 pH 8.3, 500 mM KC1, 15 mM MgCl/, 0.01% gelatin), 0.1 mM of each dNTP, 0.45 mM MgC12, 0.4 laM primer, and 1 U Taq DNA polymerase (Promega). One-half of the volume was electrophoresed on a 1.5% agarose gel (containing 0.5/.tg/ml ethidium bromide), and the RAPD polymorphisms were scored as the presence or absence of a specific band. Each amplification run included two negative controls (without DNA, without polymerase) and the two parents to verify the repeatability of the experiment. The scored bands were labeled with an R (for 9 RAPD), followed by an O (Operon), an A (Kit A from Operon) and by the number of the primer in the kit. When the same probe detected more than 1 locus, fragments of decreasing size were labeled alphabetically with an additional lower case letter. Phaseolin and isozymes Polyacrylamide and starch gel electrophoresis assays were performed as described by Koenig and Gepts (1989a, b). Seeds from 70 individuals of the mapping population were analyzed for seed-protein phaseolin type. Leaf and root tissues from the same individuals were scored for seven polymorphic isozyme systems: aconitase (ACO, E.C. 4.2.1.3), diaphorase (DIAP, E.C. 1.6.4.3), lencine aminopeptidase (LAP, E.C. 3.4.11.1), malic enzyme (ME, E.C. 1.1.1.40), methyl-umbelliferylesterase (MUE), the small subunit of ribulose bisphosphate carboxylase (RBCS, E.C. 4.1.1.39), and shikimate dehydrogenase (SKDH, E.C. 1.1.1.25). The stain recipes and genetic control for all enzymes except aconitase have been reported previously (Koenig and Gepts 1989a, b; Garrido et al. /99l). Aconitase was stained as described by Gepts et al. (1992) and showed two bands of activity. The most cathodal of these was polymorphic, with BAT93 and Jalo EEP558 carrying the Aco-21~176 and Aco-21~ alleles, respectively. Morphological and agronomic traits Three morpho-agronomic traits were evaluated: flower color, corona, and reaction to bean common mosaic virus (BCMV). Flower color (pink versus white) was evaluated in 75 F 2 plants, whereas the presence or absence of corona (Cor; Lamprecht 1961) was evaluated in F 3 seeds of the same 75 F 2 plants. The presence (hypersensitivity as revealed by "black root" necrosis symptoms in leaves and/or whole plants) or absence (typical common mosaic symptoms) of the dominant I allele, which confers resistance to non-necrosis-inducingstrains of bean common mosaic potyvirus (BCMV: Drijfhout et al. 1978), was tested in 10 individuals of 70 F 3 families by mechanically inoculating primary leaves with NL-3, a necrosis-inducing strain of BCMV (Morales and Castafio 1987). The inoculation of 10 individuals per F 3 family allowed us to distinguish at the P=0.95 level between F2 plants homozygous or heterozygous for the dominant allele at the I locus.
515
D1 -
-
D2 t--
1 0 4 4
7.1 -
1
1452
D3 I
5.3-
12.6
13,2
Mue
--
-
140
5.9
ROA04
-- 1662 _ PAL _ 1045
n.l3.o9.a o.a1.6-
J~ ~.,
1882 1315 1327
14.1
" .
1051
/
Lap-3
_=_ =.e_~_ 1367 ~:_.11..,,,~ 1026 o. 1287 2.=_ ~ 1068 7,3
....
2.o4.3"11.z 0.5 =
ROA01 108 166
1518
.
.
.
-
1054
-
1049 CHS
.
11.o
Me
D6
-
~
lO8O
14.2
~
1081
-- 1 7 1 1 a
Lec
1128
-
1038
3.2
1020
lo.~
1804
17.8
--
a
/orAl --~-~Arl -- 1314
2.4-
1228
12.3 3.s--
1593
4.9
1308
17.o --
21,4 --
~.
D7 FC
_ 1.a" s.6
--
-6.3 7.1
--1325 -
168
-
ROA 14b
1009
._~1011 ~
lO.4
zo..~ ;'.7 I I
ROA11a
ss /PRpvl
.... 9
~1612
16.6
" 1377
0.6 = 7.0 s.a
1198 1492
/~
1086 1856 1597
-
1505
1734 156 --'~ 1468b ~
2o.t ~s.~
~1061 - 1376
3.6 " 1.6.
-
Phs139~
2.4-
-GS
1861
2.21.4-
-- ROA07b ~ " 1472 1055 -- 1744
096
6.s ~
17,3 190
2.4" ;.a"
_
--
1157 133 1301
Cor
11.6 - -
"-
1031
L 1251
D9
D10
D1 1
-ROA18
!
9.9
6.
~-119
"1739
o.~_
16.o
~-..,~Skdh II
-CHI
~
--
Aco-2
~4.~
D8 9
1461
Diap
1298
I
~76=J1= 11Ol I I 157
14. --
--
6.6
6.o -
6.911
3.7 .
1132
-
-
0.5 = 6.7 s.7 -6.6
PRpv2
1032
.
11.6
16.2
16.1
.
-
1096
D5 15.7
1155
6.6ll -
D4
146 II " II 1,--IL//~
1 6 --B-- 1151 9 T 1338a 1595
113 ~
1476
16"611
1831 / / 1705 1182
.... III
1090
_~
1003
2z.o
1619
D12
1790
1291 = . 1079 9.1 ~1 / / / 1 0 6 1.6 --B-J~ 1 1 9 5 3"4 " 1 1 - - - ~ 1 4 7 9 0 . 7 ~ 16 1 . 6 ~ 30 z-2...][.-~N" 1 3 6 9 I I ~Q 1 4 8 3 9.z I I " 1801
D13
D14
D15
8.3
6.61-2~'t~ " "--m-
1107 4.6
,.=
15,
1.e
Lece URIc
Lecc
1174 4,7
1711b
1.5 ~.5
1147 1066
1273
1050 Not
assigned:
1088, 1153, 1283, 1468a, 1683a, 1683b, 1737, G101
, ROA14a
1159 1035 1512
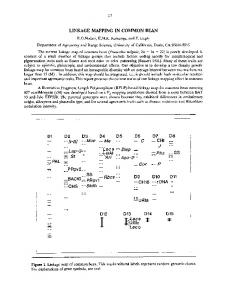
Fig. 1. RFLP-based linkage map of common bean. Linkage group numbers are indicated on top. Kosambi map distance are indicated at the left side of each interval between two markers. Genomic markers are numbered from 001 to 999 (from EcoRI-BamHI library) and from t00t to 1862 (from PstI library) (the GUC prefix was removed for the sake of simplicity). Act-2, Diap, Lap-3, Me, Mue, Rbes, and Skdh are isozyme loci. RAPD marker loci are designated by ROA followed by a number (see text for explanations). Morpho-agronomic traits are C, Cor, and/(see text for explanations). The following markers represent sequences coding for products of known function: Arl, c~AI, BACI0, CHI, CHS, CH18, GS, Lee, PAL, Phs, PRPvl, PRPv2, rDNA, SS, and URI (see text for explanations). The open bar in linkage group D1 represents an interval with a LOD score above 3.0 but with a recombination frequency above 30%
DNA extraction, digestion, and electrophoresis Total genomic DNA from frozen leaf tissue (5-7 g) that had been harvested prior to flowering was extracted as described by Nodari et al. (1992). Genomic DNA samples (5-10 ~tg) from parents and F 1 and F 2 plants were digested with either EcoRI, EeoRV, HaeIII, or HindlII restriction enzymes because these enzymes revealed the highest levels of polymorphism between BAT93 and Jalo EEP558 (Nodari et al. 1992). Restriction digestions (4-6 U enzyme//xg of genomic DNA) were performed according to the manufacturers' recommendations (Bethesda Research Laboratories and New England Biolabs) for 4 - 6 h at 37 ~ The digested DNA was electrophoresed in 0.8% agarose gels (prepared with TAE: 40 mM TRIS-acetate pH 7.4, 1 mM EDTA) for 16-20 h (1 V/cm of gel) in TAE running buffer.
Southern blotting, hybridization, and autoradiography Southern hybridization was performed according to the Zetabind protocol (AMF-CUNO, Meriden, Conn.). Approxi-
mately 30-40 ng of the insert of each clone, except pHA2, were radiolabeled with c~-[3zp]dCTP (Amersham) by the random primer method (Feinberg and Vogelstein 1984). The pHA2 plasmid was radiolabeled with the same isotope by nick translation (Rigby et al. 1977). Hybridizations were performed at 42 ~ in 50% formamide. Washes after hybridization were performed according to recommendations of the manufacturer (2 x SSC, 0.1% SDS at room temperature; 0.1 x SSC, 0.1% SDS at room temperature and twice at 60 ~ for 30 min each). Kodak X-Omat X-ray film was exposed to the membranes for a few hours to a week depending on the intensity of the signal.
Linkage analysis Linkage analysis was pertbrmed with MAPMAKER (Lander et al. 1987) and LINKAGE-I (Suiter et al. 1983). To identify the linkage groups, pairwise comparisons and grouping of markers were performed with MAPMAKER under the following conditions: (1) recombination frequency below 30% and (2) LOD
516 score equal to or above 3.0. To establish the most likely order of markers within each group, the "orders" command was used with the above-mentioned linkage criteria and with a three-point exclusion threshold of-2.0 LOD score units. Additional markers were located in these groups using the "try" command with the aforementioned linkage criteria. Kosambi map distances among linked markers were used to generate the map (Fig. 1). Pairwise comparisons to confirm detected linkage relationships between markers and goodness-of-fit tests to detect distorted segregation ratios were performed with LINKAGE-1.
Results and discussion
Segregation of markers The majority of the random PstI and EeoRI-BamHI genomic clones (75%) hybridized to a single band and, with few exceptions, segregated in a co-dominant manner. Four clones - GUC1338, GUC1468, GUC1683, and GUC1711 - detected two bands, which, in all four cases, segregated independently and represent duplications. The remaining clones displayed a hybridization pattern with more than two bands. However, in all cases just one segregating locus could be scored. Probes representing cloned genes in general gave more complex hybridization patterns than random genomic clones. With the exception of BAC10 (cellulase), G101 (glucanase), and CHI (chalcone isomerase), which hybridized to a single band, all other gene clones hybridized to multiple bands. For example, seven and six segregating bands were observed after hybridization with CHS (chalcone synthase) and Lee (seed lectin) sequences, respectively. In the case of chalcone synthase (CHS), all segregating bands mapped to the same locus. For seed lectin (Lee), four bands (Leca, Lecb, Lecd, and Leef) co-segregated at one locus in linkage group D4 and the other two (Lecc and Lece) mapped in linkage group D13 (see below). The presence of these multiple bands points to the existence of multigene families. Evidence of Ryder et al. (1987) suggests that CHS is represented by a family of six to eight genes, some of which are tightly linked. Hoffman and Donaldson (1985) identified two lectin genes 4 kb apart and tightly to the the loci coding for the homologous seed proteins arcelin and a-amylase inhibitor (Osborn et al. 1986; Moreno and Chrispeels 1989). RAPD markers were scored for the presence of absence of specific bands of high intensity that distinguished the two parents; hence, these markers segregated as dominant markers. Isozymes and phaseolin seed protein segregated as codominant markers as reported previously (Koenig and Gepts 1989 a; Garrido et al. 1991; Gepts et al. 1992). The inheritance pattern of the 152 markers analyzed in the segregating population of 75 individuals followed the expected F2 co-dominant (1 : 2:1) or dominant (3 : 1) Mendelian ratios in 91% of the cases. A small fraction (9%) of the markers deviated significantly (P