Towards Characterizing Users’ Interaction with Zoomable Video Axel Carlier, Guntur Ravindra, Wei Tsang Ooi Department of Computer Science National University of Singapore, Singapore Email:
[email protected], {ravindra,ooiwt}@comp.nus.edu.sg
ABSTRACT We conducted a user study with 4 video clips and 37 viewing sessions on how users interact with a web-based zoomable video system, where users can zoom and pan within the video to view selected regions-of-interest with more detail. The study shows that frequency of interaction is very high and the period during which users watch the video without interacting is comparable to the period of interaction. Users spend most of their time viewing a magnified version of the video. We also observe that their behavior is not easily predictable. Users, however, tend to be interested in common regions of the video. Categories and Subject Descriptors: H.5.1 [Multimedia Information Systems]: Evaluation H.4.3 [Communications Applications]: Video General Terms: Experimentation, Design Keywords: Zoomable Video, Region-of-Interest Streaming, Prefetching, Caching, User Behavior
1.
INTRODUCTION
A zoomable video system allows users to zoom into a regionof-interest (RoI) in a video and view the RoI at higher resolution. Users can pan (move the RoI) or change the zoom level during playback. In the case of zoomable video streaming, the zoom and pan commands are transmitted to the video server, which in turn streams the required RoI at the specified zoom level to the client for playback. The extent of interaction is governed by factors such as presence of interesting content, spatio-temporal location of interesting content, resolution of the display device, and interface used for interaction. Discovering non-obvious characteristics of users’ interaction provides insight into building better interfaces such as those that minimize interaction by automating scrolling and navigation. Further, such a study would provide insights into systems design, such as video coding, caching and prefetching algorithms, and desirable response time. In this paper, we present our findings on how users interact with a zoomable video system. We found that frequency of interaction is very high and the period during which users watch the video
Permission to make digital or hard copies of all or part of this work for personal or classroom use is granted without fee provided that copies are not made or distributed for profit or commercial advantage and that copies bear this notice and the full citation on the first page. To copy otherwise, to republish, to post on servers or to redistribute to lists, requires prior specific permission and/or a fee. SAPMIA’10 October 29, 2010, Firenze, Italy Copyright 2010 ACM 978-1-4503-0171-8/10/10 ...$10.00.
without interacting is comparable to the period of interaction. RoI can spread across different regions of the video, both spatially and temporally. We found that a single user’s behavior is not easily predictable, but different users tend to be interested in similar RoI. The latter is manifested as a skewed access pattern that exhibits high locality, pointing towards RoI caching as a good way to reduce response time when streaming such zoomable videos. Related Work. There is extensive study on how to perform RoI cropping and scaling [1, 4, 3], tracking [7], and the impact of encoding parameters [8] on RoI streaming and video encoding. But there is no comprehensive study on how users interact with a zoomable video system, although similar studies [10, 9, 2] exist for images. These studies mainly focus on what attracts the attention of the users rather than from the systems design perspective, which our study is taking. A common finding, however, is that different users tend to be interested in the same region. Organization. We first describe our user interface and experimental setup for studying users’ interaction in Section 2. We then present some characteristics of users’ interactions in Section 3. In Section 4, we further analyze the implication of the users’ interactions on systems design. We conclude in Section 5.
2. 2.1
USER STUDY Zoomable Video Player
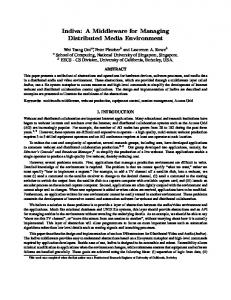
Figure 1: Snapshot of the interface
The system used for the user study consists of a web-based interface, shown in Figure 1, that provides users with the abilities to zoom and pan in a video during playback. The main screen plays the video corresponding to the user’s current region-of-interest (RoI) in a window of size 320×180 pixels. The entire video frame is visible in a smaller 160×90 pixel thumbnail display, showing the context of the RoI. The white rectangle on this thumbnail represents
CDF of Inter-Event Duration
Distribution of "Interaction State" Duration 1
1
0.9
0.9
0.9
0.8
0.8
0.8 0.7
0.7
CDF
0.5
CDF
0.7
0.6 CDF
Distribution of "Watching State" Duration
1
0.6
0.4
0.5
0.3 0.1 0 0
100
200
300 400 500 600 Duration in Frames
700
Clock Dice Transfer Gym
0.3 0.2 800
900
(a) CDF of Inter-Event Duration
0.5 0.4
0.4
Clock Dice Transfer Gym
0.2
0.6
0
50
100
150 200 250 Duration in Frames
300
Clock Dice Transfer Gym
0.3 0.2 0.1 350
400
(b) CDF of Interaction State duration
0
100
200
300 400 500 600 Duration in Frames
700
800
900
(c) CDF of Watching State duration
Figure 2: Inter-Event and State Duration
Video Clip
Length
Clock Dice Transfer Gym
4 min 22 sec 2 min 59 sec 3 min 56 sec 3 min 25 sec
Number of Events 944 467 784 932
Number of Sessions 11 7 10 9
Table 1: Properties of Video Clips
the RoI. Users can click the buttons located at the bottom right corner to pan (arrow buttons) or zoom/unzoom (+,−). Users can also use their mouse to zoom/unzoom using the scroll wheel, or pan by clicking and dragging. They can also click on the thumbnail to immediately center the RoI at a particular point. The original video has a resolution of 1920×1080. We define six discrete levels of zooming (0 - 5). Use of discrete zoom levels allows for a simplified display interface. Nevertheless, the interface can be modified to realize any zoom level by resampling before frame rendering as suggested in [6]. At Level 0, users see the whole video at 320×180 resolution. At higher zoom level, the RoI is cropped and scaled down to 320×180 for display. For example, at Level 5, users see a 320×180 cropped RoI of the original video. At Level 3, a 960×540 region of the original video is cropped and scaled down to fit the 320×180 screen. For the user study, all interactions are done locally at the client after the original video is downloaded. Thus, the response time for zooming and panning is negligible as the data to display is already available at the client.
2.2
Experimental Setup
Video Clips. We recorded videos using a single fixed HD camera with no panning, and provided users with these videos along with the web-based interface. Three videos are of magic tricks (Clock, Dice, Transfer) and one video is of a gymnastics performance (Gym). The magic performance is interesting because people can zoom in to discover the magician’s trick, or to see details like numbers and patterns on playing cards used by the magician. For Gym, it is interesting to zoom into the spring floor to focus on the gymnasts. Table 1 shows basic properties of these video clips. Procedure. Our participants had no prior experience with our interface and saw these videos for the first time during our experiment. Users had to go through a tutorial designed to familiarize them with the interface before they participate in the experiment, so that the curiosity in trying a new interface does not impact the study. After the tutorial session, links to our test video clips are presented, and users are free to watch some or all of the video clips in
any order. Users’ interactions are logged on the Web server for later analysis. Information logged includes the video name, action (pan, zoom in, zoom out), position and size of the RoI, frame number, and a session identifier given to the user.
3.
BASIC CHARACTERISTIC
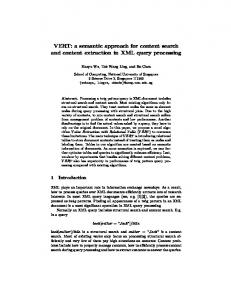
We now present some basic characteristics of users’ interaction with the videos. We first classify the interactions into four types of events: zoom, unzoom, pan, and end-of-video. Zoom is recorded when a user is requesting a higher level of detail, and unzoom, a lower level of detail. Pan is recorded when a user moves the RoI, or clicks on the thumbnail. End-of-video occurs when a user reaches the end of the video, or leaves the web page during playback. The number of frames of video rendered between two events is called an inter-event duration. The CDF of inter-event duration, shown in Figure 2(a), indicates that 70% of all inter-event durations are shorter than 40 frames (equivalent to 1.6 seconds for a 25fps video). Such a small value for inter-event duration shows that users tend to frequently interact with the video during playback. Based on this observation, we model the system usage as being in two states; an interaction state and a watching state. Two consecutive events with inter-event duration smaller than 40 frames apart are considered to be part of the same interaction. Consecutive events with inter-event durations no less than 40 frames are classified as watching state, i.e., users are watching the video without interacting with the system. Users are in interaction state if they are not in watching state. Figures 2(b) and 2(c) show the CDF of the duration of interaction state and watching state. We observe that there is 80% chance that the interaction state lasts for less than 100 frames and 80% chance that the watching state lasts for less than 200 frames. Hence the duration of successive interactions is comparable to the duration for which users watch the video. Interactions are spread over the whole video timeline. The histogram of RoI requested by the users for each video is visualized as a heatmap in Figure 3, showing that RoI are spread over the entire frame (except on the top). Figure 4 shows the distribution of zoom levels during watching state. We observe that, on every video, users spend 90% or more of their watching time at a non-zero zoom level. Hence a system that efficiently supports zoom interaction is useful.
4. 4.1
IMPLICATIONS ON SYSTEMS DESIGN Tile Streaming
Our web-based interface allows us to study user behavior with negligible interaction latency, providing insights into how users
4.2
(a) Clock
(b) Dice
(c) Transfer
(d) Gym
Figure 3: Heatmap of RoI Probability Distribution of Zoom Levels During Watching State 0.35
Zoom 0 Zoom 1 Zoom 2 Zoom 3 Zoom 4 Zoom 5
Probability
0.3 0.25 0.2 0.15 0.1
Tile Prefetching
To prefetch tiles that are useful to the user in the future, we need to predict the users’ interaction pattern. We first consider the transition between the events comprising the interaction state and the watching state. Figure 5(a) shows the probabilities of transition among the events zoom (Z), unzoom (U), pan (P), and the watching state (W), for each of the test videos. The x-coordinate indicates transition between events, for instance, ZZ means the transition between two zoom events. The y-axis indicates the probability of transition. We can see that there is no overwhelmingly large probability of transition in general. The three magic clips, Card, Transfer and Dice show larger probabilities of consecutive pan. In this case, it could be helpful to predict the direction of displacement so that we could prefetch some tiles in the neighborhood of the RoI. Figure 5(b) gives the distribution of the angle of displacement when users move the RoI. This graph shows that horizontal and vertical movements are preferred, but does not show any dominant direction, there by making prediction difficult. Figure 5(c) shows the CDF of the number of new tiles that need to be added when RoI moves (pan). The graph shows that that 73 - 90% of pan events do not require new tiles, i.e., the pan happens within the current set of tiles. New regions uncovered when the RoI moves therefore are available for display without needing to request for new tiles from the server.
0.05 0
Clo
ck
Dic e
Tra ns
fer
Gy
m
Video File
Figure 4: PDF of Zoom Levels
would interact with zoomable video streams if the network has high throughput and low latency. We now describe how we design zoomable video streaming in practice, and how user interaction pattern would affect our design. We store different versions of a video at different resolutions, corresponding to different zoom level, on our server. For example, the version corresponding to zoom level 0 (denoted v0 ) has a size of 320×180 pixels. When a user requests the video at level 0, the server streams the entire v0 . The version corresponding to level 5, v5 , has a size of 1920×1080 pixels, and when a user requests for a RoI at level 5, the server crops the RoI of size of 320×180 from v5 and streams only this RoI. As RoI cropping can be challenging due to spatial and temporal dependencies, we encode the video by partitioning each frame into a grid of cells and constraining motion estimation to within each cell as described in [4]. Cells at the same position in consecutive frames form an independently decodable “virtual” video streams, which we called tiles. When a user requests for a RoI, the server only streams the tiles overlapping with the RoI. In the rest of this section, the default tile size is 64 × 64 pixels [5]. Analysis for other tile sizes have been ommited as we found no significant differences or non-obvious results. Users may change the zoom level or the position of the RoI during playback, triggering a request to the streaming server with the co-ordinates of the new RoI. The server responds by switching to a different resolution version of the video (when zoom/unzoom) or sends a different set of tiles from the same version (when pan, if necessary). As the interaction is frequent, the system should be responsive enough. We will study in the next sections two ways to get a better response time: prefetching and caching.
4.3
Tile Caching
Another common technique to reduce response time is to cache some tiles in a streaming proxy. A key to good caching performance is locality of tile access. To study this, we look at the similarity of tiles requested by the users. For each second in the video, we compute, for each tile, the number of times it is requested, and divide it by the total number of tile requests in that second to obtain the probability of a tile being requested. We sort the tiles according to this probability, and plot the cumulative probability. Figure 6 shows the result for selected seconds for all four videos. Take Gym for example. During the 68th second, 61 of the most frequently requested tiles make up 90% of the total requests. Since there are a total of 784 tiles, this constitute less than 10% of the tiles. This results shows that high locality exists in tile requests among the users, supporting good caching performance. We repeat this for every second t of the video and find the value of xt such that the top xt most frequently requested tiles constitute 90% of the tile requests. The average xt over the whole Gym video is 62. Now, to see the effect of this skewed access pattern on caching, we take the 62 best tiles per second and cache it (we assume static caching) and compute the hit rate using the leave-one-out method. Suppose there are N users. We compute the hit rate of each user by building the static cache using access pattern from all other N − 1 users. We found that on average, each user can get a 70% hit rate. One explanation for such skewed access pattern is the similarity of actions between users. To measure the similarity between two sequences of user actions, we put all the information constituting a session (RoI’s position, zoom level, and frame number) in a single vector. We use PCA (Principle Component Analysis), taking the vectors representing each session as an input, and compute the distance of each session to an artificial mean session. The average distance between the users of Gym is 84, which is small (the distance between two random sequences is 162). While we show that prefetching based on predicting user action alone is difficult, the high similarity between user interests open up the possibility of prefetching region that many other users find
(tile size 64x64 pixels) 0.5 0.25 0 Transfer
0.5 0.25 0
Dice
0.5 0.25 0
Clock
0.5 0.25 0
0.95 Transfer
(a) Conditional State Transition Probability
0.9 0.85
Dice
0.8 Clock Dice Transfer Gym
0.75
Clock
0.7 0 0
ZZ ZW ZU ZP WZWWWU WP UZ UW UU UP PZ PW PU PP
1
Gym
CDF
0.25 0.2 0.15 0.1 0.05 0 0.25 0.2 0.15 0.1 0.05 0 0.25 0.2 0.15 0.1 0.05 0 0.25 0.2 0.15 0.1 0.05 0
Gym
90
180
270
2
360
(b) PDF of Angular Displacements
4 6 8 10 12 Number of New Tiles Required
14
16
(c) CDF of Tiles Requested
Figure 5: Characteristics Influencing Prefetching
1
1
0.8
0.8
Probability
Probability
interesting, anticipating that the current user will zoom or pan to the same region. We plan to study this in our future work.
0.6
0.4
0.2
0
50
100
150
200
0.4
0.2
68 100 150
0
0.6
68 100 150
0 250
0
50
Number of Tiles
1
0.8
Probability
Probability
1
0.6
0.4
0
50
100
150
200
250
200
Number of Tiles
(c) Transfer
0.6
0.4
0.2
68 100 150
0
150
(b) Dice
0.8
0.2
100
Number of Tiles
(a) Clock
68 100 150
0 250
0
50
100
150
200
250
Number of Tiles
(d) Gym
Figure 6: Tile Access Frequency for Seconds 68, 100, and 150.
5.
CONCLUSION
This paper presents the results of a study on how users interact with a zoomable video. We found that users zoom and pan frequently with our test video clips. Users’ interaction are hard to predict, but RoI of different users are highly similar. This user study is only preliminary. We plan to conduct further user study with more users to gain deeper understanding of sessions’ similarity and apply prefetching and caching to different classes of users. Another idea would be to artificially add an interaction delay to see if (and how) users would behave differently. We expect that the interaction frequency will reduce as a result of increased response time, there by increasing the duration of watching state in comparison to the interaction state. This research is supported by Singapore Ministry of Education‘s Academic Research Fund R252-000-368-112.
6.
REFERENCES
[1] T. Bae, T. Thang, D. Kim, Y. Ro, J. Kang, and J. Kim. Multiple region-of-interest support in scalable video coding. ETRI Journal, 28(2), 2006. [2] L.-Q. Chen, X. Xie, X. Fan, W.-Y. Ma, H.-J. Zhang, and H.-Q. Zhou. A visual attention model for adapting images on small displays. Multimedia Systems, 9(4):353–364, 2003. [3] H. El-Alfy, D. Jacobs, and L. Davis. Multi-scale video cropping. In Proc. of ACM MM’07, pages 97–106, Augsburg, Germany, 2007. [4] W. Feng, T. Dang, J. Kassebaum, and T. Bauman. Supporting region-of-interest cropping through constrained compression. In Proc. of ACM MM’08, pages 745–748, Vancouver, British Columbia, Canada, 2008. [5] A. Mavlankar, P. Baccichet, D. Varodayan, and B. Girod. Optimal slice size for streaming regions of high resolution video with virtual pan/tilt/zoom functionality. In Proc. of EUSIPCO’07, 2007. [6] A. Mavlankar, N. Jeonghun, P. Baccichet, and B. Girod. Peer-to-peer multicast live video streaming with interactive virtual pan/tilt/zoom functionality. In Proc. of IEEE ICIP’08, pages 2296–2299, San Diego,CA, 2008. [7] A. Mavlankar, D. Varodayan, and B. Girod. Region-of-Interest prediction for interactively streaming regions of high resolution video. In Proc. of International Packet Video Workshop, PV2007, Lausanne, Switzerland, Nov. 2007. [8] N. Quang Minh Khiem, G. Ravindra, A. Carlier, and W. T. Ooi. Supporting zoomable video streams with dynamic region-of-interest cropping. In Proc. of MMSYS ’10, Phoenix, Arizona, USA, 2010. [9] A. Santella, M. Agrawala, D. DeCarlo, D. Salesin, and M. Cohen. Gaze-based interaction for semi-automatic photo cropping. In Proc. of ACM CHI ’06, Montréal, Québec, Canada, 2006. [10] X. Xie, H. Liu, S. Goumaz, and W.-Y. Ma. Learning user interest for image browsing on small-form-factor devices. In Proc. of ACM CHI ’05, Portland, Oregon, USA, 2005.