Towards Distributed Monitoring and Performance Analysis Services in the K-WfGrid Project⋆ Hong-Linh Truong1, Bartosz Bali´s2 , Marian Bubak2,3 , Jakub Dziwisz2 , Thomas Fahringer1, Andreas Hoheisel4 1
4
Institute for Computer Science, University of Innsbruck, Austria {truong,tf}@dps.uibk.ac.at 2 Institute of Computer Science, AGH, Poland {balis, bubak}@uci.agh.edu.pl,
[email protected] 3 Academic Computer Centre – CYFRONET, Poland Fraunhofer Institute for Computer Architecture and Software Technology, Germany
[email protected] Abstract. The complexity and the dynamics of the Grid environment and of the emering workflow-based applications on the Grid require novel performance monitoring and analysis services in order to capture monitoring data at multiple levels of abstraction, to analyze the data and to correlate metrics among entities. In this paper, we present the design of distributed monitoring and performance analysis services in the K-WfGrid project. We give an overview of the architecture of the performance and monitoring services and discuss useful performance and dependability metrics for workflows in K-WfGrid. We describe basic system components including the monitoring and instrumentation service, the performance analysis service along with data representation and service interface. Keywords: Grid, monitoring, performance analysis, workflows, ontology
1 Introduction Monitoring and analysis services are an important part of any distributed system and are essential in Grid environments because performance and monitoring information is required not only by the user to get an overview about the infrastructure and the running applications, but also by most Grid services such as brokering services, data access optimization services, and schedulers. However, due to its complexity and dynamics, various entities encompassing infrastructure elements, applications, middleware, and others, need to be monitored and analyzed in order to understand and explain performance behavior in the Grid. The K-WfGrid EU IST Project entitled ”Knowledge based Workflow system for Grid Applications” [6] aims at providing knowledge-based supports for workflow construction and execution. The main objective of the K-WfGrid project is to enable the user to semi-automatically compose a workflow of Grid services, execute the composed workflow application, monitor the performance of the Grid infrastructure and workflow applications, analyse the resulting monitoring information, capture the knowledge contained in the information, and reuse the joined knowledge gathered from all participating users in a collaborative way in order to efficiently construct workflows for new Grid applications. ⋆
The work described in this paper is supported by the European Union through the IST-2002511385 project K-WfGrid.
In order to support the semi-automatic workflow composition, execution, and knowledge capture, it is required to monitor and analyse various types of performance and monitoring data related not only to resources and networks but also to workflow applications. Moreover, to support the knowledge gathered during the operation of the Grid, performance results must be stored in a knowledge base for further tasks. Our goal is to design and develop distributed monitoring and performance analysis services that address the aforementioned issues. In this paper, we describe the design of the K-WfGrid monitoring and analysis services with special focus on requirements, architecture, sensors, metrics, data representation, and service interfaces.
2 Related Work and Motivation Current monitoring systems are usually specialized, and focus only on application or infrastructure monitoring [2, 11]. Those systems are tailored to collect and deliver a particular type of data which is reflected in their internal design and interface exposed to clients to obtain the monitoring data. Instead of monitoring applications or infrastructure separately, we proposed a unified approach to the performance monitoring and analysis for the Grid [10]. To integrate monitoring data coming from various sources such as Grid applications, infrastructure, middleware, etc., an integrated and generic framework for measuring and collecting these diverse monitoring data is required. However, until now, little effort has been spent in the development of such frameworks. Rare efforts to provide a generic monitoring infrastructure are R-GMA [4] and Mercury Monitor [7]. R-GMA employs an approach based on relational data model. Mercury is a system which provides monitoring data as metrics and also supports steering. It provides sensors for monitoring of application and resources. However, both approaches have their limitations. R-GMA is based on Java servlets technology, where data is represented in an XML-based relational model. Those features make the solution rather slow, not suitable for transfers of large amounts of data in a grid-scale system. Mercury, in fact, was built to overcome the limitations of R-GMA with respect to data transfer. Nevertheless, both Mercury and R-GMA have deficiencies that make them unsuitable for a service-oriented knowledge-rich workflow-based grid system. First, the systems are not tailored to work in a service oriented environments. Both client-monitor and monitor-sensor interfaces are based on custom APIs which limits their interoperability. Second, data representation does not take into account semantic information which is indispensable to make the data really meaningful. Third, we argue that monitoring and performance analysis of workflow applications requires a specific support which is not addressed in the mentioned systems. This support includes, among others, a high-level abstract representation of workflow applications presented to end-user, and a standardized instrumentation service; using the abstract representation, the user can pick the workflow regions, workflow activities, or code regions to be instrumented, while the instrumentation service makes it possible to issue the instrumentation requests in a standardized manner. Motivated by the limitation of existing tools, our goal is to develop a distributed and generic monitoring and performance analysis framework for workflow-based Grid applications. Unique features of our approach are the following:
– monitoring sensors layer is fully decoupled from the monitoring system itself; standard libraries, interfaces and procedures are developed to deploy both stand-alone and application-embedded (instrumentation) sensors, – monitoring sensors are configurable, for example, they may be activated or deactivated at any time; sensors can be event-driven or demand-driven and with/without rule-based monitoring capabilities [9], – monitoring data and performance results are delivered to clients on the fly, – monitoring data types are defined with ontological description to support knowledge extraction, – monitoring and performance analysis services are decentralized, based on a peerto-peer model, to support scalability, availability and fault-tolerance, – monitoring and analysis services are available as Grid/Web services to enable interoperability while the actual communication with the services is based on a lowlevel, but fast, mechanism to ensure efficiency.
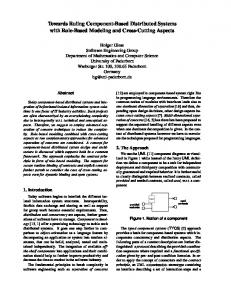
3 Overall Architecture To cope with the dynamic nature of the Grid, the monitoring and analysis services have to operate in a distributed and self-organizing manner. Therefore, the monitoring and analysis services will utilize a peer-to-peer architecture model. As the key issues of the Grid are integration and interoperability, the Grid services for monitoring and performance analysis of Grid infrastructures and workfows must expose a well-defined interface to other services in order to access them. Moreover, K-WfGrid is based on a service-oriented architecture (SOA). As a result, the monitoring and analysis services must be built based on a Grid service-oriented model. Performance data has to be shared among diverse services and multiple types of data have to be collected and delivered by the monitoring and analysis service. Therefore, it requires a common XML-based representation for instrumentation and monitoring requests, and XML representations for performance and event data that can be used by other services, user interfaces and Grid applications to invoke and control the monitoring and performance analysis. As performance results are stored in a knowledge base, a novel ontology describing performance data of Grid workflows is required. Fig. 1 presents the architecture of Grid performance monitoring and analysis services. The architecture includes two main services: Generic Monitoring and Instrumentation Infrastructure (GEMINI) and Grid Performance Analysis Service (PAS). All of them will be OGSA-based services executed on multiple Grid sites. They support the instrumentation, monitoring and performance analysis of Grid workflow-based applications and infrastructures. To implement them we rely on existing implementations of the Web Service Resource Framework (WSRF)[13], e.g. Globus Toolkit (GT) [3]. The GEMINI is responsible for conducting the instrumentation, collecting performance data from applications and resources and providing that data to the PAS or other external services which require performance and monitoring data. GEMINI includes an Instrumentation Service (supporting dynamically enabled instrumentation of Grid workflow applications) and a Monitoring Service (collecting and providing performance measurements). The PAS controls the instrumentation of Grid workflow applications and analyzes the performance of applications and infrastructures based on
Instrumentation
WP5: Knowledge Assimilation Agent
WP2: Scheduler
Data query, subscription, registration Grid Performance Analysis Service
WIRL (Workflow Instrumentation Request Language)
Performance Visualization Performance Performance Interpretation and Analysis Service Bottleneck Search
Performance Experiment Repository WP4: Grid Organizational Memory
Performance Data Query and Subscription (PDQS) based on XPath/XQuery
Instrumentation Service External Services
Monitoring Service Event Infrastructure
Performance Data Repository
Grid Performance Monitoring and Instrumentation Service Events, performance data delivery
Workflow applications
Compute Resources
External Services
Events, performance data in XML
Fig. 1. Architecture of the Monitoring and Performance Analysis Framework
performance and monitoring data provided by the GEMINI. Moreover, the PAS supports the performance interpretation and bottleneck search for workflows. Both services – GEMINI and PAS – publish the information about themselves and about the types of performance data they provide into the Grid Organizational Memory (GOM) [5] which is an OWL-based knowledge base and service registry currently beeing developed within the K-Wf Grid project. In addition, an event infrastructure is provided by the monitoring infrastructure.
4 Metrics The performance monitoring and analysis services will capture and provide several performance metrics that characterize workflow-based Grid applications. Metrics are well classified and are associated with multiple levels of abstraction such as code region, invoked application, activity, workflow construct, etc. To help the client query and subscribe metrics provided by the monitoring at runtime, information about every metric monitored is described in OWL (Web Ontology Language) [12]. The performance data of workflows is described in an OWL-based ontology by using WfPerfOnto [8]. Performance metrics are built from performance measurements and events obtained. Examples of application performance metrics are elapsed time (end-to-end response time), CPU time spent in user/system mode, communication time, etc. [8]. Events containing execution status of workflows include workflow instantiating workflow / instantiation finished (success / error), workflow execution state changed (e.g., initiated,active, terminated, suspended, completed), etc. Infrastructure metrics include both static and dynamic information, e.g. machine name, IP address, operating system, CPU type, maximum memory/disk size, memory/disk/CPU usage, availability of a machine/service, network path bandwidth/latency/ availability, etc. Given a large number of infrastructure monitoring tools, (see [2]), we do not intend to develop a new infrastructure monitoring. Instead, we focus on the integration of existing infrastructure monitoring tools into our framework, making toolspecific metrics available through well-defined representations and interfaces.
5 Generic Monitoring and Instrumentation Infrastructure We have designed and developed a generic monitoring and instrumentation infrastructure – GEMINI. Basically, GEMINI is composed of two main layers: (1) the network of Monitors which expose external interfaces for clients, and whose main task is to act as monitoring data broker, i.e. to manage sensors and deliver clients’ requests to sensors and monitoring data back from sensors to clients; (2) Sensor Infrastructure, i.e. a number of sensors connected to Monitors which extract monitoring data and deliver it to Monitors. Though the current prototype of GEMINI features only a set of separate Monitors with a number of sensors connected to each one, in the final version we plan a fully decentralized peer-to-peer system such as the one shown in Fig. 2. In this figure, there is a distributed and decentralized network of Monitors, organized hierarchically into an upper-layer Domain Monitors (D-Monitors) and lower-layer Monitors. This organization into a super-peer topology increases the scalability of the system. A relatively low number of D-Monitors manage underlying Monitors. Thus the information needed for system management is shared only between D-Monitors.
Fig. 2. Architecture of GEMINI monitoring framework
Each D-Monitor exposes two web-service interfaces: the Monitoring Interface and the Instrumentation Interface. Clients use those interfaces for requesting monitoring data and also for issuing application instrumentation requests. The actual data transfer from sensor(s) to the client (not shown) is direct and based on a low-level communication mechanism for efficiency reasons. We provide a set of Generic Sensors which can be used to deploy both stand-alone sensors, or application-embedded ones. Generic Sensors can be easily extended with plug-ins to produce any type of monitoring data. The sensor model in K-WfGrid is an extension of a previous sensor model for Grid monitoring and data integration [10]. Several types of sensors will be supported, such as event-driven sensors (sensors deliver monitoring data upon an event), demand-driven sensors (sensors provide monitoring data upon a request), and sensors which support rule-based monitoring (sensors use rules to control their actions). Developers can very easily extend the monitoring framework just by providing new types of sensors for special purposes. In case of workflow applications, we instrument and monitor them at several layers:
– Workflow layer. In this case we are interested in information on the level of entire worklow, for example its execution status, which activity is currently running, etc. We obtain this information directly from the Grid Workflow Execution Service which is instrumented for this purpose to generate appropriate events to GEMINI. – Activity layer. This layer addresses individual activities of the workflow, including code regions inside activities. Instrumented services generate appropriate information to GEMINI to enable monitoring and analysis at this level. – Legacy code layer. Sometimes activities invoke legacy code, even, for example, stand-alone MPI applications. We support this ‘multi-lingual’ scenario by adapting ”legacy” monitoring system OCM-G to work as a sensor for GEMINI [1]. This is relatively easy thanks to the standard sensor layer of GEMINI.
6 Distributed Performance Analysis Although most monitoring tools in the Grid operate in a distributed fashion, most performance analysis tools obtain monitoring data from distributed sources but analyze this data at a centralized location. Our approach is different: we design a distributed performance analysis service (DIPAS). The DIPAS includes a set of distributed Grid services which collect performance and monitoring data from the monitoring service and collaborate in doing the analysis in a distributed fashion. Fig. 3 presents the distributed analysis framework which consists of a set of distributed Grid analysis agents. Agents are organized in groups and communicate following a peer to peer model. Agents communicate with each other by exchanging standard messages whose ontology is described by the WfPerfOnto ontology [8]. The clients of DIPAS will utilize the performance analysis service by invoking service operations provided by agents whose information will be published into the GOM. Thus any client that wants to request for performance analysis information can discover the analysis service by accessing the information published in the GOM. A client that wants to send an analysis request first locates an agent by searchFig. 3. Distributed analysis framework ing the GOM. Agents obtain monitoring data from the MIS and they can control the instrumentation of the workflows. Once an agent has done some analyses it stores the performance results into a performance experiment repository. The performance of workflows will be analyzed during runtime at various levels of detail including code region, activity, and workflow construct and workflow. Different workflow graphs and performance results are collected and stored into a performance experiment repository. Based on the performance experiment repository we can conduct
a multi-experiment analysis. Moreover, the performance analysis has to analyze the performance of concrete workflows and to map the performance results of concrete workflows to abstract workflows.
7 Service Interface and Data Representation
Besides exposing Web services operations, the monitoring and analysis services have to provide well-specified representations for the data they provide and for the request used to access and retrieve the data. In K-WfGrid, we have to address (i) how instrumentation requests are specified, (ii) how monitoring data and events are described, and (iii) how requests for monitoring data are defined. First, we will use the workflow instrumentation request language (WIRL) as the language between the instrumentation requester (e.g. the Performance Analysis Service) and the instrumentation service. WIRL is an XML-based request and response protocol developed at the Univeristy of Innsbruck. A WIRL request consists of experiment information and instrumentation tasks. Experiment information (e.g., activity identifier, application name, computational node, etc.) identifies applications to be instrumented. Instrumentation tasks specify instrumentation operations, such as a request for all instrumented functions within an application, to enable or disable an instrumented code. An instrumentation task may contain information about code regions and metrics of interest. A WIRL response contains the name of a request, the status of the request (e.g. OK, FAIL), and detailed result information. Second, performance measurements and monitoring data of applications and infrastructures are represented in XML. Each type of performance and monitoring data is provided by a sensor type. A message containing performance data of a monitored resource (e.g. machine, network path, code region) consists of information about the resource identifier, sensor identifier, experiment identifier, and the performance measurements. The sensor identifier, resource identifier, and experiment identifier are generic information (meta-data) that describes the monitoring data. The part expressing performance measurements is dependent on each sensor type. Information about the supported and available monitoring data as well as the monitoring and analysis services has to be published into the GOM so that clients can access and retrieve interesting monitoring data. Third, performance monitoring and analysis services support data query and subscription, as well as notification. Requests for data query and subscription will be expressed in a pre-defined XML schema named PDQS (Performance Data Query and Subscription). PDQS requests will be used in service interfaces for data query and subscription. PDQS requests are constructed based on OWL descriptions of the monitoring data published in the GOM. Basically, the data subscription and query requests include the subscription time (specifies the duration during which the subscription is valid), the sensor and resource identifier (determine types of monitoring data), and the data filters (used to filter the content of performance data).
8 Summary In this paper, we have presented the design of a novel distributed monitoring and analysis framework, which is currently being developed as a part of the K-WfGrid project. To cope with the dynamics and complexity of the Grid and the workflow-based applications executed on the Grid, the monitoring and performance analysis services are designed to work in a distributed manner – both in terms of architecture and functionality, following a peer to peer communication model, and to operate at multiple levels of abstraction, such as code region, activity and workflow. To address the integration and interoperability in the Grid, the monitoring and performance analysis services offer well-defined Web Service interfaces and data representations based on XML and OWL to other services and clients in order to discover the performance monitoring and analysis services and to utilize them. We are currently implementing the first prototype of our this framework. The first running prototype is expected to be available in autumn of 2005 under an open source licence.
References 1. B. Balis, M. Bubak, W. Funika, R. Wismueller, M. Radecki, T. Szepieniec, T. Arodz, M. Kurdziel: Grid Environment for On-line Application Monitoring and Performance Analysis, Scientific Pogrammning, vol. 12, no. 4, 2004, pp. 239-251. 2. M. Gerndt, R. Wismueller, Z. Balaton, G. Gombas, P. Kacsuk, Z. Nemeth, N. Podhorecki, H.-L. Truong, T. Fahringer, M. Bubak, E. Laure, T. Margalef, Performance Tools for the Grid: State of the Art and Future, APART White Paper, Shaker Verlag, 2004. 3. The Globus Project homepage: http://www.globus.org 4. R-GMA homepage: http://www.r-gma.org 5. K. Krawczyk, R. Slota, M. Majewska, B. Kryza, J. Kitowski: Grid Organization Memory for Knowledge Management for Grid Environment, In Proc. Cracow Grid Workshop, CGW’04, December 12-15, 2004, Cracow, Poland. 6. K-WfGrid project homepage: http://www.kwfgrid.net 7. N. Podhorszki, Z. Balaton, G. Gombas. Monitoring Message-Passing Parallel Applications in the Grid with GRM and Mercury Monitor. In: Grid Computing. Proc. 2nd European Across Grids Conference, Nicosia, Cyprus, January 2004, Springer. 8. H.-L. Truong, T. Fahringer, F. Nerieri, S. Dustdar: Performance Metrics and Ontology for Describing Performance Data of Grid Workflows, IEEE International Symposium on Cluster Computing and Grid 2005 (CCGrid2005), IEEE Computer Society Press, Cardiff, UK, 2005. 9. H.-L. Truong, T. Fahringer: Self-Managing Sensor-based Middleware for Grid Monitoring and Performance Data Integration, 19th International Parallel and Distributed Processing Symposium (IPDPS 2005), IEEE Computer Society Press, Denver, Colorado, USA, 2005. 10. H.-L. Truong, T. Fahringer: SCALEA-G: a Unified Monitoring and Performance Analysis System for the Grid, Scientific Programming, 12(4):225-237, IOS Press, 2004. 11. S. Zanikolas, R. Sakellariou: A Taxonomy of Grid Monitoring Systems, Future Generation Computing Systems,vol. 21, no. 1, pp 163-188, January, 2005. 12. OWL Web Ontology Language Reference, http://www.w3.org/TR/owl-ref 13. I. Foster el al. Modeling Stateful Resources with Web Services. Specification, Globus Alliance, Argonne National Laboratory, IBM, USC ISI, Hewlett-Packard, January 2004.