cover which RIPs provide the data they need. 1 Introduction. Performance analysis of applications in terascale computing requires a combina- tion of new ...
Distributed Application Monitoring for Clustered SMP Architectures? Karl F¨ urlinger, Michael Gerndt Institut f¨ ur Informatik, Lehrstuhl f¨ ur Rechnertechnik und Rechnerorganisation Technische Universit¨ at M¨ unchen {fuerling, gerndt}@in.tum.de
Abstract. Performance analysis for terascale computing requires a combination of new concepts including distribution, on-line processing and automation. As a foundation for tools realizing these concepts, we present a distributed monitoring approach for clustered SMP architectures that tries to minimize the perturbation of the target application while retaining flexibility with respect to filtering and processing of performance data. We achieve this goal by dividing the monitor in a passive monitoring library linked to the application and an active component called runtime information producer (RIP) that provides performance data (metric- and event based) for individual nodes. Instead of adding an additional layer in the monitoring system that integrates performance data form the individual RIPs we include a directory service as a third component in our approach. Querying this directory service, tools discover which RIPs provide the data they need.
1
Introduction
Performance analysis of applications in terascale computing requires a combination of new concepts to cope with the difficulties that arise with thousands of processors and gigabytes of performance data. The classic approach of collecting the performance data in a central file and running a post-mortem analysis tool (e.g., Vampir [12]) is hardly feasible in this context. The new concepts include the distribution of the performance analysis system and on-line processing, together enabling the analysis of performance data close to its origin in the target application. Automation seeks to alleviate the user of the burden of locating performance problems in the interaction of thousands of processors hidden behind massive amounts of data. Before we present our monitoring approach in detail in Section 4, we first give a short overview of existing monitoring solutions in Section 2. Then we briefly describe our design of a performance tool realizing the aforementioned concepts for which the presented monitoring approach forms the basis in Section 3. ?
Part of this work is funded by the Competence Network for High-Performance Computing in Bavaria KONWIHR (http://konwihr.in.tum.de) and by the European Commission via the APART working group (http://www.fz-juelich.de/apart).
2
Related Work
As an overview of the available monitoring solutions we present three classes of approaches and describe one representative for each. The classic approach to performance analysis relies on a monitoring library that is linked to the application writing event records to a tracefile that is analyzed after the application has terminated. A good representative here is Vampirtrace, the monitoring library that comes with Vampir [12], a powerful visualization tool that is available for many platforms. Originally limited to pure message passing applications, work is now in progress to support hybrid OpenMP/MPI programming in the library as well as in the visualizer. The current version does not support performance counters. For performance reasons, the trace data is held in local memory and dumped to a file at the end of the target application or when the buffer is full. The library supports flexible filtering based on the event type through a configuration file, but this cannot be changed at runtime. Additionally, the analysis is a pure post-mortem approach suffering of the massive amounts of performance data generated by thousands of processors. An interesting approach to minimize the monitoring overhead and to limit the amount of data generated is the dynamic instrumentation approach of DPCL [4] which is based on Dyninst [5]. Executable instrumentation code patches (‘probes’) can be inserted to and removed from a target application at runtime by calling functions of the API of the DPCL C++ class library. DPCL translates these calls to requests that are sent to DPCL daemons that attach themselves to the target application processes and install or remove the probes. The probes within the target application send data to the DPCL daemon which forwards the data to the analysis tool, triggering the appropriate callback routine. The advantage of the dynamic instrumentation approach is that the monitoring overhead can be limited to its absolute minimum since probes can be removed from the target application as soon as the desired information has been retrieved. In the context of Grid computing the existing monitoring approaches have been found to be unsuitable and several projects for grid monitoring were initiated. As an example, OCM-G [1], the grid-enabled OMIS [11] compliant monitor, is an autonomous and distributed grid application monitoring system currently being developed in the CrossGrid [3] project. The OCM-G features transient as well as permanent components. The transient component is called the local monitor and is embedded in the address space of the application. The persistent component consists of one service manager per grid site. OCM-G supports selective (activated or deactivated) monitoring to minimize overhead and perturbation and to limit the amount of monitored data to the really relevant parts. It also supports higher-level performance properties and application defined metrics and it allows the manipulation of the executable (e.g., stopping a thread) besides pure monitoring). Furthermore it includes infra-structural data like the status of the network connections, and as it is designed as a grid-wide permanent service, it includes support for monitoring of several applications by several tools and several users simultaneously.
3
The Peridot Project
Each of the monitoring solutions presented in Section 2 was considered unsuitable for the Peridot project, where we plan to implement a distributed automated on-line performance analysis system, primarily for the Hitachi SR8000 system installed at the Leibnitz-Rechenzentrum in Munich and similar clustered SMP architectures. Here we provide an overview of the target architecture as then briefly introduce the design of our performance analysis system. 3.1
The Hitachi SR8000
The Hitachi SR8000 at the Leibnitz-Rechenzentrum (LRZ) in Munich was the first teraflop computer in Europe. Initially installed in the first quarter of 2000, after a substantial upgrade in the beginning of 2002 the machine now delivers 2.0 TFlops peak performance [8].
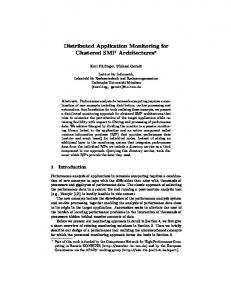
Multidimensional Crossbar Network
Node
PCI
I/O Adapter
Application Processor
Application Processor
System Control
Node
System Processor
Node
Network Control
Main Memory
Fig. 1. The Hitachi SR8000 is a clustered SMP system with eight application processors plus one system processor per node connected to a multidimensional crossbar network. The architecture of the Hitachi is schematically depicted in Fig. 1. It is a clustered SMP design, each node consists of eight application processors plus one system processor sharing a common memory through a crossbar switch. The processor is based on the RS6000, substantially redesigned it includes a large register set and pre-load and pre-fetch operations to enable a continuous data stream from main memory into cache or the floating point registers, respectively. Each node has a storage controller that supports efficient access to memory on remote nodes (remote direct memory access, RDMA) and takes care of cache coherency. The SR8000 can be used for pure message passing (inter- and intra-node) as well as for hybrid shared memory/message passing programming. OpenMP and COMPAS (COoperative MicroProcessors in single Address Space) are supported for shared memory programming within a single node.
The processors have support for eight fixed performance counters: instruction and data TLB miss count, instruction and data cache miss count, number of memory access and floating point instructions, total number of executed instructions and number of cycles. 3.2
Automated Distributed On-line Analysis
This section outlines the general architecture of the analysis system currently under development within the Perdiot project, for details consult [6]. Producer Directory Service
Multilevel Agent Hierarchy
Analysis Portal
Agent
Node Monitor
Application Thread
Agent
... Agent
Application Thread ...
Node ... (up to 168 Nodes)
Higher Level Agent Consumer high-level performance data Producer Leaf Agent Consumer low-level performance data Producer Monitor
Fig. 2. Our performance analysis system for the Hitachi SR8000 consists of a set of analysis agents arranged in a hierarchy (left). The interactions between the agents at various levels and the monitor can be regarded as producer-consumer relations (right). Our distributed performance analysis system is composed of a set of analysis agents (left part of Fig. 2), that cooperate in the detection of performance properties and problems. The agents are logically arranged into a hierarchy and each agent is responsible for the detection of performance problems related to its level in the hierarchy. Specifically, the leaf agents (the lowest level of the hierarchy) are responsible for the collection and analysis of performance data from one ore nodes, which they request form monitors. The detection of performance problems is based on an automatic evaluation of performance properties specified in the APART specification language [9,10]. Higher level agents combine properties detected by lower level agents and they assign subtasks for the evaluation for a global property to the appropriate lower level agents. The degree of autonomy of the agents at the various levels is not yet determined in our design, first versions of our system will probably follow a more conservative global steering approach. The interaction among the agents and between leaf agent and monitor can be regarded as a producer–consumer relation (right part of Fig. 2). On the lowest level, the monitors generate the performance data and leaf agents request and receive this data. On higher levels, agents act as consumers as well as producers
of refined (higher-grade) performance data in the form of (partially evaluated) performance properties. The monitors and the agents register their producer and consumer parts in a central directory service together with the type of performance data they are able to produce or consume.
4
Distributed Monitoring
As mentioned in Section 3.2, the monitor acts as a producer of performance data in our approach. This implies an active implementation where the monitor is waiting to serve requests from agents. Since we want to avoid the overhead and perturbation of the target application resulting form a monitoring library spawning its own thread or process, we split the monitor in two components coupled by a ring (circular) buffer. The first (passive) component is the monitoring library linked to the application and the second (active) component is the runtime information producer (RIP). This separation keeps the monitoring overhead and the perturbation of the target application small while flexibility with respect to filtering and preprocessing of monitoring data can be retained. 4.1
Monitoring Library
The monitoring library is completely passive, i.e., it executes only through calls of the instrumented application. Instrumentation On the Hitachi we can integrate three instrumentation approaches. OpenMP regions are instrumented by OPARI [2] (a source-to-source instrumenter), while MPI calls are captured using the usual MPI wrapper technique. Additionally, functions and procedures are instrumented by Hitachi’s C/C++ and Fortran compilers using the -Xfuncmonitor option. This instructs the compiler to call a procedure of our monitoring library on each function entry and exit. A string specifying the location of the function (source file name plus function name) as well as the line number of the beginning of the function in the source code are passed as arguments [7]. For each event (i.e., call to one of the procedures of the monitoring library) an event packet is assembled and stored in a ring buffer. The event packet consists of a header that specifies the size of the packet, the type of the event and a sequence number. The body of the packet contains a wall-clock time stamp and the current values of the Hitachi’s performance counters. Additionally, eventtype specific data is stored in the body. For OpenMP regions this includes the name of the OpenMP construct affected and its location in the source code (file name and line numbers denoting beginning and end of the construct). Ring Buffer The ring buffer connects the two components of our monitoring approach. Data written by the monitoring library is read by runtime information
Application App. Thread 1
... App. Thread n
Runtime Information Producer
Monitoring Library Assemble Event Packet
RB1 RB2 ...
RDMA
Analyze Event Packets
RBn
Fig. 3. The monitoring library writes event packets to ring buffers (one per application thread). In the RDMA setting on the Hitachi SR8000, the runtime information producer works on a copy transferred into its own address space.
producers (RIPs). A separate ring buffer is allocated by the monitoring library for each OpenMP thread, avoiding the overhead associated with locking a single buffer per process for several threads. As the buffer is organized as a ring (circular) buffer and the packets are of varying length (due to different lengths for file and function names), a new event packet may overwrite one or more older packets. In order to process the event packet, a RIP must acquire access to ring buffers embedded in the monitoring library. This can be organized in two ways. The first approach is to assign one RIP per application node which is responsible for all ring buffers of that node. A RIP can then simply map these buffers into its own virtual address spaces, provided they are allocated in shared memory segments (for example using System V shmget() and shmat()). Although this approach is feasible for any SMP machine, it can lead to artificial load imbalance since one processor per node must execute the RIP in addition to its application load. To circumvent this problem, it would be convenient to take advantage of the system processor on the Hitachi. However, this special processor is used internally by the operating system and special (root) privileges are required to execute programs there. Currently we are working together with the LeibnitzRechenzentrum to investigate the requirements concerning the utilization of the system processor for our analysis system, in order not to disturb normal operation of the operating system. The second approach is to use the remote direct memory access (RDMA) facility of the Hitachi, allowing the RIP to execute on any processor of the machine. The RIP transfers a copy of the ring buffers of a node into its own address space and works on this copy when analyzing events (Fig. 3). As this does not require intervention of the processors of the remote node (holding the ring buffer and executing the target application), this approach is very efficient and does not lead to artificial load imbalance. However, it requires one or more nodes being set aside for the performance analysis system. In both approaches, the buffers must be locked by the monitoring library as well as the RIPs for write or read access. Fortunately the Hitachi supports
efficient locks across nodes. Note that the original ring buffer is never emptied in RDMA case, since the RIP always works on a copy of the original buffer. 4.2
Runtime Information Producer
A runtime information producer (RIP) forms the active part of our monitoring approach. Its task is to provide the analysis agents of our system with the required performance data. The functionality and the data are accessed through a monitoring request interface (MRI) implemented by the RIP. Current efforts in the APART working group to standardize the MRI will enable other tools to use the functionality of our monitors as well. Node-level Monitoring A runtime information producer (RIP) is responsible for reading and processing event packets from ring buffers of its assigned application nodes. On startup, it queries the directory service that is part of our performance analysis system for the information required to access the memory holding the buffer. In the shared memory case, this is the key and the size of the shared memory segment, in the RDMA case, the coordinates of the affected node are needed additionally. Subsequently, in regular intervals (one second, say) the RIP acquires access to the buffers and processes them. If a ring buffer is a copy transferred using RDMA, it might contain packets that were already present in a previous copy. Checking the sequence numbers, the RIP recognizes new packets, from which it then creates a representation of the monitored performance data as a collection of C++ objects which lend themselves to efficient and straightforward post-processing. High-level Monitoring Analyzing certain application behavior, notably for MPI applications, requires the collection of data from several nodes. For example, to analyze message transit time we need to monitor matching MPI Sends and MPI Recvs. Hence, we need to integrate data from several nodes, generally not covered by the same RIP. In our approach we deliberately do not provide this inter-node data at the monitoring level. Instead we focus on efficient monitoring of single nodes at minimal cost and RIPs can be queried not only for aggregated data, but also for single events. Hence, a tool which requires inter-node event data registers with the RIPs responsible for the respective nodes and is then able to retrieve the desired information. We feel that this ‘flat’ monitoring it is advantageous to a hierarchical approach (e.g., OCM-G) since the latter leads to considerable complexity in the monitor to distribute the performance requests and to integrate the results. Note that it is still possible to provide similar distributed monitoring functionality at the tools level. For example an ‘adapter’ can be implemented that provides monitoring functionality for the whole machine, handling the distribution and integration of requests and responses, respectively. The directory service would be consulted to discover the location of the RIPs responsible for the individual nodes assigned to our target application.
5
Conclusion
We have presented our approach for monitoring clustered SMP architectures with the goal of minimizing overhead while enabling flexible on-line analysis. This was achieved by separating the required active component from the monitoring library into a distinct component, called runtime information producer (RIP). A ring buffer allocated in a shared memory segment couples the monitoring library and the RIP. To efficiently access the ring buffer we can take advantage of service processor and the RDMA facility of the Hitachi SR8000, our primary target machine. The third component of our monitoring approach is the directory service used by the RIP to retrieve the required information to access he ring buffers. Additionally, RIPs publish the type of performance data they provide in the directory service. Consumers, such as the agents of our distributed analysis system can then locate and query the RIPs to access the desired performance data.
References 1. Bartosz Balis, Marian Bubak, Wlodzimierz Funika, Tomasz Szepieniec, and Roland Wism¨ uller. Monitoring of Interactive Grid Applications. To appear in Proceedings of Dagstuhl Seminar 02341 on Performance Analysis and Distributed Computing. Kluiver Academi Publishers. 2003. 2. Bernd Mohr, Allen D. Malony, Sameer Shende, and Felix Wolf. Towards a Performance Tool Interface for OpenMP: An Approach Based on Directive Rewriting. In EWOMP’01 Third European Workshop on OpenMP, Sept. 2001. 3. CrossGrid Project: http://www.eu-crossgrid.org 4. Dynamic Probe Class Library. http://oss.software.ibm.com/dpcl/ 5. Dyninst. An Application Program Interface (API) for Runtime Code Generation. http://www.dyninst.org 6. Michael Gerndt and Karl F¨ urlinger. Towards Automatic Performance Analysis for Large Scale Systems. At the 10th International Workshop on Compilers for Parallel Computers (CPC 2003). Amsterdam, The Netherlands. January 2003. 7. The Hitachi Performance Monitor Function (Hitachi System Documentation). 8. The Top 500 Supercomputer Sites. http://www.top500.org 9. T. Fahringer, M. Gerndt, G. Riley, and J.L. Tr¨ aff. Formalizing OpenMP Performance Properties with the APART Specification Language (ASL), International Workshop on OpenMP: Experiences and Implementation, Lecture Notes in Computer Science, Springer Verlag, Tokyo, Japan, pp. 428–439, October 2000. 10. T. Fahringer, M. Gerndt, G. Riley, and J.L. Tr¨ aff. Knowledge Specification for Automatic Performance Analysis. APART Technical Report. http://www. fz-juelich.de/apart. 2001. 11. T. Ludwig, R. Wism¨ uller, V. Sunderam, and A. Bode. OMIS – On-line Monitoring Interface Specification (Version 2.0). Shaker Verlag, Aachen Vol 9, LRRTUM Research Report Series, (1997). http://wwwbode.in.tum.de/~omis/OMIS/ Version-2.0/version-2.0.ps.gz 12. W. E. Nagel, A. Arnold, M. Weber, H. C. Hoppe, and K. Solchenbach. VAMPIR: Visualization and analysis of MPI resources. Supercomputer, 12(1):69–80, January 1996. http://www.pallas.com/e/products/vampir/index.htm