dynamics, is fault management and recovery. If a component ... Fault-adaptive control encompasses a number of hard problems: the detection of a fault, its identification ... The discrete approach uses failure propagation graphs. ... If one actuator fails then the second actuator can still drive the control surface, although larger.
Towards Fault-Adaptive Control of Complex Dynamic Systems Gabor Karsai, Gautam Biswas, Sriram Narasimhan, Tal Pasternak, and Tivadar Szemethy Institute for Software Integrated Systems Vanderbilt University PO Box 1829 Station B Nashville, TN 37235,USA {gabor,biswas,nsriram,tal.pasternak,tivadar}@vuse.vanderbilt.edu Gabor Peceli, Gyula Simon, and Tamas Kovacshazy Department of Measurement and Information Systems Technical University of Budapest, H-1521 Budapest, Hungary {simon,khazy,peceli}@mit.bme.hu
1
Editors’ Summary An important problem in the control of complex systems, and one that inherently exhibits hybrid dynamics, is fault management and recovery. If a component fails in a system, the continuous behavior will suddenly change. In an autonomous system, the controller must be adaptive to ensure continued useful operation when faults occur. Fault-adaptive control encompasses a number of hard problems: the detection of a fault, its identification and assessment, the selection of a new control algorithm, the reconfiguration of the plant to “disconnect” the failed component, and the launching of the new control algorithm. The authors propose a model-based approach for designing control systems that are capable of accommodating faults. This chapter focuses on one aspect of this approach; however, an overview of the fault-adaptive control architecture is also given. The authors model a plant as a hybrid bond graph. Bond graphs are energy-based models, and they are extended for hybrid dynamics by representing mode transitions as controlled junctions. A hybrid observer has been developed that uses this model to track the system behavior within and across modes. Two complementary approaches to fault detection and isolation are outlined, one based on hybrid models, the other on discrete-event models. The former makes use of the hybrid observer, qualitative reasoning techniques, and real-time parameter estimation. The discrete approach uses failure propagation graphs. Controller reconfiguration relies on a previously developed controller library—an appropriate controller is selected based on current conditions. The authors discuss ideas for mitigating the large transients that can arise during controller switching. A two-tank system is used as an example throughout the chapter.
2
1. Introduction Today’s complex systems, like high-performance aircraft require sophisticated control techniques to support all aspects of operation: from flight controls through mission management to environmental controls, just to give a few examples. All this, of course, is done using a multitude of computer systems, all of which rely heavily on software technology. Software systems now play a dual role. Not only do they implement system functionalities, but they are also becoming the primary vehicle for system integration. One of the main goals of software is to implement control functions: open- and closed-loop control, from low-level regulation to high-level supervisory control. However, software enables new capabilities in control. It offers a framework that provides great flexibility for developing novel algorithms that significantly improve the performance of the system. Furthermore, brand new functionalities can be created that could not be implemented in any other way. Any real-life system is prone to physical (hardware) and logical (software) failures. These systems also require a high degree of reliability and safety, therefore, the effects of these failures must be mitigated and control must be maintained under all fault scenarios. If systems are designed with redundancy, control decisions have to be made about when and how backup systems should be activated, and how exactly the reconfiguration should be executed. For instance, aircraft often have redundant actuators for control surfaces. If one actuator fails then the second actuator can still drive the control surface, although larger forces will be required. In order to manage the fault scenario described, we need to make a series of decisions and take control actions, such as (i) the fault has to be detected, (ii) the fault source —the actuator— has to be identified and the magnitude of failure estimated (e.g., is it a partial degradation or a total failure), (iii) depending on the nature of failure, a new control algorithm has to be selected that can compensate for the partial or complete loss of the actuator, (iv) the plant has to be reconfigured so that the faulty actuator can be moved “off-line”, and (v) the new control algorithm has to be brought up with the good actuator in a way that current operation is maintained. All these decisions must be made by a control system that incorporates not only simple regulatory loops and the supervisory control logic, but also a set of components that detect, isolate, and manage faults, in coordination with the control functions. Traditional control theory gives very little guidance to the implementer of these systems. Mathematical models and formal analysis techniques have been developed for specific fault scenarios, but there is no general theory of control system design and analysis that encompasses all possible scenarios. Solutions applied to existing systems tend to take a pragmatic approach. Potential fault situations are preenumerated, and appropriate fault accommodation actions are built into the supervisory controller for each case. The approach works well for these cases, but may break down in unforeseen situations. Furthermore, most fault-adaptive control techniques are geared towards handling broken components. In many realistic situations, the system suffers only partial degradation and failures. If we can build on line capabilities to detect and estimate these partial failures, more sophisticated control algorithms can be designed to keep the system operational under these conditions. For the DARPA SEC project, we are developing a systematic model-based approach to the design and implementation of control systems that can accommodate faults. We call this approach Fault-Adaptive Control Technology (FACT, for short). Developing fault-adaptive control requires us to solve a number of technical problems beyond the capabilities of traditional control approaches. First, faults must be detected while the system is in operation. System dynamics is complex, and sensors can be noisy, therefore, differentiating degraded faulty behavior from nominal behavior of the plant quickly is a nontrivial problem. Fault detection must be followed by rapid fault isolation and estimation of the fault magnitude. Then a decision has to be made online on how to reconfigure the control system to accommodate the fault. Many alternatives may have to be evaluated, and metrics will have to be defined that either (1) select an optimal configuration, if it can be computed in a feasible manner, or (2) the best
3
possible reconfiguration is derived under given time and resource constraints. Finally, the reconfiguration must be executed, which means that set points and control parameters may have to be changed, or a different controller may have to be selected to continue system operation. The challenge is bring together methodologies from fault diagnostics, control theory, signal processing, software engineering and systems engineering to build the integrated online FACT system. In this paper, our focus is on the model-based fault isolation schemes. Section 2 discusses a referencearchitecture for FACT systems. Section 3 presents our scheme for modeling hybrid systems, i.e., continuous physical systems with discrete supervisory controllers. Section 4 describes the hybrid observer scheme for tracking nominal system behavior. Section 5 discusses the fault isolation methodologies. Preliminary results that demonstrate the effectiveness of our approach are presented. Section 6 briefly discusses fault-adaptive control and controller reconfiguration. The summary and conclusions appear in Section 7 of the paper. We illustrate the basic modeling concepts and our diagnosis algorithms using a two-tank system as the plant, with a supervisory controller. This system, while admittedly simple, has a relationship to real-life systems, such as aircraft fuel systems, which have a similar structure. Therefore this work may easily scale up to fault diagnosis and control of such real life systems.
2. FACT Architecture Our overall approach, illustrated in Fig. 1, is centered on model-based approaches for fault detection, fault isolation and estimation, and controller selection and reconfiguration for hybrid systems. The plant is “connected” to the reconfigurable monitoring and control system block. We assume the systems that we deal with combine continuous dynamics of the plant and PID controllers with supervisory control implemented as computer programs. Hybrid models [2], derived from hybrid bond graphs [3] systematically integrate continuous and discrete system dynamics and discrete events to establish the core of the modeling framework. The supervisory controller, modeled as a generalized finite state automaton, generates the discrete events that cause reconfigurations in the continuous energy-based bond graph models of the plant. Fault detection involves comparison of the expected behavior of the system generated from the hybrid models with actual system behavior, to determine when discrepancies occur. This requires the design and implementation of hybrid observers that estimate the continuous dynamic states of the system and detect mode transitions in the system operation. Sophisticated signal analysis and filtering methods linked to the hybrid observers are used for detecting deviations from nominal behavior and triggering the fault isolation schemes. Details of the signal analysis schemes are discussed elsewhere [14]. Our diagnostic schemes integrate the use of failure-propagation graph based techniques for discrete-event diagnosis [4] and combined qualitative reasoning and quantitative parameter estimation methods for parameterized fault isolation [5] of degraded components (sensors, actuators, and plant components). The dynamic system state accumulated from the observer (discrete system mode plus continuous state vector) and fault isolation units (status of faulty and degraded sensors, actuators, and plant components) define the active system state model. The tracking, fault detection, and fault isolation mechanisms, illustrated on the left of Fig. 1, together constitute a bottom-up computational approach for estimating the dynamic system state (nominal or faulty) by monitoring plant and controller variables. The reconfiguration controller uses this information to select from the controller library the controller that is most effective in maintaining desired system operation and performance. This requires the definition of metrics and decision criteria that govern the controller selection process. The selection and reconfiguration mechanisms operate in a top-down manner, using the dynamic state information to effect changes in supervisory control mechanisms, such as selection (not synthesis) of feedback control mechanisms, and re-tuning of low level regulators, such as PID or model-based controllers. The overall
4
computational architecture combines the bottom-up and top-down computational schemes in a seamless manner, via the shared active model.
Figure 1: Fault Adaptive Control Architecture The implementation and support for the online FACT architecture is based on our model-integrated computing paradigm [1]. To achieve this, we have created (1) a graphical modeling environment that facilitates building hybrid models of the plant and controllers, and (2) a set of run-time components that can execute the code synthesized from the models. This code, when integrated with the generic FACT run-time components, instantiate the architecture for a specific application domain.
3. Modeling Hybrid Systems and Controllers We assume the plant is made up of components, such as tanks and pipes that exhibit continuous behaviors. Other components like valves and switches can be turned off and on at rates much faster than the normal dynamics of the plant. There are also components, such as pumps and motors that exhibit continuous behaviors, interspersed with more discrete on/off transitions. Plants that exhibit these mixed continuous/discrete behaviors are modeled as hybrid systems. Some of the discrete changes can be attributed to changes in system configuration imposed by the supervisory controller, and other changes can be attributed to abstracting complex non-linear system behaviors into piecewise linear behaviors [28]. In this section, we first describe our hybrid bond graph modeling approach, and present the scheme for modeling the supervisory controller.
3.1 Hybrid Bond Graphs We use bond graphs as the modeling paradigm in the continuous domain [12]. Bond graphs represent energy-based models of the system in terms of the effort and flow variables of the system. Bonds specify interconnections between elements that exchange energy, which is given by the rate of flow of energy, power = effort x flow. Bond graphs represent a generic modeling language that can be applied to a multitude of physical systems, such as electrical, fluid, mechanical, and thermal systems. There exist standard techniques to build bond graph models of systems based on physical principles. State equations can be systematically derived from the bond graph representation of the system. We can systematically derive temporal causal graphs, the models for qualitative diagnostic analysis, from bond graphs [15]. We use an enhanced form of bond graphs, called hybrid bond graphs (HBG) [3] that include controlled junctions to facilitate the modeling of discrete mode transitions in system behavior. Consider the example
5
of a two-tank system shown in Fig. 2. The system consists of tanks, flow sources (simplified models of pumps), connecting pipes, and outlet pipes. Some of the pipes contain valves that can be opened and closed by the supervisory controller. The flow source can also be turned on and off by the controller. Two types of discrete events (or “jumps”) can occur in the system: 1. Controlled event: these are external controller actions that cause changes in the configuration of the system. Opening or closing of the valve on the flow source, Sf1, pipe is determined by supervisory controller signals. This represents a controlled event. 2. Autonomous events: these are changes that occur in the configuration of the system when its internal variables go above and below pre-specified values. When the level of fluid in tank 1 reaches the height of pipe R2, fluid flow commences through pipe R2. This represents an autonomous event, since the presence or absence of flow is determined by internal variables (heights of tanks 1 and 2), and not by the controller. S f1
V a lv e
C
–
T a n k C a p a c it y
R
–
P ip e R e s i s t a n c e
Sf
–
F lo w S o u r c e
Tank1 Tank2
C1
C2 R3
R1
Sf
1
R2
11
2
C1
R 12
C2
3
6
8
0
5
12
7
0
FSM for junction 1 1
Source OFF
Source ON FSM for junction 1 2 e 0.5
Figure 2: Two-tank system and its hybrid bond graph model The hybrid bond graph model of the two-tank system of Fig. 2 is illustrated on the bottom part of the figure. The two tanks are modeled as capacitors. The pipes in the system are modeled as simple resistances. Fluid flow through the pipes are assumed to be at low velocities, therefore, the inertia of the fluid is ignored. The inlet pipe is modeled as an idealized flow source, Sf1, with constant inflow rate. The 0- and 1- junctions are analogous to parallel and series junctions in electrical circuits. Fluid flow behavior is defined in terms of the effort variable, pressure, and the flow variable, fluid flow rate. The switching 0and 1- junctions represent idealized discrete switching element that can turn the corresponding energy connection on and off. The physical on/off state for each of these controlled junctions is determined by external control signals and continuous variables crossing pre-specified thresholds. These can be specified as finite state sequential automata. The sequential automata that control the on/off states for all the controlled junctions are shown in Fig. 2. There are 4 possible modes of continuous operation of the twotank system. The valve connecting the source to tank 1 may be ON or OFF. This would correspond to the switching junction 11 in the HBG. The flow between the tanks is a function of the level of fluid in the
6
tanks. This is captured by switching junction 12. Since each junction can be on or off, the system can have four distinct modes of operation.
3.2 Controller Models In the FACT architecture, the reconfigurable monitoring and control component represents all the traditional monitoring and control functions in an application. We envision that this component is implemented mainly in software, although some components might utilize dedicated hardware components. This component is also “reconfigurable”: its sub-components, their parameters, and their interconnection can be changed during system operation. To represent this reconfigurable monitoring and control component, we have developed a modeling language, called Controller Modeling Language (CML). The approach followed here is that of ModelIntegrated Computing [1]. CML represents controllers on two levels: • On the regulatory level, it represents controllers using computational blocks that form a signal flow diagram. The signal flow diagram has process-network semantics: each block is a process that is scheduled for execution upon arrival of data on its inputs. Then the process performs some calculations and may generate output data that is sent to downstream blocks. After finishing processing, the process terminates and waits for the next triggering data. • On the supervisory level, it represents controllers using a hierarchical finite state machine approach, in the style of Statecharts [22]. State machines are triggered by events, may perform state transitions triggered by events or timers, and generate other events and actions. The two levels are in a master-slave relationship. CML can also represent reconfigurable controllers: actions executed by the supervisory controller may result in changes in the regulatory controllers. Furthermore, CML has provisions for interfacing the supervisory control logic with the output of the fault diagnostics system. Reconfig. events RECONFIG. MANAGER
SUPERVISORY CONTROLLER
sampled data values, events
data values for parameters, discrete control signals, actions DISCRETE ACTUATOR SIGNALS
DISCRETE SENSOR VALUES
SAMPLED SENSOR VALUES
OPERATOR GUI (OPTIONAL)
REGULATORY CONTROLLERS
SAMPLED ACTUATOR SIGNALS
Figure 3: Relationship between the supervisory and regulatory controllers The relationship between the two controller layers: supervisory and regulatory, is shown in Fig. 3. The regulatory layer operates in a discrete-time fashion, i.e., it receives discrete (sporadic) and sampled data from the plant, and it generates discrete (sporadic) and sampled data for the actuators. On the other hand, the supervisory controller operates in a discrete-event mode, i.e., it has no explicit notion of time. It receives sampled data values and discrete events generated in the regulatory layer, and sends new data values for parameters, and events in the form of discrete control signals to the regulatory layer. The supervisory controller can also trigger the execution of reconfiguration actions. As mentioned above, during reconfiguration the design procedures associated with the regulatory blocks will be triggered to recalculate parameter values.
7
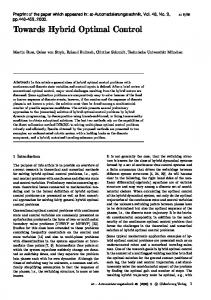
4. The Hybrid Observer The hybrid observer tracks the system behavior across different modes of operation. This involves two steps: • Tracking continuous system behavior in individual modes of operation, and • Identifying and executing all mode changes including controlled and autonomous jumps. Transitioning from one mode to the other involves: (i) switching the state equation model that defines continuous behavior in a mode, and (ii) applying the reset function to derive the initial state in the new mode. The observer uses the state equations models —derived by symbolic analysis from the hybrid bond graph model— for tracking the continuous behavior in a particular mode of operation. The analysis also derives the controlled and autonomous events that define mode transition conditions as the system behavior evolves in time. Solving for the mode transitions requires access to controller signals for controlled jumps, and predictions of state variable values for autonomous jumps. We rewrite all autonomous jump conditions in terms of the state variables of the system. The state variable estimates are obtained from the hybrid observer, and these values are used to determine if autonomous jumps have occurred. If a mode change occurs in the system, the observer switches the tracking model (to a different set of state space equations), initializes the state variables in the new mode (using a “reset” function, again derived from the hybrid bond graph model), and continues to track system behavior with the new model [13]. Fig. 4 illustrates our approach to building a hybrid observer. Hybrid Bond-graph Model
Controlled Switches
Autonomous Mode Detector
uk,yk
Generate Current State-Space Model (A,B,C,D)
Recalculate Kalman Filter
Kalman Filter
Calculate transition conditions, next states
Xk
Figure 4: The Hybrid Observer Scheme Since the input and output of the system may be affected by processor disturbances and measurement noise, we use a Kalman filter [23] to track system behavior in a single mode of operation. For a given state space model the Kalman gain matrix can be computed from the covariance matrices, as usual. Fig. 5 illustrates a sample run of our hybrid observer as it tracks the pressure values at the bottom of the tanks in the two-tank system. (The horizontal axis shows time in seconds, and the vertical axis shows pressure values.) The crosses show the ideal behavior, the circles are the noisy measurement values obtained by adding noise to the ideal values, and the continuous black line represents the hybrid observer's estimate. The system goes through a set of modes, starting from the initial mode when both valves are closed, to the second mode, where the source valve is open, to the third mode, when source valve and connecting valve are open, and the last mode, where the source valve is closed. This sequence is repeated many times but the figure shows tracking for one cycle only.
8
Figure 5: Sample run of the Hybrid Observer 5. Approaches to Fault Detection and Isolation A primary component of our system is the model-based fault detection and isolation (FDI) subsystem that can deal with sensor, actuator, and parametric faults in the system. Traditional FDI methods [6,24,25,26] are primarily directed toward additive faults that include failures in sensors and actuators. Isolation of parametric component faults, which are multiplicative, requires the use of sophisticated parameter estimation techniques [26]. Numerical techniques for state and parameter estimation often face convergence and accuracy problems when dealing with high-order models that may contain nonlinearities [7,26]. Parameter estimation techniques are often biased by measurement noise, and may need specialized approaches to compensate for these situations [26,29]. Accurate parameter estimation also requires persistent excitation of the input, and this may not always be true during system operation. Furthermore, these schemes are applicable in continuous real-valued spaces, and they do not easily extend to situations where mode transitions cause discontinuous changes in the system models and system variables. Discrete-event based diagnosis techniques have been proposed, but they require the precompiling of the fault models and fault trajectories into Finite State Machines (FSM-s) for tracking nominal and faulty system behavior [8,9]. In the section below we will show how an alternative representation form can be used which does not require the explicit construction of FSM-s. When one deals with hybrid systems that include discrete transitions, extending these continuous methodologies becomes intractable, because the residual transformation functions have to be precomputed for all modes of operation. Further, when faults occur, predicting the true system mode in itself becomes a challenging task. The fault isolation problem becomes even more complex, when the fault occurs in an earlier mode, but is detected in a later mode of operation. The predicted mode sequence may no longer be the true mode sequence the system goes through after the occurrence of the fault. Additional methods have to be introduced for detecting mode transitions, switching the system model when such
9
transitions occur, and correctly initializing the system state, so that the fault observers perform correctly. Typically mode changes introduce discrete effects that cause transients, and it may be difficult to separate the fault transients from the transients caused by mode changes. Therefore, extending continuous FDI schemes to hybrid systems is a non-trivial task. We use two approaches to the FDI problem that generalize traditional approaches: (i) the use of a robust qualitative fault isolation scheme based on tracking fault transients combined with a parameter estimation scheme for refining fault hypotheses, and (ii) fault diagnostics based on discrete event models represented as fault propagation graphs. We discuss each of these methodologies in greater detail next.
5.1 Diagnosis using Hybrid Models Our diagnosis methodology consists of three mains steps, (i) using a hybrid observer to track system behavior, (ii) detecting fault occurrences, and (iii) isolating faults in the system. The hybrid observer, discussed in the last section, uses the models of the system to track system behavior. The fault detection schemes that compare the measurements made on the system and the predictions from the observer to look for significant deviations in the observed signals are discussed elsewhere [14]. Our fault detectors for continuous systems have to be modified to signal faults only when abrupt changes cannot be attributed to mode changes [11,13]. The overall scheme for hybrid diagnosis is illustrated in Fig. 6. We overcome limitations of quantitative schemes by combining robust qualitative reasoning mechanisms with quantitative parameter estimation schemes for parametric fault isolation [5]. Hybrid bond graphs models discussed in Section 3 form the basis for generating parameterized Timed Causal Graphs (TCG-s), a representation that captures system dynamics as causal links between system variables, annotated by temporal relations, such as instantaneous effects and integral relationships [9]. The bond graph representation explicitly includes component parameters that govern system dynamics as resistive, capacitive, inertial, transformation, and signal propagation elements. The TCG representation makes explicit the effect of changes in parameter values on the dynamics of system variables. The fault isolation methodology for hybrid systems is broken down into three steps. It includes 1. A fast roll back process using qualitative reasoning techniques to generate possible fault hypotheses. Since the fault could have occurred in a mode earlier than the current mode, fault hypotheses need to be characterized as a two-tuple , where mode indicates the mode in which the fault occurs, and fault parameter is parameter of the implicated component whose deviation possibly explains the observed discrepancies in behavior. 2. A quick roll forward process using progressive monitoring techniques to refine the possible fault candidates. The goal is to retain only those candidates whose fault signatures are consistent with the current sequence of measurements. After the occurrence of a fault, the observer’s predictions of autonomous mode transitions may no longer be correct, therefore, determining the consistency of fault hypotheses also requires the fault isolation unit to roll forward to the correct current mode of system operation. 3. A real-time parameter estimation process using quantitative parameter estimation schemes. The qualitative reasoning schemes are inherently imprecise. As a result a number of fault hypotheses may still be active after Step 2. We employ a least squares estimation technique on the inputoutput form of the system model to estimate consistent values of the fault parameter that is consistent with the sequence of measurements made on the system. Each of these steps is explained in greater detail next. 5.1.1 Fast Roll Back Process using Back Propagation We use qualitative reasoning mechanism to identify an initial candidate set to explain the discrepancy in the observations and predictions. This is achieved by back propagating the qualitative value of the
10
discrepancy (−, 0 or +) through the temporal causal graph of the system. Back propagation for initial hypotheses generation has to be performed across modes the system has traversed through because the fault may have occurred in a previous mode but the manifestations are not seen until a later mode. For example, this happens when none of the observed variables are affected in the mode in which the fault occurs. The problem is that once a fault occurs the predicted mode sequence of the observer may no longer be correct, and a worst-case analysis may require considering all possible modes of the system in generating fault hypotheses. However, we make that the assumption that the controller model is correct; therefore, the observer must have predicted the correct mode sequence till the fault occurred. As a consequence, the mode in which the fault occurred must be in the predicted trajectory of the observer.
2. Fast Roll Forward
Mode, m
TCG Models
Fault Isolation System
Progressive Monitoring
Fault Residuals, Detection
Hypothesis Generation
Symbol Generation
Hypothesis Refinement
yˆ Measurements, y Parameterized Component Faults
Parameter Estimation
1. Roll Back State Equations Models
Mode, m
3. Real-time Parameter Estimation
Figure 6:Hybrid diagnosis scheme The back propagation algorithm, determines all possible component parameter deviations that are consistent with observed discrepancies in each of the modes in the mode trajectory up to the current mode. This ensures that the true fault hypothesis, which includes the fault and the mode in which the fault occurred () will be included in our initial hypothesis set. As a reasonable heuristic, we limit our search by looking back only k modes. k is determined by measurement selection analyses [27], which verifies that the effects of any fault must manifest within k mode changes. As an example scenario, we introduce a R1+ fault (this corresponds to a partial block in outlet pipe1, causing an increase in its resistance) into the system in mode 10, when the level of fluid in the tank 1 is very close to the height of the connecting pipe. This causes the autonomous transition, where flow occurs in the connecting pipe but the observer does not predict this transition. However, the fault causes the level of fluid in tank 2 to start increasing from a 0 value. The observer still works with the model where the second tank is isolated; therefore, the predicted pressure value in tank 2 is 0. At some point this leads to Tank2Pressure + (above nominal) discrepancy. The back propagation algorithm triggered by this discrepancy generates candidates, in what the algorithm thinks is the current mode (source flow on, tanks disconnected), but the actual mode is source flow on and tanks connected. The mode produces C1- and R1+ as candidates. The system also backtracks to the previous mode (source off and tanks disconnected), but that mode does not generate any new candidates.
11
5.1.2 Quick Roll Forward Process using Progressive Monitoring The quick roll forward process is initiated by applying a progressive monitoring scheme [15] to compare signatures for the hypothesized faults against observations within a mode of system behavior. Typically a mismatch would indicate that the hypothesized fault is not consistent with the observations, and the hypothesis would be dropped. In the hybrid system case, it may also imply that the hypothesized mode is not the current mode the system is operating in. In that case, we hypothesize potential autonomous mode changes that could have taken place but were not hypothesized by the observer after the occurrence of the fault. Therefore, the goal of the quick roll forward process is to arrive at situations where the system measurements are consistent with the hypothesized fault and predicted mode. We can qualitatively predict future behavior of the system under each of the hypothesized fault conditions by forward propagating through the TCG [5,15]. These predictions include magnitude and higher order derivatives of the variables of the system in the mode that the fault occurred. If the qualitative predictions do not match the observations in the mode, we consider possible autonomous mode changes from the current mode using the model of the controller plus additional information from the system to limit the number of possible mode transitions. For each of the hypothesized modes, the new TCG is used to derive a new set of qualitative predictions. If the predictions still do not match the observations, then the candidate mode is dropped. For a fault hypothesis, if all mode candidates are dropped, then the fault candidate is dropped since none of the possible mode change sequences could make the predictions for the fault candidate and the observations consistent. To limit the search in the quick Roll Forward phase, the parameter k is again invoked to limit the number of autonomous mode transitions that have to be considered. Going back to our example fault scenario, the signature for C1− implies that there should be a discontinuous change in Tank1Pressure. Since a discontinuous change in pressure was not observed, we eliminate C1− as a candidate. The signature for R1+ in the current mode indicates that the Tank2Pressure is unaffected. This does not agree with the observations, so we hypothesize a possible autonomous transition, apply this transition, and generate fault signatures for candidate R1+ in this new mode. In this mode, the signatures for Tank1Pressure and Tank2Pressure match the actual observations and so R1+ is still considered to be a possible candidate. 5.1.3 Real Time Parameter Estimation For the quantitative analysis, we estimate the deviated parameter values for each of the remaining fault candidates. To do this, we rewrite the state space equations in terms of the parameter associated with the fault candidate, and use least squares estimation techniques to derive the faulty parameter value [5]. First, the input output transfer function model of the system is derived as: The input output model is expressed in terms of the component parameters by applying the Mason’s gain
y (t ) =
g (q −1 ) h ( q −1 )
u (t )
rule to the TCG model of the system. Note that the above formula works only for linear systems. For nonlinear systems (which are approximated by piecewise linear models), a separate formula has to be developed for each region, and the parameter estimation procedure has to take these regions into account. For each hypothesis, we start a new parameter estimator. To make the computation simpler and achieve convergence faster, the parameter estimator estimates only those g and h coefficients that include the hypothesized fault parameter. All other coefficients are fixed using nominal values of the remaining parameters. If the computed g and h coefficients converge, we can invert the relation between the coefficients and the parameter to estimate the parameter value. If a controlled transition occurs during the estimation process, we calculate the new input output model and continue the estimation process using the
12
new model. We have demonstrated by empirical analysis that the estimator corresponding to the true fault parameter converges, whereas the estimators for the other parameters diverge. In our example system, we note that the R1 fault parameter affects only two of the h coefficients. Computing the R1 value from these two coefficients we get R1 = 9.87 and R1 = 10.08, respectively. Since these values are close, we make the determination that this is the true fault parameter, and use a simple average to estimate the faulty value of R1 to be 9.98.
5.2
The discrete approach
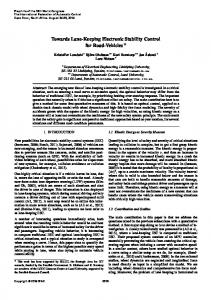
The discrete approach uses a discrete model of the dynamic system. Discrete models can offer an effective abstraction for diagnosis of large systems [8]. We employ a graphic modeling paradigm based on Failure Propagation Graphs (FPG), a set-relational model that can easily represent non-determinism. Non-determinism is a characteristic of discrete event models that are derived as an abstraction of deterministic hybrid dynamical systems. We have implemented the discrete diagnosis algorithm using Ordered Binary Decision Diagrams [16] (OBDD-s), which are used to manipulate sets and relations symbolically, thus enabling the representation of very large state-spaces. 5.2.1 Failure Propagation Model Failure propagation graphs [4] capture the relation between failure modes of physical components and discrepancies (functional failures) that can be attributed to these failures. Discrepancies may have associated alarms that indicate the presence or absence of the discrepancy. Failures propagate to discrepancies and discrepancies can cascade as well. The result is a directed graph, which leads from failure modes to observed alarms in the system. Figure 7 illustrates a failure propagation graph for the two-tank system. The Failure Propagation Graph represents trajectories that link the set of failures that can occur in the system to possible alarms. This modeling approach has the advantage of being intuitive, and it captures knowledge about the system at a high level. At the same time, it is important to assign precise meaning to the graph with relation to discrete abstractions of a hybrid dynamical system. Pressure Low Alarm
Leak
Pressure Low Flow Low
Alarm Leak
Failure Mode Pressure High
Alarm Clog
Alarm
Failure Mode
Pressure High
Failure Mode Tank1
Pipe
Tank2
Figure 7: Example Failure Propagation Graph for the Two-Tank System Starting from a closed-loop model of a hybrid dynamical system, a discrete-event model of the closedloop system can be obtained by defining events that correspond to region crossings defined by hypersurfaces in the hybrid state-space [9,30]. The set of discrepancies in the Failure Propagation Graph
13
are interpreted as a distinguished set of events that correspond to the occurrence of faults in system components. The Failure Propagation Graph describes the order of discrepancies in time, following the failure occurrence. The Failure Propagation Graph is expressed as a six tuple: (V, E, A, F, Q, T), where (V,E) is the graph (vertices and edges), A is a set of alarms, F is a set of failure modes, Q is a relation Q ⊆ V × A, and T is a relation T ⊆ V × F. To fully represent non-determinism in the model, which allows for diagnosis of multiple simultaneous faults, it is useful to define Q and T as relations between the nodes of the graph and the powerset of the alarms and failures, respectively. This approach is detailed in [16]. For computational efficiency, the FPG model can be represented symbolically using OBDD-s. 5.2.2 Diagnosis Algorithm for Single Fault scenario The diagnosis algorithm, which makes the single fault assumption, starts by parsing the FPG model into two relations, Ancestors ⊆ A × A and Descendants ⊆ F × A, representing the relation between failures and alarms. The diagnosis module is initialized with three sets: Hypothesis ⊆ F, AlreadyRinging ⊆ A, and MissingUpstream ⊆ A, all initialized to empty sets. A hypothesis data structure is maintained, which includes possible failure modes matched with a ranking, designating their plausibility. The plausibility is a function of the alarms that occur downstream from a failure mode and are considered supporting alarms versus alarms that occur upstream from supporting alarms and are considered to be missing alarms. Whenever new alarms are reported, the hypothesis set is refined based on the set-relational computation algorithm that appears in Figure 8. global set Hypothesis, AlreadyRinging, MissingUpstream; global const set Ancestors, Descendants; procedure RefineHypothesis (in set Alarms) local set NewFailureModes, NewMissingUpstream, MissingAncestor, PromotedNewFailureModes; begin (* Calculate new failure modes that have descendants in the current set of alarms but are not in the hypothesis set yet*) NewFailureModes := relationalproduct(Descendants,Alarms) intersect complement(Hypothesis); (* Add new failure modes to the hypothesis set *) Hypothesis := hypothesis union NewFailureModes; (* Calculate missing ancestor alarms: the ancestors of the current alarms, which are not in the set of missing upstream alarms and are not ringing yet *) MissingAncecstors := relationalproduct(Ancestors,Alarms) intersect complement(MissingUpstream) intersect complement(AlreadyRinging); (* Calculate new missing upstream alarms: all the descendant alarms of the current hypothesis set, which are also in the missing ancestor alarm set *) NewMissingUpstream := relationalproduct(Descendants,Hypothesis) intersect MissingAncestors; (* Update set of missing upstream alarms *) MissingUpstream := MissingUpstream union NewMissingUpstream; (* Update set of already ringing alarms *) AlreadyRinging := AlreadyRinging union Alarms; (* Increment rank of faults which have new supporting alarms and no new missing upstream alarms *) PromotedNewFailureModes := relationalproduct(DescendantAlarms,Alarms) intersect complement(relationaproduct(Descendants, NewMissingUpstream)); end
Figure 8:Discrete Diagnosis Hypothesis Refinement Algorithm 14
5.2.3 Example – Two Tank System The two-tank system is operated with fluid flowing from Tank 1 to Tank 2 through the connecting pipe. For a fault scenario in which a decrease in pressure in Tank 2 is detected, followed by an increase in pressure in Tank 1, the results of the diagnosis using the algorithm in Figure 8 are: “Pipe.Clog” with rank 2 and “Tank1.Leak” with rank 1 and “Tank2.Leak” with rank 1.
6. Controller selection Our approach is to develop a library of controllers, which is indexed by sets of characteristics. The goal is to use the information about current system state, i.e., the current mode of operation and system state vector along with failed and degraded states of components and subsystems to select a controller that best suits current and long term performance objectives. We address the controller reconfiguration task on two levels. At the supervisory (discrete) level, reconfiguration implies modification of high-level control actions. This can take the form of replacing a current action sequence by a new sequence, or altering the sequence of actions in the current set. This type of reconfiguration requires that the supervisory control logic be explicitly represented as a data structure. Our challenge is to adopt model-based approaches to representing supervisory control programs, and to develop reconfiguration procedures governed by different kinds of fault conditions. At the lower (continuous) level of control, the system relies on regulators, which can range from simple switching controllers, to PID mechanisms, and then model-based controllers. Reconfiguration at this level can take on three different forms. 1. Set point changes for handling simple fault situations, such as a partially degraded component. 2. Controller tuning for handling cases where the fault changes the plant dynamics (e.g., changes in the capacitive and inertial parameters in the plant), and the re-tuning of the controller is a viable solution. 3. Structural changes (i.e., rewiring or replacing the regulators) may compensate for complex faults where the current controller architecture is unable to maintain the desired control because of a significant fault (e.g., sensor faults, actuator faults, and major structural changes in the plant, such as pump failures or valves stuck at closed). All of the above cases may lead to the introduction of large switching transients into the system. We are investigating a number two ways to manage the reconfiguration. Two examples are as follows. • The Blender approach. In this technique, a “new” controller gradually replaces the “old” controller. The reconfiguration starts with the old and new controllers connected to a tapered switch. Initially the output of the "old" controller is fully connected to the plant. As time proceeds, the switch setting is gradually moved from the old to the new controller setting. At the end of the process, the new controller completely replaces the old one. Interesting research issues that we have to deal with include design of the blending function for control signals at intermediate stages of the tapered switching process and the speed (and thus the dynamics) at which the switching is accomplished to avoid unnecessary transients in the plant dynamics during the reconfiguration process. • The State Initialization approach. If rapid reconfiguration is required, the tapered switch approach may not be fast enough. In this case, the new controller should replace the old one, possibly within the sampling interval set for the system. To avoid large bumps, the internal state of the new controller should be initialized in such a way that it generates a control signal after reconfiguration that is minimally different from the last signal generated by the old controller. There is an interesting and highly relevant aspect of controller reconfiguration that is also being addressed: the explicit management of reconfiguration transients. Early results [24,25] show that there are a number of techniques available for mitigating reconfiguration transients in control systems. If the selected approach of controller re-initialization and/or blending does not meet the requirements for the reconfiguration dynamics other, more explicit transient suppression techniques can be applied to mitigate the effects of switching.
15
7. Conclusions and Future Work We have applied our continuous and discrete FDI methodology to diagnosing faults in a two-tank system with a number of valves. A simple supervisory controller model took the system through a number of filling, emptying, and mixing cycles. We were successful in tracking continuous system behavior through discrete mode changes, and isolating faults when they occurred, with the discrete and continuous diagnostics algorithms. As a next step, we would like to extend the two diagnostic algorithms to work in a more cohesive fashion, and inform each other as they come up with fault hypotheses. Once this step is completed, we will introduce the controller selection mechanisms to have a comprehensive implementation of the FACT architecture that has been presented in this paper. We are also looking at applying this technology to more real-world applications, such as the fuel transfer system in modern aircraft. The physical components of the fuel system include a number of tanks, interconnecting pipes, valves, and pumps. In addition, the system is equipped with sophisticated controls to support reliable and robust fuel delivery under a variety of flight conditions, at the same time ensuring that the gravity of aircraft center of gravity is not compromised. In addition, the controllers have to deal with a number of fault scenarios, such as pump failure and pipe leaks. The goal under such conditions is not to compromise aircraft safety, but to save as much fuel as one can to continue the current mission. To achieve this the system should utilize built-in redundancy mechanisms to compensate for the failure, and at the same time, maintain control. We are currently developing models of a generic aircraft fuel system, and testing and validating the FACT tools and techniques on a number of example scenarios that have been generated using a high fidelity simulator.
Acknowledgements The DARPA/ITO SEC program (F33615-99-C-3611), and The Boeing Company have supported the activities described in this paper. We would like to thank Dr Kirby Keller and Mr. Mark Kay for their help.
References [1] Sztipanovits, J., Karsai, G.: “Model-Integrated Computing”, IEEE Computer, pp. 110-112, April, 1997. [2] Branicky, M.S., V. Borkar, S. Mitter, 1994. “A Unified Framework for Hybrid Control: Background, Model, and Theory,” Proceedings of the 33rd IEEE Conference on Decision and Control, Lake Buena Vista, FL, Paper No. LIDS-P-2239. [3] Mosterman P.J. and G. Biswas, 1998. “A theory of discontinuities in physical system models,” Journal of the Franklin Institute:335B, pp. 401-439. [4] Misra A., Sztipanovits J., and Carnes J., 1994. “Robust Diagnostics: Structural Redundancy Approach,” Knowledge Based Artificial Intelligence Systems in Aerospace and Industry, SPIE's Symposium on Intelligent Systems, Orlando. [5] Manders E.J., S. Narasimhan, G. Biswas, and P.J. Mosterman, 2000. A combined qualitative/quantitative approach for efficient fault isolation in complex dynamic systems. 4th Symposium on Fault Detection, Supervision and Safety Processes, pp. 512-517. [6] Patton, R.J., Frank, P.M., and Clark, R.N. (eds.), 2000. Issues of Fault Diagnosis for Dynamic Systems, Springer-Verlag, London, U.K. [7] Chen, J. and Patton, R.J. 1999. Robust Model-Based fault Diagnosis for Dynamic Systems, Kluwer Academic, Boston, MA. [8] Sampath, M. et al., 1996. “Fault Diagnosis using Discrete-Event Models,” IEEE Trans. On Control Systems Technology: 4(2), pp. 105-124.
16
[9] Lunze, J. 1999. “A Timed Discrete Event Abstraction of Continuous Dynamic Systems,” Intl. Journal of Control: 72, pp. 1147-1164. [10] Alur, R. et al., 1993. Hybrid Automata: an algorithmic approach to the specification and verification of hybrid systems, in, R.L. Grossman, et al., eds., Lecture Notes in Computer Science, Springer, Berlin, 736, pp. 209-229. [11] Narasimhan, S. and Biswas, G. 2000. Using Supervisory Controller Models for more Efficient Diagnosis of Hybrid Systems. Submitted to Hybrid Systems: Control and Computation, Intl. Workshop, Rome, Italy. [12] Rosenberg, R.C. and Karnopp, D.C. 1983. Introduction to Physical System Dynamics, McGraw Hill, NY. [13] Narasimhan, S., Biswas, G., Karsai, G., Pasternak, T., and Zhao, F., 2000. “Building Observers to Handle Fault Isolation and Control Problems in Hybrid Systems,” Proc. 2000 IEEE Intl. Conference on Systems, Man, and Cybernetics, Nashville, TN, pp. 2393-2398. [14] Manders E.J., Mosterman, P.J., and Biswas, G., 1999. Signal to symbol transformation techniques for robust diagnosis in TRANSCEND, Tenth International Workshop on Principles of Diagnosis, Loch Awe, Scotland, pp. 155-165. [15] Mosterman P.J. and Biswas G., 1999. Diagnosis of Continuous Valued Systems in Transient Operating Regions, IEEE Trans. on Systems, Man and Cybernetics:29, pp. 554-565. [16] Pasternak, T. Extended Relational Models for Diagnosis, Masters Thesis, Vanderbilt University, August 2000. [17] Lunze, J., Diagnosis of Quantized Systems by Means of Timed Discrete-Event Representation, in Proc. Of Thirds International Workshop on Hybrid Systems, Computation and Control, Lecture Notes in Computer Science, volume 1790, pages 258-271, March 2000. [18] Simon, G., Kovácsházy, T., and Péceli, G., 2000. “Transients in Reconfigurable Control Loops,” IEEE Instrumentation and Measurement Technology Conference, IMTC/2000, Baltimore, Maryland, USA. [19] Simon, G., Kovácsházy, T., and Péceli, G., 2000. “Transient Management in Reconfigurable Systems,” International Workshop on Self Adaptive Software, Oxford University, England. [20] Pierce, C. S. "Note B: The Logic of Relatives." In Studies in Logic by Members of the Johns Hopkins University Boston: Little Brown and Co. 1883 [21] Ledeczi A., Bakay A., Maroti M.: Model-Integrated Embedded Systems, in Robertson, Shrobe, Laddaga (eds) Self Adaptive Software, Springer-Verlag Lecture Notes in CS, #1936, February, 2001. [22] David Harel, Michal Politi: Modeling Reactive Systems with Statecharts: The Statemate Approach, McGraw-Hill, 1998. [23] A. Gelb, Applied Optimal Estimation, MIT Press, Cambridge, MA, 1979. [24] H.L. Jones, Fault Detection in Linear Systems, Ph.D. thesis, Massachusetts Inst. of Technology, 1973. [25] R. Mangoubi, Robust Estimation and failure Detection, A Concise treatment, Springer Verlag, New York, NY, 1998. [26] J.J. Gertler, Fault Detection and Diagnosis in Engineering Systems, Marcel Dekker, Inc., 1998. [27] S. Narasimhan, P.J. Mosterman, and G. Biswas, “A Systematic Analysis of Measurement Selection Algorithms for Fault Isolation in Dynamic Systems,” 9th Intl. Workshop on Principles of Diagnosis, Cape Cod, MA, pp. 94-101, May 1998. [28] P.J. Mosterman and G. Biswas, “Towards procedures for systematically deriving hybrid models of complex systems,” Hybrid Systems: Computation and Control, Third Intl. Workshop, Lecture Notes in Computer Science, vol. 1790, N. Lynch and B. Krogh, eds., Springer Verlag, Berlin, Germany, pp. 324337, March 2000. [29] L. Ljung, System Identification: Theory for the user, Prentics Hall, Englewood Cliffs, NJ, 1987. [30] X.D. Koutsoukos, P.J. Antsaklis, J.A. Stiver, and M.D. Lemmon, “Supervisory Control of Hybrid Systems,” Proceedings of the IEEE: Special Issue on Hybrid Systems, P.J. Antsaklis, ed., pp. 1026-1049, 2000.
17