Towards Implementation of Motor Imagery using Brain Connectivity Features Huaijian Zhang, Ricardo Chavarriaga and Jos´e del R. Mill´an CNBI, Ecole Polytechnique F´ed´erale de Lausanne, Switzerland
[email protected] Abstract This study aims to explore modulation of the connectivity pattern when people perform left hand versus right hand motor imagery and probe the feasibility of adopting connectivity information to discriminate these tasks. Nine subjects were recorded with 16-channel EEG system, covering sensorimotor cortex. Non-normalized directed transfer function (DTF) is used to obtain the brain connectivity between EEG electrodes. The results demonstrate that the modulations of intrahemispheric and interhemispheric information flows are not identical during left and right hand motor imageries. Particularly, the mu rhythm is highly modulated in intrahemispheric brain interactions, whereas the high frequency bands are more related with distant interhemispheric brain interactions. Furthermore, classification results suggest that the DTF features bring additional informative features for the classification between two tasks.
1
Introduction
Brain-computer interface (BCI) has been developed as a possible solution for enabling communication capabilities to people who lose motor functions [9]. The use of motor imagery (MI) is a common approach for BCI systems to send mental command by imagining the movement of limbs [9] [7]. Currently, most motor imagery BCI systems adopt power spectral density (PSD) or common spatial filter as discriminative features between tasks. Recently, some studies have explored the possibility of using the brain interaction patterns between EEG channels as classification features, e.g. phase difference or directed transfer function (DTF) [8] [2]. The objective of the present work is to study the use of DTF features for BCI, as well as the modulations of brain connectivity during MI. We compare the performance of features extracted by DTF and the PSD features, as well as their combination for decoding BCI commands. Moreover, we assess the modulations of brain connectivity to evaluate the interhemispheric and intrahemispheric interaction patterns.
2 2.1
Methods Experimental protocol
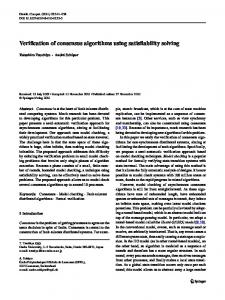
In this study, we focus on a two-class motor imagery task, left hand versus right hand [6]. Subjects are instructed to move a horizontal bar by imaging the movement of their hands. We analyze offline experiments, involving nine subjects that perform two runs of BCI training. Each run comprises 30 trials of motor imagery for each class. Before each trial, a visual cue is presented to show the target, and the bar starts moving after one second, as shown in Figure 1.A. During each trial a feedback bar that moves to the target continuously for 4 seconds is shown to the subject. EEG signals are recorded using a 16-channel g.USBamp amplifier (g.tec medical engineering, Schiedelberg) with a sampling rate 512 Hz. The signal is band-pass 1
Figure 1: Experimental protocol of motor imagery and the montage of the EEG cap. Each trial includes fixation (1000 ms), cue (1000 ms) before the bar starts moving. filtered between 0.1 Hz and 100 Hz and notch filtered at 50 Hz. The 16 EEG channels are over the sensorimotor cortex as shown in Figure 1.B.
2.2
Signal processing and classification
To compare the performance between PSD and DTF, features are computed 16 times per second. The PSD of each channel is computed using the Welch method for the past one second, with the window (Hanning) size 500 ms and overlapping 50%. PSD features are collected between 2-50 Hz with the step size 2 Hz. DTF is also computed in the same period of one second, by estimating the coefficients of multivariate autoregressive (MVAR) model based on Yule-Walker equation, which includes all 16 EEG channels with order 8. The system transfer matrix in frequency domain is obtained by applying fast Fourier transform on the MVAR coefficients, as the so-called non-normalized directed transfer function [5]. The step size of DTF is 2 Hz, resulting in a three dimensional matrix 16×16×25 (channel × channel × frequency) for each time step of 1/16 s. The log values of either PSD or DTFS are then used for Classification. We compare the classification with three types of features: (1) PSD features; (2) DTF features; (3) Combination of both PSD and DTF. We compute the Fisher score on the offline runs to select the most informative features, defined by f s = |m1 − m2 |/(s21 + s22 ), where mk and s2k represent the mean and variance of class k. In the combined case we use the features that are selected in PSD and DTF separately. Linear discriminant analysis (LDA) is used for classification (left vs right MI), assuming Gaussian distribution of the data samples. The classification performance is evaluated by 10-fold cross validation and the area under the curve (AUC) of the testing sets.
3 3.1
Results Brain connectivity patterns
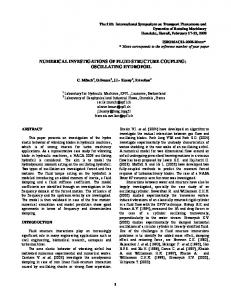
We compute the interaction between and within hemisphere to explore the modulation patterns during motor imagery tasks. The left hemisphere is defined as the channels FC3, FC1, C3, C1, CP3 and CP1, whereas the right hemisphere corresponds to FC2, FC4, C2, C4, CP2 and CP4. The brain interaction level from left to right hemisphere is defined as the mean DTF value from the channels in the left hemisphere to the channels in the right, and vice versa for right to left interactions. Figure 2.A shows the difference of DTF between left and right hand motor imagery (DT Flef t − DT Fright ) for four brain interaction patterns: Interhemispheric (left to right and right to left) and intra hemispheric (left and right) connectivity. The curves illustrate the mean
value across all subjects. As shown in the figure, the connectivity levels within hemispheres are highly modulated in the mu rhythm (blue and red curves), around 10-14 Hz, indicating evident disassociation between the two motor imagery tasks. In particular, the connectivity within left hemisphere is much higher in the condition of left hand motor imagery, c.f., the positive peak in red curve, and vice versa (negative peak in the blue curve). This might be due to the higher mu rhythm desynchronization in contralateral than in ipsilateral areas, which causes the lower interaction level in the left hemisphere when people are perform right hand motor imagery. The modulation of intrahemispheric connectivity disappear in the high frequency bands, > 35 Hz. The green and black curves represent the interhemispheric connectivity patterns, which are almost zero in the low frequency bands, indicating no difference between two motor imagery tasks. Differences are noticeable in high frequency bands, particularly 26-32 Hz, in which the information flow from left to right hemisphere is higher when subjects are performing left hand motor imagery (green curve), and vice versa (black curve). Figure 2.B and C represent the mean value of the curve in Figure 2.A in two selected frequency bands, 10-14 Hz and 26-32 Hz. Significant differences (Wilcoxon signed-rank test) could be found between within left and within right hemisphere interactions in the mu band. The modulation in higher frequency bands is not as obvious as the low band, however. It is also significant between two interhemispheric interactions. These results indicate that the interhemispheric, or distant, brain interactions are more modulated in high frequency bands than local connections, and motor related brain signals are originated from the contralateral brain regions.
3.2
Classification performance
10-fold cross validation was used to evaluate the offline training performance. We tested the effect of feature quantity by varying the number of selected features, from 1 to 50. Results of each subject were averaged for all testing folds. Rapid increase of AUC can be observed when the feature number is very low, i.e. below 10 feature for all the feature sets, after which the increasing trend stops and keep constant with more features, shown in Figure 2.D. This is caused by the level of redundancy between features, i.e. no more novel information is contributed by new features. In average, the PSD features show higher AUC (0.58) than the DTF method (0.57). However, the combined feature set (BOTH) yields the highest performance, which is around 0.6 after using more than 12 features. Wilcoxon signed-rank test was applied and found that below 20 features, the performance of combination is significantly better (p < 0.05) than PSD, except using 8 features, Figure 2.D.
4
Discussion & Future works
The present study verified the potential application of using DTF to decode motor imagery tasks, as well as the the modulation patterns of brain connectivity between the two tasks. Results of offline anaylsis of 9 subjects, show modulation of EEG rhythms that are consistent with previously reported results. In particular activity in higher frequency bands related to the interhemispheric interactions [4], as well as the reduced mu band in intrahemispheric patterns with contralateral sites. Further experiments will be performed to confirm the current results including online evaluation. One should notice that an essential issue of the online DTF method is the computational consumption, since heavy computation is required to obtain the coefficient matrix of the MVAR model [3], for our case 16 × 16 × 8 (8 is the order of MVAR model, determined by AIC criteria)
26−32 Hz
0.2
0.2
0.2
0.15
0.15
0.15
0.1
0.1
0.05
0.05
0
0
−0.05
−0.05
−0.1
−0.1
−0.15
−0.15
−0.2
−0.2
−0.25
−0.25
0.1 0.05 0 −0.05 −0.1 Left−>Left Left−>Right Right−>Right Right−>Left
−0.15 −0.2 −0.25 10
20 30 Frequency (Hz)
40
50
p = 0.015
C 0.25
D
0.62
p = 0.027
0.6
Area under the curve
B 0.25 DTF (left − right hand)
DTF (left − right hand)
10−14 Hz
A 0.25
0.58
0.56
p < 0.05 PSD CON BOTH
0.54
0.52 10
20
30
40
50
Feature number
Figure 2: A: The modulation of DTF during left and right hand motor imagery. B and C: Mean and variance of brain interaction patterns in two frequency ranges across subjects (B: 10-14 Hz; C: 26-32 Hz). D: Offline performance of classifying two motor imagery tasks with three types of features. Gray area show the results of statistical tests between PSD and BOTH. parameters are estimated with 1 s EEG data, and the computation should be shorter than 1/16 second, since we update the DTF feature with 16 Hz to obtain BCI control. The use of higher order models or more EEG channels will increase the time consumption. In our experiment, it took around 0.01 s to do the computation of DTF and PSD, short than 1/16 s. Furthermore, future work may try to improve the stability of DTF features by averaging MVAR coefficients in a sliding window within past 1 s EEG signal with certain overlap, as the Hanning window in Welch’s method. For online implementation, the other option could be applying dynamic updating of MVAR coefficients other than re-compute for each 1 s, as adaptive MVAR model, which might be helpful to decrease the computation [1].
References [1] M. Arnold, X.H.R. Milner, H. Witte, R. Bauer, and C. Braun. Adaptive AR modeling of nonstationary time series by means of Kalman filtering. IEEE Trans Biomed Eng, 45(5):553–562, 1998. [2] M. Billinger, C. Brunner, and G.R. M¨ uller-Putz. Single-trial connectivity estimation for classification of motor imagery data. J Neural Eng, 10(4):046006, 2013. [3] I. Daly, S.J. Nasuto, and K. Warwick. Brain computer interface control via functional connectivity dynamics. Pattern Recogn, 45(6):2123 – 2136, 2012. [4] M. Grosse-Wentrup. Understanding brain connectivity patterns during motor imagery for braincomputer interfacing. In NIPS, pages 561–568, 2008. [5] M.J. Kaminski and K.J. Blinowska. A new method of the description of the information flow in the brain structures. Biol Cybern, 65(3):203–210, 1991. [6] R. Leeb, S. Perdikis, L. Tonin, A. Biasiucci, M. Tavella, M. Creatura, A. Molina, A. Al-Khodairy, T. Carlson, and J.d.R. Mill´ an. Transferring brain-computer interfaces beyond the laboratory: Successful application control for motor-disabled users. Artif Intell Med, 59(2):121 – 132, 2013. [7] H. Ramoser, J. M¨ uller-Gerking, and G. Pfurtscheller. Optimal spatial filtering of single trial EEG during imagined hand movement. IEEE Trans Rehabil Eng, 8(4):441–446, 2000. [8] Y. Wang, B. Hong, X. Gao, and S. Gao. Phase synchrony measurement in motor cortex for classifying single-trial EEG during motor imagery. EMBC, 1:75–78, 2006. [9] J.R. Wolpaw, N. Birbaumer, D.J. McFarland, G. Pfurtscheller, and T.M. Vaughan. Brain-computer interfaces for communication and control. Clin Neurophysiol, 113(6):767–791, 2002.