David E. Patterson. Tripos Inc. 1699 South Hanley ... in the c a ~ e of vast amounts of data for positive and negative examples. ..... Ellis Hoiwood Ihited. 1994.
25-29 July, 2004 Budapest, Hungary
Towards Learning in Parallel Universes U
Michael R. Berthold Deptartnient of Computer and Information Science University of KonstanL, Fach M712, 78457 KonstanL, Germany eMail: berthold@inf .uni-konstanz .de
Abstract- Most learning algorithms operate in a clearly defined feature space and agsume that all relevant structure can he found in this one, single space. For many focal learning methods, especially the ones working on distance metrics (e.g. clustering algorithms), this poses a serious limitation. We disucss an algorithm that directly finds a set of cluster centers based on an analysis of the distribution of patterns in the local neighborhood of each potential cluster center through the use of so-called Neighborgrums. This type of cluster construction makes it feasable to find clusters in several feature spaces in parallel, effectively finding the optimal feature space for each cluster independently. Wc demonstrate how the algorithm works on an artificial data set and show its usefulness using a well-known benchmark data set.
1. INTRODUCTION Clustering has been one of the most used methods for the analysis of large data sets over the past decade [I]. Most algorithms attempt to find an optimal set of cluster centers by adjusting their position and size iteratively, through subsequent sniall adjustments of the parameters. Many variants of such algorithms exist, the most prominent example is probably Kohonen's Linear Vector Quantimtion [4]. Many variants using imprecise notions of cluster membership have also bccn proposed [ 31. Adjusting the cluster parameters iteratively (usually by mcans of a gradicnt descent proccdurc) makes much sense in the c a ~ eof vast amounts of data for positive and negative examples. Approaches that try to find cluster centers more directly have also been proposed; many exainples can be found in algorithms that train local basis function networks, such its a constructive training algorithm for Probabilistic Neural Networks 121. This algorithm iterates over the training instances and whenever it needs a new cluster to model a newly cncouniered patiern, a new cluster center is introduced at its position. Such an appiuach depends on the order of training examples and is thereforc not guaranteed to find an optimal set of cluster centers either. However, if the data set is highly skewed and the focus of the analysis aims to extract a model that explains the minority class with respect to all other examples. a more direct approach can be taken. Such data i s available in many applications, a promient example is drug discovery research where the focus lies on the identification of few promising active compounds in a vast collection of available chemical structures that mostly show no activity or are otherwise rcgardcd as useless.
0-7803-8353-2/04/$20.00 0 2004 IEEE
David E. Patterson Tripos Inc. 1699 South Hanley Road. St. Louis, MO 63 144. USA eMail: patetripos .com
In this paper we describe an algorithm that finds ai optimal set of cluster centers directly by computing so-called Neighhorgr-arm for each positive example. These neighborgrams summarize thc distribution of positive and negative examples in the vicinity of each positive example. We can thcn extract the set of best cluster centers from the set of ncighhorgrams. according to some oplimality criterion. The algorithm relies on the fact that the class of interest (the positive examples) has a reasonably small size (usually up to several thousand examples), whereas the opposing examples can be as numerous as desired. In addition we describe how this algorithm can be used to find clusters in parallel universes. This becomes enorniously useful in cases where different ways to describe entities exist. In drug discovery, for example, various ways to describe molecules are used and it is often unclear which of these descriptors arc optimal for any given task. It is therefore desirable if the clustering algorithm does not require that a certain descriptor is chosen a-priori. Clustering in parallel universes solves this problem by finding cluster centers in these different descriptors spaces, in effect parallelizing feature space selection with clustering. 11. NEIGHRORGRAMS The algorithm to find clusters directly is based on a measure that ranks so-called Neighborgrams according to a certain quality measure. Each Neighborgram summarizes the neighborhood of one positive example through a histogram of positive vs. negative examples in the neighborhood of that pattem. A neighborgrani summarizes the distribution of two' classes in a certain neighborhood of an arbitrary point in the feature space. In order to do this we need a (in this case normaiid2) distance function d : D x D [O. 11 as well as a pre-defined binning: [b;. b , f ] , 1 5 z 5 B where B indicates the number of bins and 0 5 6 , < b: 5 1 and usually (although not necessarily) b:-, = b;. Note that the binning does not need to cover the entire range of the distance function, in most cases it is even desirable to concentrate only on a small local < 1).In addition we assume that a set neighborhood (i.e. of positive and negative examples T p resp. T" exist. -----f
'Thn concept can easily be extended 10 more than two cla\se\, in this paper we coiiwain oursclves to the case of two classes for sakc of simplicity. 'If the distance function IS non-normalired the binning n e & to he adju'ted accordingly
67
FUZZ-IEEE 2004
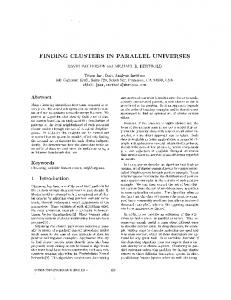
Fig. I .
Examplc Ndykborgram for a "good centroid (scc text).
A Neighborgram for a certain pattern :7: is then defined as a pair of counts for each bin:
I
NGP(2) = {.@
E
for the positive cxaniples NGy(2) =
E
1 : ht- _< d(2..G) < b:}
I
.GJ.and T7': b, 5 d(Z,.z?) < b:}l
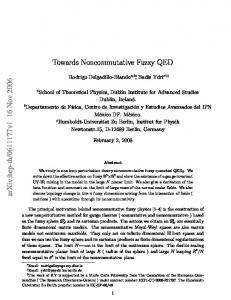
for the negative examples YR. Figure 1 shows an example of a neighborgram. The bottom part shows a two-dimensional feature space with positive (light circles) and negative examples (dark circles). The dashed circles indicate the binning of the distance function surrounding a certain paucm, choscn as centroid of a neighborgram. The top part of the figure shows the resulting neighborgram for this pattem in the center of its cluster. Note how the number of positive examples declines drastically with increasing distance while the negative exaniples behave complementary. Visually such a behavior could be used to indicate a "g~od'*cluster center. Figure 2 on the other hand shows a neighborgram for a positive pattem at the outside of the cluster. Again, the dashed circles indicate the binning of the corresponding distance function. The distribution of positive and negative example in the corresponding neighborgram indicates that the true center lies probably more in the region of the third bin in thi\ particular (artificial!) case. Neighborgrams depend on a series of parameters. Not only can we adjust the number of bins and the range of the distance function that we want to cover but in addition the bins can be distributed non-linearly. In our current implementation we offer linear, quadratic, and logarithmic distribution of an arbitrary number of bins. The underlying distance function also has an impact on the resulting distributions; for binary features we use tanimoto or hamming distances, for numeric features the Euclidean distance. 68
Fig. 2
Fkanipie Nerghborgram for a " b a r centroid (see text)
111. FINDING CLUSTBK CLNTEKS As mentioncd in the previous section, just looking at some neighborgrams suggests "good" and "bad" cluster centers. If were able to fornialize such a measure and use that to rank neighborgrams we could use the clustering algorithm shown in table I. A. Ranking Nivghhorgrains
In ordcr to choose the "best" neighborgram, a ranking procedure ic needed. The most obvious choice would be to simply count the number of positive examples that can he found in a circle around the center without encountering any negative example. The radius of this circle is: radius:zL(NG(.E))
=
1=l
and the ranking coefficient would then simply be the number of positive example within this radius: radius
sc*ret)Pst cr&JGm)
NG:m
= *=I
Obviously this ranking mechanism is very strict and already fails to assign reasonable scores to the two example neighborgrams shown in figures I and 2. We therefore relaxcd thc condition for the negative examples and use a measure that tries to lind a minimal ratio 6 of positive to negative examples instead.
1) Generate one Neighborgram €or each positive example 2 ) WHILE (enough positive examples left) DO 3) find "best" Neighborgram and determine optimal cluster size
4) remove all positive examples that are covered by the resulting cluster 5) re-compute Neighborgrams €or remaining positive examples 6 ) ENCI WHILE
where
computes the normalized accumulated positive patterns until bin j. The score for this measure computes as:
The algorithm shown in table I can easily be extended to handle different representations of the same training instance. In fact. it is more straightforward to do so using the neighborgriam-ranking based algorithm than for an iterative version. We need to only compute the neighborgrams for each positive instance in each universe:
I {GJ
NG~~(= Z] 1=l
Obviously more sophisticated measures could be used - a weighting mechanism for the distance to the centroid might make sense for some applications. or one could estimate the 95% confidence interval and find a corresponding upper (or lower) bound. In some applications it might also be more desirable to focus on large clusters instead. which would put more weight on the radius of the cluster rather than the amount of positive examples it covcfi. However, the clustering algorithm in table I using the above way to thd the best neighborgram at each step is already quite successful in finding a good set of representative cluster centers for a given data set. In the following section we will show how this method can be used to find clusters in parallel universes, an extension that is of growing interest in life science applications.
tations. These can arise because in one feature space different similarity or distance metric5 are uwd or because different ways to describe the same element exist, actually resulting in diffcrent feature spaccs altogc~hcr. In cffcct we now assume that wc have a set of univcrscs LLO, . . . , U,,,(?ti being the number of different ways to describe pattems) and for each training example. several descriptions exist. That is. each example vector Z in TJ' resp. T" can be seen as a concatention of vectors from several universes:
and
t); 5 {qz.~ G J I
Afterwards the neighborgrams are ranked, irrespective of which universe they belong to, and the hest one is chosen. We then remove all patterns covered by the resulting cluster in the corresponding universe and in addition rcmove those pattems also from all other universes. Effectively this changes only lines (3) and (4) of the algorithm shown in tablc I:
... 3')
4')
find "best" Neighborgram in any universe and determine optimal cluster size in this universe remove all positive examples in all universes that are covered by the resulting cluster
.-. Note that it is sufficient for each pattern to bc covered by one cluster in one universe. In effect, the algorithm finds the best set of clusters spread out over sevcral universes.
Iv. FINDING CJ-USTER CENTERS IN PARA1,I.EI. UNIVERSES In many applications samples can have different represen-
E TP :
V. RESULTS A. Artificial Data
In order to demonstrate how the algorithm finds clusters in the ptuallel universes, we have generated an artificial data set. About one thousand six-dimensional data points were generated, one third of which was labeled positive. The remainder was used a.. negative examples. The six dimensions were divided into three universes, each consisting of two dimensions (universe uo = (TO.X~).111 = (x2.x3j,112 = ( ~ 4 ~ x 5 )The ). positive examples exhibit three clusters: a radial distribution with mean SO = 0.1, X I = 0.4, and x2. . . . . .qexhibiting random noise. Essentially this fomis a cluster that ic only expressed in universe u g . a radial distribution with mean xi)= 0.4,.xl = 0.8, and ~ 2. .. : ~ r , exhibiting random noise. Again, this cluster is only expressed in universe 714).
.
69
FUZZ-IEEE 2004
,
00
Posnbe Examples
Negative Exampies
Dimension01
Dimension0 1
05
10
0
Postwe Exsmplar Dimension2-3
05
3.
1
Negatiw Eramptea Dhneniton2-3
= 0 3 5 7 . ~ 1= O.sU3). removing another 43 patterns. These first 3 clusters describe the underlying cluster structure nicely and subsequent clusters found by the algorithm only model artifacls of the data, as can also be seen by the drastically smaller number of patterns that are removed (12, 8, 6. ...). This example shows how the algorithm finds good candidates for cluster centers close to the optimal location at each step. Clusters that are only expressed in a part of the feature space (a universe) are extracted and then used to filter out the corresponding positive examples.
B. DNA Data In order to demonstrate thc usefulncss of this algorithm, we have used the DNA dataset from the StatLog prqject [5]. PoSnwe Examples Negative Examples This data set contains 3186 examples and the task is to Dimenston4-5 Dmension4-5 predict boundaries between exons and introns. A window of 60 nucleotides is presented as a 180-dimensional binary vector. Groups of three bits represent an amino acid and three classes are used to describe the middle point of the window as intron-extron boundary, extron-intron boundary. or non of both. 2000 randomly chosen exaniples are used for training 05 10 0 05 1 and the remaining 1186 for testing. From [SI is known that the middle portion of the window carries substantially more information than the borders. It Fig. 3. The artificial data set - split into 3 universes. Each universe contains two of the six dimciisions and the abovc plots show the distribution of thc would therefore be interesting to see if our parallel universe positive e s p . negative examples. clustering algorithm can pick out more clusters from that portion of the feature space. We have divided the 180 hinary features into three universes, each consisting of 60 bits and a radial distribution with mean xz = 0.8, .x:% = 0.2. ran the algorithm described above on the resulting training and .CO. SI. x-4. ss exhibiting random noise. This cluster patterns. A fcw observations regarding this series of cxpcriis only expressed in universe (11. mcnts arc worth noting: The negative examples have only one cluster at .TO = 0.5. the influence of the threshold H was less critical than $1 = 0.5, expressed in universe 110. Figure 3 shows the cxpcctcd. Obviously with higher H more and smaller distributions of positive and negative examples in the three clusters will be generated but the effect on generalization universes. All clusters have a radius of 0.1 and both cl~sses performance is small. are also uniformly spread out over the entire feature spaces, Since our current version only builds a model for one although with lower density, as can be seen in the plots. class. we build threc one-class classifiers. The algorithm Running the cluster algorithm will generate neighbor,c " s created clusters mostly in the second universe, representfor all positive examples in all three universes. The algoing the features 60 - 120. Specifically, for class 0, 21 rithm will then pick the neighborgram for .i?z=~04,L1=ofirst, clusters were build in universe 2, only one in universe i.e. pattern 104 in the first universe. Fi,gwrc 4 shows the I and none in universe 3 (class I: (0,18,0), class 2: neighborgrams for all 3 universes as well as the neighborgram (3.38.2)). for the entire 6-dimcnsional space. Wc used H = 80%. This Performance of those three indcpcndent classifiers is particular pattcm has coordinates not straightforward comparable to results of a threcifier. For class c1 we achieved an error rate 1. (q= 0.105, .E1 = 0.393) , class 1: 9.78% and class 2: 9.61%. which and lies close to the center of the first cluster. The best - when averaged - is roughly comparable to the rcsults radius is computed as r = 0.08, again close to the real value reported in IS]. (considering that 50 bins are used to model the distance [O. I], this estimate is off by only one bin). VI. R ~ L A T EWORK U After removing the examples covcrcd by this pattern (a total The algorithm initially wa\ derived from work on construcof 170), thc next cluster centers are: tive training algorithms for probabilistic neural networks 121 2. ( x 2 = 0.811, s:j = O.lM), which removed 104 pattems, and has strong similarities LO Neighborhood Plots 161, although neighborgrams model local behavior with respect to onc and 00
70
05
IO
0
05
1
25-29 July, 2004 Budapest, Hungary
Fig. 4. The first pick of the clustering algorithm is the Neighborgram for pattem 5 1 0 4 in universc 0. The cluster of positive examples is clearly visible. Note how the ncighborgram for pattem 510:j in universc 0 nicely displays the two positive and one negative cluster.
positive example. Neighborhood Plots visualize the averaged neighborhood behavior of the entire data set. The neighborgram clustering algorithm shares properties with Mountain Clustering [71 in that both algorithms remove patternr after a covering cluster was found. However, the local estimation of a density through an individual neighborgram reduces the computational complexity tremendously.
VII. CONCLUSIONS We have presented an approach to clustering which finds good cluster centers for local neighborhoods based on a modcl
of thc ncighborhood of each positive example. The algorithm naturally handles several feature spaces in parallcl. which offers very interesting potential in life science applications such as drug discovery. Future work will focus on better ranking inetrics for neighborgrams and integration of the neighbogram visualization technique in visual data exploration environments.
REFERENCES
[*I
Michael Berthold and David J. Hand. editon. Intrlligent Dum Amd~ An Ititroducrinn. Springer Verlag. 1999. Michael R. Berthold and Jay Diamond. Constructive training of probahilistic neural networks. Neumr;omprhig. 19:167-183, 1998. Rajesh Dave and Raghu Krishnapumni. Robust clustering methods: A unified view. IEliE Tramncriorzs of7 Fuxy Syrretns, 5(7):270-293. May
1997. [41 T. Kohonen. The Self-organiAng map. Pnxxediiig.7 qfzhr IEEE, 78: 14%. 1990. [SI D. Michie, D. J. Spiegelhaiter. and C. C. Taylor, editors. Machine Learning, Neural nnd Stntistit.al Classification. Ellis Hoiwood Ihited.
1994. [61 D.E. Patterson. R.D. Cramer. A.M. Ferguson. R.D. Clark. and LE. Weinbergen Neighborhood behavior: A useful concept for validation of molecular diversity dcsaiptors. Jourttal of Medicinal Chertikr?, 393049-3059, 1996. L71 Robert 1.' Vclthuizen, Lawrence 0.Hall, Laurence 1'. Clarke, and Maitin L.
Silbingcr. An investigation of mountain method clustering for large data se~s. Purrcm Kecognirioit. 30(,7): 1 12 1-1 135, 1997.
71