TOWARDS SELF-ADAPTABLE MONITORING FRAMEWORK FOR SELF-HEALING Javier Alonso and Jordi Torres Technical University of Catalonia Barcelona Supercomputing Center Barcelona, Spain.
[email protected],
[email protected]
Rean Griffith and Gail Kaiser Department of Computer Science, Columbia University, New York, NY, USA
[email protected],
[email protected]
Luis Moura Silva University of Coimbra CISUC, Portugal
[email protected]
Abstract
Traditionally, monitoring solutions are based on collecting a reduced set of external metrics about the system such as performance, memory consumption or response time. However, these tools are limited to detecting and diagnosing failures or errors in complex systems like application servers and grid services. New applications have embedded monitoring logic merged with business logic to better monitor and trace applications. This approach creates dependence between the "real" code and the monitoring code though, reducing the monitoring approach flexibility. Furthermore, both approaches (external or embedded monitoring) are not adaptable; they cannot change monitoring process level or precision at runtime. In this paper, we present a fine-grain monitoring framework architecture based on aspect-oriented technology. Aspect Oriented Programming offers the possibility to inject monitoring code dynamically, and even activate or deactivate monitoring code at runtime, allowing the collecting of metrics at the appropriate granularity (i.e. application level or method calls level).
Keywords:
Monitoring System, Aspect-Oriented Programming, Self-monitoring, Self-healing
2
1.
Introduction
The benefits of including effective monitoring systems which allow us to collect complex systems’ real internal state have been recognized in engineering disciplines because they help increasing availability and obtaining more robust systems. For example, the real time monitoring of bridges or buildings [2] or the health monitoring systems integrated in the aircrafts [3]. In fact, the need for including these internal and external monitoring systems is considered fundamental in order to achieve the Autonomic computing goals [1]. The autonomic computing systems are based on an autonomic manager which has to monitor the state of the system and performs the self-* tasks in agreement. Monitoring systems have to collect enough data from the monitored system to allow the human administrator or the system itself to detect or even predict failures and avoid them via recovery or preventive techniques. The merge between the monitoring system (with the capability to detect and/or predict failures) and the recovery/preventive techniques is called self-healing. However, traditionally, the monitoring tools have been focused on collecting a reduced set of external data from the system like performance, memory consumption and response time. As an example, we find several commercial and free solutions like Ganglia [5] or Nagios[6]. Both these systems allow detecting failures in our systems when the failure happens. The detection is based on rules defined by the human System Administrators following their experience. The effectiveness of these solutions is limited. These tools detect failures but they cannot predict them or even determinate where the error is. In the last years, the new applications have introduced tracing code with the objective to help the System Administrator to determinate where the error is when the failure happens. However, this approach only offers a post-mortem analysis of the root-cause failure. Moreover, these solutions aren’t portable to other applications because they’re developed ad-hoc and they require a reengineering work in order to adapt applications to obtaining tracing features. For all of this, it is needed to include monitoring systems which can collect external and internal data from complex systems at runtime to detect and even predict failures as well as to be able to integrate itself in the system without re-engineering the application or obtain the source code. It is also necessary that these monitoring systems are adaptable and flexible to allow activation or monitoring level change (from application to method level or vice versa) at runtime. This adaptability and flexibility of the framework allows to obtain a fine-grain monitoring level, achieving a more effective coverage in front of the potential anomalies of failures. In this paper we present AOP-monitoring framework based on Aspect Oriented Programming (AOP) [4] technology to achieve our below described objectives. AOP-Monitoring framework, which is presented in detail in section
Towards Self-adaptable monitoring framework for self-healing
3
3, uses AOP to wave monitoring code (we will call them, sensors) within the system code during compile or load time without the need to know how the monitored system source code is, but besides, the AOP-monitoring framework can activate or deactivate these sensors, as well as it is possible to modify the sensors’ behavior, all of this at runtime. These features offer an adaptable, flexible and portable monitoring system with an acceptable overhead. The rest of the paper follows as section 2 presents Aspect Oriented programming and solutions based on this technology in the area of and present the Aspect-Oriented programming paradigm. Section 3 presents our proposal architecture. Section 3.1 presents our approach’s overhead and section 4 concludes this paper and presents the next to-do steps.
2.
Aspect Oriented Programming
In this section we present the Aspect Oriented Programming technology. Furthermore, we present a brief set of solutions based on AOP in the selfhealing and monitoring research area.
2.1
Aspect Oriented Programming
It is out of scope of this paper to present the Aspect Oriented programming technology in detail, though necessary to introduce a brief description of the technology to make clearer the solution presented in this paper. AOP attempts to aid programmers in the separation of concerns, specifically cross-cutting concerns offering a new level of modularization. Aspects is the name of the main concept of the AOP technology. The Aspects are composed by two elements: Advices and Join Points. The Advices are the code that is executed when the aspect is invoked: the Advice has access to the class, methods and/or fields of the module which the advice invokes. The Join point is the definition to indicate when the advice will be invoked. We can see the Join point like a trigger: when the condition is true the Advice is invoked. For this technology’s implementation, we have chosen AspectJ [7] because it is a well-known widely used and mature technology developed by the eclipse IDE [8]. In addition, this technology offers a simple and powerful definition of Aspects like Java class, so the learning curve is quite quick for experienced Java developers.
2.2
AOP Self-healing and Self-monitoring solutions
The use of Aspect Oriented programming in the self-healing area is not a new approach. There are several papers where authors present different self-healing architectures based on AOP power to introduce self-healing techniques, like a cross-cutting concern inside the business logic from applications
4 [9–11]. All of these papers present different recovery systems based on an Aspect Oriented paradigm. However, they don’t take into account the monitoring process to determine the exact correct moment to apply the recovery actions. On the other hand, the use of Aspect Oriented programming in the area of self-monitoring is hardly an explored solution. Currently, the most mature solution in this area could be Glassbox [12]. This monitoring framework is based only on our application’s performance monitoring using AspectJ. Although Glassbox is an static powerful monitoring framework and even exploits the power of Aspect Oriented programming to allow a fine-grain monitoring level, Glassbox doesn’t offer the possibility to change the monitoring level at real time. Also, we can find some works in the area of operating systems like TOSKANA [16]. TOSKANA provides before, after and around advice for kernel functions and supports the definition of pointcuts as well as the implementation of aspects.
3.
Fine-grain Monitoring Framework Architecture
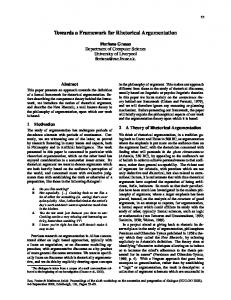
In this section we present the fine-grain monitoring framework architecture called AOP-Monitoring framework. We have designed an architecture based on a modification of a health monitoring architecture defined in [13]. Figure 1 shows a simplification of the architecture of our framework. AOP-Monitoring Framework is composed by two main modules: Sensors and the Monitor Manager. The sensors are entrusted to collect data from the system. They are Aspects, which are injected in the code via AspectJ tools. There is one sensor for every data or event that we want to monitor. We can define sensors at different monitoring levels. For example; when a method is called, when a constructor is invoked, before one object is initialized, when a class’ field is assigned or even when an exception handler is executed. When the sensor collects enough data (defined by the Monitor manager), this data is sent to the Monitor Manager to be analyzed and to take decisions about the system.
Figure 1.
Basic Architecture of AOP Monitoring Framework
Towards Self-adaptable monitoring framework for self-healing
5
The Monitor Manager has the responsibility to recollect all the data from all the active sensors and determine the policy to follow. The monitor manager allows failure prediction by using data mining or forecasting methods using the sensor collected data. If the prediction methods need more data from the system or a low level monitoring, the Monitor Manager can activate new sensors and deactivate others to obtain these data to accurately determine if there will be a failure or an error. Furthermore, the Monitor Manager can change the sensors’ behavior, i.e. It is possible to redefine the sensor’s elapse time in between collecting data. This offers a great flexibility and adaptability and reduces the overhead when the system behavior seems correct and allows to expand the monitoring level according to the situation when it is needed. In figure 2, we present a detail of a sensor architecture. We have two components to build a sensor. We have the real sensor (an advice defined using AspectJ) and a Sensor Manager Proxy. The Sensor Manager Proxy has the task to communicate with the Monitor Manager. The Sensor Manager Proxy can activate or deactivate the sensor, it can also change the time between monitoring tasks and has to send the data to the Monitor Manager, as well as receive new orders from the Monitor Manager to then act accordingly.
Figure 2.
3.1
Detailed Architecture of a Sensor
AOP-Monitoring Framework Overhead
This monitoring framework is still under development. Currently, we have a first version of the framework without data mining or forecasting methods. Moreover, we have developed two sensors at the moment. These sensors monitor the memory consumption and the CPU status. The capability to activate or deactivate a sensor is developed and the possibility to change the time between monitoring tasks is developed too. However, it is needed continue the development to demonstrate the effectiveness of our solution to detect early failures or error and demonstrate the coverage of our solution according to the type of error or failure. However, an important point has to be evaluated before to continue developing the solution: the overhead of this approach. If the overhead is too high using this simple version of the framework, the approach would be useless for our main goals. We have evaluated the overhead of this solution running a very simplistic web application over a Tomcat Server 5.5.20 [14]. We have injected
6 our two sensors in every method call in the core of Tomcat Server. We have weaved the sensors within Bootstrap, Catalina and Commons-daemon jar files. Before every method call in every Tomcat Thread the sensors collect data from the server every 5 seconds and send data to the Monitor Manager, via Monitor Manager Proxy, every 15 seconds.
3.1.1 Experiment environment. The client workload for the experiments was generated using a workload generator and web performance measurement tool called Httperf [15]. The configuration parameters of the benchmarking tool used for the experiments presented in this paper were set to create a realistic workload. We consider that a simple workload requesting static web content is enough to demonstrate the overhead of our approach, because we are monitoring the Tomcat Server, not the application over it. We have configured Httperf setting the client timeout value to 10 seconds. Tomcat runs on a 4-way Intel XEON 1.4 GHz with 2 GB RAM. We have also a 2-way Intel XEON 2.4 GHz with 2 GB RAM running the workload generator. Two machines run the 2.6.8.1 Linux kernel with Sun JVM 1.4.2, which are connected through a 1 Gbps Ethernet interface. 3.1.2 Experiment results. Figure 3 presents the overhead obtained using different request rate (number of new requests per second). To obtain this curve we have used https connections because is well-know that this type of connections overload Tomcat server at determinate point (in this case when the rate is around 25 new requests/second). We can observe that deviation performance is evident when the curve achieves the maximum value (around 25 new clients per second). In the rest of the curve we can observe that the results are quite the same.
Figure 3.
Throughput obtained from Tomcat with and without AOP-Monitoring Framework
If we observe the table 1, we can observe that the overhead introduced in the maximum point is around 6%. On the other hand, we can observe that the response time increase around the 16%, 12 ms. This value has to be improved, however we can observe that the value increased (12ms) is quite imperceptible in the web applications.
Towards Self-adaptable monitoring framework for self-healing Table 1.
7
Detailed results when the request rate is 25 requests/sec
Environment Tomcat Original Tomcat + AOP Framework
Avg. Throughput
Avg. Respon. Time
422 req/sec 395,7 req/sec
84,2 ms 98,4 ms
Overhead 6,2% 16%(12ms)
We can conclude that our solution has promising future because the overhead is reduced when we monitor every call method every 5 seconds, and with an heavy workload in this scenario. However, we have to continue working to avoid introducing an important overhead, which could provoke that the solution will be useless for our objectives.
4.
Conclusion and Future work
In this paper, we have presented a work in progress fine-grain monitoring framework. The architecture presented is focused on offering a flexible and adaptable fine-grain monitoring framework, which can collect a big set of internal and external metrics to predict offer early detection for potential failures or errors. The architecture presented allows to activate or deactivate sensors and change the behavior of sensors at runtime, changing the level of monitoring when it is needed to obtain more fine-grain data from the system. These capabilities have to offer a better coverage of errors and failures than the traditional external monitoring systems. In our opinion, our approach could offer a great failure coverage thanks of the possibility to change the level of monitoring. This feature could be very useful in conjunction with self-healing techniques. For example, if we will merge self-healing techniques like [10]or [11]with a mature solution of our approach we could achieve a powerful self-healing system because, we could apply the recovery action in the correct moment improving the benefits of these self-healing solutions. However, this framework is under development yet. Next steps is to develop new sensors to obtain more data from the server like sensors to handle potential exceptions at server and application levels. After that, it is needed to develop new experiments to demonstrate the effectiveness of our approach to offer early detection failures and measure the coverage of the framework according to the failures or errors. Of course, the overhead has to be evaluated again when the systems will be mature to measure better the overhead introduced for AOPMonitoring framework as well as how many overhead introduce or reduce the fact of activate or deactivate or change the behavior of sensors. Last step will be the introduction of machine learning algorithms or forecasting methods, which can predict failures in advance using the metrics ob-
8 tained from the server. It is important this point to define the policies applied by the Monitor Manager, activating or deactivating sensors according to the needed of forecasting or machine learning methods.
Acknowledgments This research work is supported by the FP6 Network of Excellence CoreGRID funded by the European Commission (Contract IST-2002-004265), the Ministry of Science and Technology of Spain under contract TIN2007-60625 and The Programming Systems Laboratory which is funded in part by NSF grants CNS-0717544, CNS-0627473, CNS-0426623 and EIA-0202063, NIH grant 1U54CA121852-01A1, and Consolidated Edison Company of New York.
References [1] Jeffrey O. Kephart and David M. Chess. The vision of Autonomic Computing. In Computer,v.36 n.1, p.41-50, January 2003. [2] H. Sohn et at. A review of Structural Health monitoring literature: 1996-2001. Los Alamos National Laboratory Report, LA-13976-MS, 2003. [3] R. Muldoon, J. Gill, L. Brock. Integrated Mechanical Diagnostic (IMD) Health and Usage Monitoring Systems (HUMS): An Open System Implementation Case Study. Proc. 18th IEEE Digital Avionics System Conference, pp. 9.B.4.1-8, Oct. 1999. [4] G. Kiczales at al. Aspect Oriented Programming. Lecture Notes in Computer Science, Vol. 1241, pp.220-242, Springer 1997. [5] [web-site at April 2008] http://ganglia.info/ [6] [web-site at April 2008] http://www.nagios.org/ [7] G. Kiczales at al. An Overview of AspectJ. Proc. European Conference for ObjectOriented Programming(ECOOP 2001). Lecture notes in Computer Science, Vol. 2072, pp. 626-657, 2001. [8] [web-site at April 2008] http://www.eclipse.org/aspectj [9] Stelios Sidiroglou, Oren Laadan, Angelos D. Keromytis, and Jason Nieh. Using Rescue Points to Navigate Software Recovery (Short Paper). In Proceedings of the IEEE Symposium on Security and Privacy, May 2007. [10] R. Griffith and G. Kaiser. Adding self-healing capabilities to the common language runtime. Technical report, Columbia University, 2005. [11] L. Baresi, S. Guinea and L. Pasquale. Self-healing BPEL Processes with Dynamo an dthe JBoss Rule Engine. Int. workshop on Engineering of software services for pervasive environments, pp. 11-20, 2007. [12] [web-site at April 2008] http://www.glassbox.com/glassbox/Home.html [13] Alexander Lau and Rudolph E. Seviora. Design Patterns for Software Health Monitoring. Proceedings of the Tenth International Conference Engineering of Complex Computer Systems (ICECCS),IEEE, 2005, pp. 467-476. [14] The Apache Jakarta Tomcat 5 Servlet/JSP Container. http://tomcat.apache.org/[web-site at April 2008]
Towards Self-adaptable monitoring framework for self-healing
9
[15] D. Mosberger and T. Jin. httperf: A Tool for Measuring Web Server Performance. Workshop on Internet Server Performance, pp.59-67. WI-USA. June 98. [16] Michael Engel , Bernd Freisleben. Supporting autonomic computing functionality via dynamic operating system kernel aspects. Proceedings of the 4th international conference on Aspect-oriented software development, p.51-62, March 14-18, 2005, Chicago, Illinois