Mar 13, 2009 - algorithm for four interaction styles ('alone', 'interacting',. 'carrying' and ... I(X;Y) stands for the mutual information4 between X and. Y. For {3 and the .... 3) Postprocessing: The postprocessing relies on a 'winner takes all' ...
th
2008 8 IEEE-RAS International Conference on Humanoid Robots December 1- 3, 2008/ Daejeon, Korea
WP1-8
Towards Socially Adaptive Robots: A Novel Method for Real Time Recognition of Human-Robot Interaction Styles Dorothee
Fran~ois
1,
Daniel Polani
1,
Kerstin Dautenhahn
1
Adaptive Systems Research Group Department of Computer Science University of Hertfordshire Hatfield ALlO 9AB, UK {d. francois, d.polani, k.dautenhahn }@herts.ac.uk 1
Abstract-Automatically detecting different styles of play in human-robot interaction is a key challenge towards adaptive robots, i.e. robots that are able to regulate the interactions and adapt to different interaction styles of the robot users. In this paper we present a novel algorithm for pattern recognition in human-robot interaction, the Cascaded Information Bottleneck Method. We apply it to real-time autonomous recognition of human-robot interaction styles. This method uses an information theoretic approach and enables to progressively extract relevant information from time series. It relies on a cascade of bottlenecks, the bottlenecks being trained one after the other according to the existing Agglomerative Information Bottleneck Algorithm. We show that a structure for the bottleneck states along the cascade emerges and we introduce a measure to extrapolate unseen data. We apply this method to real-time recognition of Human-Robot Interaction Styles by a robot in a detailed case study. The algorithm has been implemented for real interactions between humans and a real robot. We demonstrate that the algorithm, which is designed to operate real time, is capable of classifying interaction styles, with a good accuracy and a very acceptable delay. Our future work will evaluate this method in scenarios on robot-assisted therapy for children with autism. Index Terms-Socially interactive robots, socially adaptive robots, pattern recognition, human-robot interaction, robotassisted play
I. INTRODUCTION This study is part of the Aurora project [1], an ongoing long-term project investigating the potential use of robots as a therapeutic toy for children with autism. One main stream of this project focuses on developing methods enabling the robot to analyze in real time the interaction styles and adapt its own behaviour appropriately with respect to a child's specific needs and abilities 1• This paper presents a novel method for time series analysis, the Cascaded Information Bottleneck Method, which we apply to the real-time recognition of human-robot interaction styles. This method, which enables time-filtering, is based on the concept of Information as introduced by Shannon [2] and builds upon from the "Information Bottleneck Method" developed by 1We consider the child's abilities as they are expressed through interaction with the robot, resulting in different play styles.
Tishby et al. in [3]. Importantly, this work goes beyond prior work that either classified and characterized interactions off-line, i.e. after the interactions had taken place, or relied on explicit criteria tuned by hand (vs. automated training phase of the recognition algorithm). It also goes beyond previous work of the authors which enabled real-time recognition of interaction styles with respect to one criterion, the gentleness, using a different method, based on self-organizing maps [4]. The Cascaded Information Bottleneck Method is entirely generic for applications with socially interactive robots; in particular, it can be applied to humanoid-human interaction. The remainder of the paper is structured as follows. Section II introduces related work. Section III summarizes some background on the Information Bottleneck Method developed by Tishby et al. in [3]. Section IV presents the Cascaded Information Bottleneck Method. The application to the recognition of Human-Robot Interaction Styles is explained in the two following sections, with details on the implementation and description of the trials in Section V and presentation of the results in Section VI. Section VII discusses the results and future work. Conclusion closes the paper (Section VIII). II. RELATED WORK The role of tactile human-robot interaction in educational and therapeutic applications has been well highlighted by longterm studies with the seal robot Paro which have proven that specific everyday life situations exist in which human-robot interaction can have a positive effect on the well-being of human beings [5] and even playa role in a therapeutic context of cognitive and physical rehabilitation [6]. The Huggable robot, a teddy-bear like robot, equipped with a full body sense of touch, has proven to be a promising support to investigate the quantitative characterisation of the social affective content of touch [7]. Offline characterisation of interaction styles in general, moreover, has been investigated recently with diverse approaches. In [8], Scassellati focused on providing quantitative and objective measurements to assist in the diagnosis of autism. Measurements refer to the position in the room, vocal
978-1-4244-2822-9/08/$25.00 ©2008 IEEE
Authorized licensed use limited to: UNIVERSITY OF HERTFORDSHIRE. Downloaded on March 13, 2009 at 07:58 from IEEE Xplore. Restrictions apply.
353
prosody and gaze pattern - whose characterisation relies on linear discriminant analysis which is a clustering technique used for linearly separable data. Kanda et al. conducted a study [9] that highlighted the feasibility to link quantitative robot's and human's data characterizing body movements with a subjective evaluation made by the participant. Later, in [10] Salter et al. showed the possibility, in the context of child-robot interaction, to reflect some traits of personality of the children with an offline clustering technique based on the empirical probability distribution of the activation of the sensors. Concerning real-time classification of interaction styles, in [11], Salter et al. have presented a real-time simple recognition algorithm for four interaction styles ('alone', 'interacting', 'carrying' and 'spinning') using the robotic platform Roball. The algorithm is based on a decision tree whose conditions are set up manually, by visual inspection of sensor data. In [12], Derakhshan et al. present an interesting real-time classification algorithm of interaction styles for children playing on an adaptive playground that is made of tiles equipped with sensors. The algorithm relies on a multi-agent system approach of BDI (Belief-Desire-Intention) in combination with neural networks using supervised learning. It shall be further noted that in the slightly different context of gesture recognition, Hidden Markov Models (HMMs) have been largely used for real-time recognition [13]. An HMM is defined by its number of hidden states and the two following probability matrices: the transition matrix, describing the conditional probabilities, given the state S at time step t, to be in the state Sf at time t + 1, and the emission matrix, defining the conditional probability of emitting a signal 0, given the state S. Those matrices are static, i.e. for a given HMM, those values are fixed in time. Classifying an observation with HMMs consists in finding, among all the different HMMs 2 the one which has the highest probability of emitting this observation [14]. III. BACKGROUND: THE INFORMATION BOTTLENECK METHOD
The Information Bottleneck Method [3] is a clustering method based on an information theoretic approach [2] whose purpose is to extract the relevant information3 in a signal x E X that is, extract features of a random variable (r.v.) X that are relevant to the prediction of Y. This problem is modeled by the following Bayesian network with Markov condition: X ~ X ~ Y where X is the variable that extracts information about Y through X. This method provides an alternative to 'rate distortion theory' techniques which constitute a standard analysis of lossy source compression. In the Information Bottleneck method, the relevance is not addressed through distortion but directly through a new variational principle. The rationale is that the best trade-off between the compression of the signal and the preservation of the relevant information is the one that keeps a fixed amount of relevant information about the relevant signal 20 ne HMM per class to distinguish. 3In this context, the relevant information is defined as the information that the signal x E X provides about another signal y E Y.
Y while minimizing the number of bits from the original signal X, i.e. maximizing the compression. The optimal assignment can be found by minimizing the functional
£[P(xlx)] = I(X;X) - (3I(X;Y)
(1)
I(X;Y) stands for the mutual information4 between X and
Y. For {3 and the cardinal of X fixed, an expression can be
given which specifies implicitly the solution and leads to a fixed point iteration. (3 can be considered as the inverse of the temperature. This method uses a stochastic clustering topdown approach. The notion of stochastic refers to the fact that the clustering is soft and that the input data are mapped to the different elements of X with a particular probability. For that information bottleneck setting, the Kullback-Leibler divergence DKL[P(ylx)lp(ylx)] replaces the distortion function. The Agglomerative Information Bottleneck algorithm [1 7] makes the assumption that f3 is 00 in the Lagrangian equation (1). It maximizes the mutual information between X and Y and induces a hard partition of the data : for a fixed cardinal of X (i.e. a fixed number of subsets - also called states - in the bottleneck), each member of the input signal x E X belongs to one and only one subset x E X and x is the subset (the state) for which p(ylx) has the smallest D KL [P(ylx)/Ip(ylx)]. The hard partition can be soften afterwards, with reverse annealing. The pseudo-code of the algorithm can be found in [17].
IV. THE CASCADED INFORMATION BOTTLENECK METHOD
A. The principle Based on the Information Bottleneck Method, we have developed a novel time-filtering method particularly adapted for pattern recognition in time series. Let x E X be the time series input signal of length I, x = [xo, ... , Xl-I]. We take k and SEN, with I k * S, such that x can be divided into S disjoined parts of cardinality k, x s , s = 0, ... , (8 - 1) in the following way: Xo
...
Xk-l
Xk
...
X2k-l
The Cascaded Information Bottleneck method relies on the principle that the relevant information can be progressively extracted from the time series with a cascade of successive bottlenecks sharing the same cardinality of bottleneck states but trained independently. The agglomerative information bottleneck algorithm is applied to each bottleneck successively, the first one being trained in the standard way while the next ones depend on the previous bottleneck states, as the following graph shows: 4for more details on the notion of mutual information, please refer to [15], [16]
354
Authorized licensed use limited to: UNIVERSITY OF HERTFORDSHIRE. Downloaded on March 13, 2009 at 07:58 from IEEE Xplore. Restrictions apply.
y
xo~/----
11
step s is given by:
. __
,;'re~:..-
-
······"'x2
\ Xo ~XI \
\ ~X2
~
XS-
R(s - 1, s)
"
1
V.
s)(r)=-
Lx
ApPLICATION TO THE RECOGNITION OF
HUMAN-ROBOT INTERACTION STYLES: EXPERIMENTS
The Cascaded Information Bottleneck method progressively extracts the relevant information from an input sample X == [X0, ... , X s -1] by a recall on the suc~essive components (X0 for the first step of the cascade, (Xs-I, X s ) for the other steps s). Each bottlen~ck is characterized by a har~ mapping between: i) X o and X o for the first step, and ii) (Xs-I, X s ) and Xs for the other steps of the cascade. At each step s of the cascade, the algorithm looks for the equivalent xs given the input (x s-1, X s) according to the hard mapping at step s (the equivalent Xs satisfies the equation p(xsl(xs-I, x s )) == 1). It can happen that at a specific step s of the cascade, t~e pair (xs-I, x s ) for which we need to find the equivalent X s has never been encountered during the training process of this bottleneck. This pair is called an unseen pair. In the case of an unseen pair (xs- I, X s) at step s, the cascade can a priori make no inference on Xs because there is no preexisting default continuation of the cascade, due to the fact that the bottlenecks have been trained independently. In other words, for each pair (xs-I, x s ) which was not part of the training set data, p(xsl(xs-I,x s )) is a priori undefined, whatever Xs we take. For such cases, it is necessary to introduce a 'default' way leading from X s - 1 to Xs , i.e. we have to introduce an artificial identification of the bottleneck states which consists in matching out two bottleneck states (one at step s - 1 and one at step s). Therefore we apply a reorganisation of the bottleneck states at each possible step s (i.e. a oneto-one mapping of the bottleneck states at step s - 1 and the ones at step s which we call a permutation). For this purpose, we introduce the following measure d(s-l,s) allowing to directly compare the reorganised bottl~neck states from step s with those from step s - 1. Let Xs - 1 (respectively Xs) be the set of bottleneck states Xs-l (respectively xs) and P(Xs-l) (respectively p(x s ) the empiricC!,1 probability; for each permutation r of the bottleneck states X s : ,
(3)
We consider R(s - 1, s) as the 'default' path between Xs - 1 and Xs , i.e. as the criteria for extrapolating an unseen event at step s.
B. Extrapolation
d(S-l
== argminrd(s_l,s)(r)
s-l
EX
s-l
P(X s -1) logp(Xs=r(Xs-1)\Xs-1=Xs-1)
(2)
Note that if the conditional probability p(Xs r(xs-I)IXs- I = Xs-I) = 0 then, by convention, d(s-I,s) (r) is 00. The logarithm measures the ~npredictability of the next case (i.e. the unpredictability of X s given Xs-l). We want to choose r to minimize that unpredictability and weight for the probability that the state XS-l actually happens (because there is no sense in penalizing a deviation if the state does not happen.). We call this permutation R(s - 1, s). The permutation of the bottleneck states that extracts the most similarity between bottleneck states at step s - 1 and those at
In this section we present an application of the Cascaded Information Bottleneck Method with real data: the automatic recognition of tactile interaction styles in the context of human-robot interaction. We conducted two series of trials, the first one under laboratory conditions and the second one in a school where several children could interact (one child at a time) freely with the robot. In all experiments the robot is the Sony Aibo and we focus on characterizing the tactile interactions according to two criteria, namely the gentleness and the frequency ofthe interaction. An interaction is classified as 'gentle' (respectively 'strong') if the participant strokes the robot gently, without signs of force (respectively with signs of force). The frequency of interaction is categorized into four classes 8 i , i == 0...3, defined by their typical periodicity of interactionS T (in seconds): i) 8 0 : 'very low' (T > 15 seconds), ii) 8 1 : 'middle inferior' (5 < T ::; 15), iii) 8 2 : 'middle superior' (1 < T ~ 5), and iv) 8 3 : 'very high' (T ::; 1 second). A. Implementation 1) Preprocessing: Each criterion (gentleness and frequency of the interaction) is studied independently. In each case, the time series studied is the quantitatively binned sum of the normalized sensors values 6 involved in the type of interaction.
2) Extra-conditions for the training: a) for the criterion 'gentleness', the algorithm does not learn null samples (i.e. samples made of null events only), b) for the frequency of interaction, the system deals only with samples whose first component is not null. In both cases, a sliding window proceeds on the sensor data time series. 3) Postprocessing: The postprocessing relies on a 'winner takes all' principle: The selected (winner state) is defined by argmaxyEY p(yIXS-l). B. Features of the trained cascade
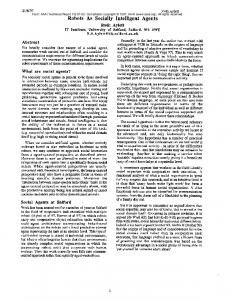
The mutual information is 0.8 bit for the criteria gentle/strong and 1.9 bits for th~ freq~ency of the interaction. The conditional entropy H(Xs+1IX s ) (Fig. 1) is globally decreasing over the cascade, pretty quickly, which suggests that a structure is progressively and rapidly eme~ging ~ver the cascade. For the frequency of interaction, H(Xs+1IX s ) has some small local peaks though, both at the very beginning 5The typical periodicity represents the elapsed time between two successive strokes of the robot. 6The robot's sensor data are updated every 32ms.
355
Authorized licensed use limited to: UNIVERSITY OF HERTFORDSHIRE. Downloaded on March 13, 2009 at 07:58 from IEEE Xplore. Restrictions apply.
Gentle/Strong :
6:
~
i:.-
study deliberately focuses on such different criteria in order to show the flexibility of the algorithm. 1) Experimental setup under laboratory conditions: These trials are used as a first step in the statistical assessment of the soundness of the recognition of the interaction styles. They involve one participant at a time who is asked to interact with the robot for a few minutes in a predefined wa.v which is one of the following: • for the 'frequency of the interaction': only 'pure styles of interaction', i.e. one class8 exclusively.
1.4
1.2 1
~ ~ ~:: -::: 0.4 :.a 0.2
~ U
0 0
20
40
60
80
100
120
140
160
180
position s of the bottleneck in the cascade
200
220
240
Fig. 1. Conditional entropy H(Xs+IIX s ). There are four main parameters for the cascade: l (length of the input vector), k (length of the individual subsequences), S (length of the cascade ), m (number of bottleneck states). For the frequency of interaction, l ::::: 472 (equivalent to 15.1 seconds) , k ::::: 2, S ::::: 236, and m ::::: 6. For the criterion gentle/strong, the corresponding parameters are: l ::::: 50 (1.6 seconds), k ::::: 2, S ::::: 25 and m ::::: 4.
of the cascade and at the very end7, which suggest that at these steps s, the input data X s may influence a bit more in the choice of next equivalent state Xs+ 1. This measure is correlated with the reorganisation measure for extrapolating ds-1,s(R(s - 1, s)) (equation (2) and equation (3» which presents, respectively to each criterion of interaction, profiles similar to the conditional entropy with peaks positioned at the same place in the cascade (the mean of ds-1,s(R(s - 1, s)) is equal to, respectively, for Gentle/Strong, 0.037 bits, and, for the frequency of interaction 0.129 bits). In this study, the algorithm will extrapolate between step 5 and 24 (respectively 5 and 216) of the cascade for the gentleness (respectively frequency of interaction).
C. Experiments The experiments aim at assessing statistically: a) the soundness of the recognition of interaction styles by our algorithm, i.e.: i) for the criterion 'gentleness', whether a behaviour that has been classified as gentle (respectively strong) by a human is indeed going to be classified as gentle (respectively strong) by our algorithm, ii) for the frequency of interaction, whether a frequency of interaction that has been tagged by a human is indeed going to be correctly recognised by the algorithm. b) the delay for the recognition of local events (i.e. short-term time scale events). Importantly, the criterion 'gentle/strong' characterizes local events, and the algorithm should be able to recognise each specific event 'gentle' or 'strong' within a short delay. In contrast, the criterion 'frequency of the interaction' requires the algorithm to classify mid-term time scale events. This 7Note that the small local peaks at the end of the cascade may reflect the importance of the last steps for distinguishing the classes So and Sl.
for the criterion 'Gentle/Strong': In a first step, It IS pure styles exclusively9. In a second step, the participant is asked to alternate gentle and strong behaviour and, just before generating the first event of the new class, he/she must name the style (i.e. "gentle" or "strong"). All the sessions are video recorded and this tagging enables to determine very precisely the transitions for a further measure of the delay of the recognition process.
2) Experimental setup in school: A further step in the validation of the algorithm is the testing with data· obtained under natural situations of Human-Robot interaction. These experiments took place in a small classroom dedicated to the study, one child at a time being present in the room. Each child was invited to play freely for several minutes with the robot (the duration of play depended on the child's needs and abilities) in an unconstrained environment. D. Measures The experiments were all video-recorded and sensor data were stored. Note that the validation of the algorithm must be assessed offline but the recognition algorithm is designed to operate real time. 1) Samples excluding transitions from one class to another: The profile of the classification by the algorithm can be analysed with a confusion matrix which displays the probability distribution that events from class Si are recognised by the algorithm as events of class S~ (i == 0 or 1 for gentle/strong, i == 0...3 for the frequency of interaction). 2) Samples with transitionsfor the criterion gentle/strong: These samples enable us to test the ability of the algorithm to recognise a transition and reach, after a short transition phase, a new equilibrium phase. One can model this process by a temporal curve that would indicate the state of the system for a transition happening at time to. Three typical domains can be identified: for t < to the curve is constant, indicating a stable state; from t == to, the curve's value alternates to indicate an hesitation between the two possible states (thus identifying a change in the behaviour observed); from t == to + T the curve would keep the same value (the new state). Ideally, the second phase should be very short (i.e. T is very small). We will study three typical measures here: a) the number of transitions recognised by the algorithm; b) the time elapsed to 8 very
low, middle inferior, middle superior, or very high. or strong only.
9 gentle
356
Authorized licensed use limited to: UNIVERSITY OF HERTFORDSHIRE. Downloaded on March 13, 2009 at 07:58 from IEEE Xplore. Restrictions apply.
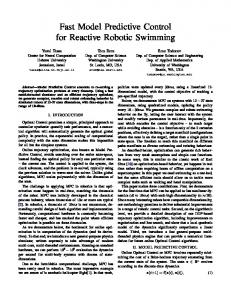
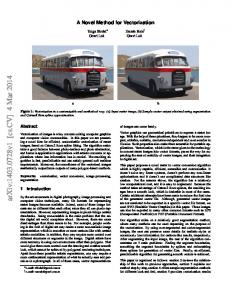
reach the new equilibrium state, c) the ratio of errors made samples to classify and 0.01 % of the samples were not classiwithin this new equilibrium state. Note that a transition will fied because they could not be extrapolated by the algorithm 10. be considered broadly as either a transition from a gentle 212 transitions were to be recognised, 99.1 % of which were (respectively strong) behaviour to a strong (respectively gentle) indeed well classified by the algorithm 11 with an average delay one, or from a state where no classification occurred (i.e. no of 0.17 seconds. The cumulative probability distribution of the interaction occurred during the past 1.6 seconds) to gentle or delay is displayed in Fig. 2. The curve grows very rapidly, thus strong. showing that most of the delays are very small. Transitions 3) Samples with hybrid behaviours for the frequency of recognised without any delay occur particularly in the case of interaction: Because this criterion is based on a mid-term a transition from no event to classify to any event to classify. time scale analysis, some samples generated in school can be The longest delay is 2.05 seconds, which we consider very hybrid, i.e. contain a mix of features from different classes. In acceptable for human-robot interaction kinesics. The average order to encapsulate hybrid behaviours, the human classifies error ratio in the equilibrium phase is 0.02 and the cumulative the behaviours on a 'two choices' basis, i.e. he/she can select probability distribution is displayed in Fig. 3. Here again, the the two styles characterising the hybridity. In this case, the curve grows rapidly and shows that the probability of the algorithm's classification is successful if it agrees with one of highest error ratio is very low and remains acceptable for real human-robot interaction. the two choices made by visual inspection. Practically, the video and graphs of the temporal global Cumulative probability distribution variable are first manually tagged. In a second step, the clasof the delay to reach a new equilibrium phase sifications Si resulting from the manual tagging are compared ~ 0.81 -r :$ with the classifications S~ made by the algorithm. .c
~~~iii~~~~=!:::::::=====~
VI. ApPLICATION TO THE RECOGNITION OF
e 0.6 ~~""'"'-"""""'--""'-""""""'-'---""""---------i =-~ 0.4 M~~~~~~~~~~~--~=====:;1 ~ 0.2 W~_~':"':""~~~.l-~~ __-J"'l-lal~~raltory~ond~ltIOr~
HUMAN-ROBOT INTERACTION STYLES: RESULTS
"3 8
We present the results for each criterion (gentleness and frequency of the interaction) successively. Note that here we will refer to the samples of data that were classified without using the extrapolation, i.e. the samples that contained no unseen cases at any step of the cascade, as samples classified without extrapolation. In contrast, the samples of data that required an extrapolation at one or more steps of the cascade, i.e. the samples for which there were unseen cases to extrapolate (i.e. cases that had not been encountered during the training phase of the algorithm), will be referred to as samples class(fied lvith extrapolation.
S
A. Criterion: Gentle/Strong J) Training set of data: The 20,018 samples used for the training were classified by the algorithm with an overall success of 97.82% and, respectively, for gentle and strong, 96.83% and 98.81 %.
2) Samples excluding transitions (cross-validation): They constitute 1 hour 2 minutes 49 seconds of interaction. 100,111 samples have been classified with a ratio of success for correct classification of 0.948. 97.7% of samples were classified without extrapolation with 95.22% of success while the samples classified with extrapolation (3.3%) were well classified in 75.54% of cases which, considering that it results from an extrapolation, is quite a good result. Note that the parameters of the Cascaded Information Bottleneck Method were chosen in such a way to have a good balance between the extrapolation and the precision, which is reflected here in the low percentage of cases extrapolated. 3) Samples with transitions under laboratory conditions (cross-validation): The four runs constitute 19 minutes and 40 seconds of interaction to analyse. They contain 53,192
0
~';""';-;":";"'--4"""""~--'-T-~--;';""-""";";''''''':''''-'''--'''''-~'-=l=-=ollIj====;=O==;==-=P:=-1
0 0.10.20.30.4 0.50.60.70.80.9 I 1.1 1.2 1.3 1.4 1.5 1.61.7 1.8 1.9 2 2.
delay in seconds
Fig. 2. Cumulative probability distribution of the delay for recognising the transition. We display the probability that an event is recognised within (less or equal) n seconds for a given n. The delay corresponds to the length of the transition phase when a transition occurs.
Cumulative probability distribution of the error ratio in the equilibrium phase
~
1'---:--::;;~~"""'~='::FIilIIIIIJII""~~---+-~
~ 0.8 --+---..,....~~~-~~ .c
e 0.6 =-
-+-:J~F--"""""'''''''''''''''''''''"-,,,-,'''''''''''
0.4 ir..,...--...-----:"-~~___;::=:=;:::::;:=:;:::::;::==:::l ~ 0.2 -l4~"'_"O------~~"'""""!'"'l ~ 0 ~___,.-~-~-~--..;..~=;:::=::r=====;:=:::::;=~ u o 0.05 0.1 0.15 0.2 0.25 0.3 0.35 0.4 0.45 0.5 .~
error ratio
Fig. 3. Cumulative probability distribution of the error ratio for the equilibrium phase. The ratio measures the number of errors of classification made during a phase of equilibrium divided by the number of samples to classify during this phase. The figures displayed give, for a given r, the probability that the error ratio is inferior or equal to r.
4) Samples generated by the children in the school (crossvalidation): Videos from five different children were analysed, which constitute 12 minutes and 52 seconds of interaction. These runs contain 6,660 samples to classify: 97.49% of these samples have been classified by the algorithm. These samples contain 45 transitions. 91.1 % of these transitions were indeed well classified by the algorithm within an average delay of 10 these samples had to be extrapolated outside thc range of stcps considered for the extrapolation. 11 A transition is considered as wrongly classified if the transition phase is very long compared to the new equilibrium phase.
357
Authorized licensed use limited to: UNIVERSITY OF HERTFORDSHIRE. Downloaded on March 13, 2009 at 07:58 from IEEE Xplore. Restrictions apply.
0.17 seconds. The cumulative probability distribution of the delay is represented in Fig. 2. The curve grows very rapidly, thus showing that most of the delays are very low. Transitions recognised without any delay occur, and, at the far end, the highest delay is 1.54 seconds, which is very acceptable for human-robot interaction kinesics. The mean error ratio in the equilibrium phase is 0.1 and the cumulative probability distribution of this ratio is displayed in Fig. 3. Here again, the curve grows rapidly. It is worthy of note that the highest value obtained is 0.44 and the second one is much lower (0.26) which indicates that the first highest value can be seen as an extraordinary case. Looking at the sequential classification of the results, it appears that this highest error ratio was obtained while a child interacted in a very instable way that is, within 1.76 seconds three successive transitions were observed that are 1) no event to gentle (gentle phase lasted 1.37 seconds), 2) gentle to strong (the phase with strong style lasted only 0.26 seconds), 3) strong to gentle. It is the strong phase, after the transition from gentle to strong behaviour that was recognised with the highest error ratio (0.44), but it lasted for such a short time that it is not really a concern here (0.26 seconds is very low compared to the typical time for humanrobot interaction which usually lasts a few seconds). Therefore, we can consider to omit this highest value in the probability distribution and looking at the resulting values, the results are good and comparable to the results obtained in the laboratory.
B. Criterion: Frequency of the interaction 1) Training set of data: It constitutes 36 minutes 34 seconds of interaction and contains 4,865 samples to classify (respectively, 450 for 8 0 , 1,208 for 8t, 1,484 for 8 2 and 1, 723 for 8 3 ). 99.98% of these samples are well classified; the ratio of success specific to each class is displayed in Fig. 4. S'o So Sl S2 S3
S'l
1 0.0008
0 0
0 0.9992 0 0
S'2
S'3 0 0 1 0
0 0 0 1
Fig. 4. Confusion Matrix for the training set. The ratio is the one among events from type Si. Si represents the real class and S~ the recognised class, 0 S; i < 4.
2) Samples generated under laboratory conditions (crossvalidation): They constitute 51 minutes 44 seconds of interaction and contain 5,395 samples to classify (respectively 1,017 for 8 0 , 855 for 8t, 1,933 for 8 2 and 1,590 for 8 3 ) 91.16% of which were classified with an overall ratio of success of 0.922. 99.4% of the samples not extrapolated were well classified, and 76.41% of samples classified through extrapolation were well classified. Fig. 5 displays the confusion matrices. 3) Samples generated by the children in the school (crossvalidation): Three runs of interaction were used for the validation of the frequency of interaction in a real situation, from three different children. They constitute 14 minutes 41 seconds of interaction and contain 5, 288 samples to classify. 91% were classified (including 26.81% that had to be extrapolated) and
No Extrapolation
S' I
S' 0
S' 2
S' 3
Extrapolation
S' 0
S' I
S' 3
S' 2
So
1
0
0
0
So
1
0
0
0
Sl
0
0.972
0.028
0
Sl
0.115
0.864
0.022
0
S2
0
0
0.999
0.001
S2
0.083
0.146
0.768
0.003
S3
0
0
0.006
0.994
S3
0
0
0.368
0.632
Fig. 5. Confusion Matrices for pure sets of data for, respectively, non extrapolated and extrapolated data. Non extrapolated samples are samples which were classified without the need to use the extrapolation, because none of the cases were unseen cases (relatively to the training set samples). The results for those samples are provided in the table with mention No extrapolation. On the contrary, extrapolated samples are samples that used the extrapolation at least once in the cascade (those samples contained at least one unseen case in the cascade, i.e. a case that had not been encountered during the training). The results for those samples are provided in the table with the mention Extrapolation. See Fig. 4 for more details on the notion of confusion matrix.
93% were classified correctly. Among samples classified with no extrapolation, the ratio of success for a sound classification was 0.96. while for samples classified with extrapolation, it was 0.84. VII. DISCUSSION AND FUTURE WORK The algorithm has proven sound for the recognition of the two criteria of interaction. Concerning the criterion gentle/strong, results show that the two classes are well recognised and the delays very acceptable for human-robot interaction. The extrapolation works well, which shows the capability of the system to make a sound decision in case of unseen events. These results can be compared with a previous study of ours where we used Self-Organizing Maps to classify this criterion of interaction [4], whereby the average delay to recognize transitions was much higher and the postprocessing required more effort. Importantly, one might wish to define the styles slightly differently to the definition given here, such as, for instance, focusing on more details (in order to describe substyles for instance). This can be easily done by adjusting relevant parameters, mainly the number of bottleneck states, the binning and the training sets which condition the learning. The algorithm has also proved very capable of classifying real data over a mid-term time scale (cf. the criterion frequency of the interaction) which illustrates the ability of the method to make a powerful exploitation of an existing temporal structure not only of short-term time scales but also mid-term ones. This ability is empowered by the use of different bottlenecks (thus different mappings) over the cascade. In contrast, as explained in the section on Related Work, with HMMs the mapping would be the same all over the time series, and, by trying to squeeze all temporal information into one flat transition structure, it might actually prevent HMMs from an efficient making use of an existing temporal structure of the data. This hypothesis should be investigated in future work which will include a comparison of our method with HMMs in these scenarios. The problem with a cascade of bottlenecks trained independently could be here that the system has too many degrees of freedom and could overlearn. The extrapolation with the measure that we have introduced is a first step in the control of the degrees of freedom of the system. In addition,
358
Authorized licensed use limited to: UNIVERSITY OF HERTFORDSHIRE. Downloaded on March 13, 2009 at 07:58 from IEEE Xplore. Restrictions apply.
the overlearning can be tightly controlled by penalizing the intake of novel information. For this, we would have to move from the agglomerative model where f3 == 00 to a model with a finite f3 that would control the information intake per step. This shows how the Cascaded Information Bottleneck method is transparent and gives fine-grained control over how much and what new information is taken at which step in the cascade. This method is designed for real-time use during natural human-robot interaction and little research had been done so far on real-time recognition of tactile interaction styles. Salter et al. 's adaptation algorithm [11] was a first important step towards real adaptation. Yet, this system did not learn its own categorisation, which was completely described by a handtuned decision tree. In the present study, the recognition and the decision are made algorithmically, after a real learning phase and a capacity to extrapolate unseen events, with very small delays. Furthermore, our method is very easy to use and can be tuned easily to adapt to other criteria of interaction. VIII.
CONCLUSION
In this paper, we have presented a novel method for time series analysis for detecting interaction styles in the context of Human-Robot Interaction. This method, namely the Cascaded Information Bottleneck Method relies on a cascade of bottlenecks trained independently, the first one being trained in a standard way [3] while the next ones depend on the previous bottleneck states. This notably facilitates a powerful exploitation of the temporal structure of the data. Besides, a structure progressively emerges through the cascade and we introduced a measure to extrapolate unseen cases. We have applied our method to real-time recognition of human-robot interaction styles, in a detailed case study, by implementing the algorithm for real interactions with a real robot. The testing of the method had to be done offline, i.e. after the interactions had taken place, but the algorithm is designed to operate real time in order to enable real-time adaptation of robots to the interaction styles. We have shown the soundness of the method through extensive experiments, using successively samples of data generated under laboratory conditions and samples from natural situations of child-robot interaction in a school for children with autism. The algorithm was able to recognize short term events very well within and average delay of 0.17 seconds (the highest delay being 2.07 seconds). It was also able to recognise mid-term time scale events very well (the percentage of events correctly classified was 92% under laboratory conditions and 93% with data from the child-robot interactions). This study has shown the soundness of the method for pattern recognition and illustrated its capability of time-filtering on real data. Besides, the method is transparent and enables a fine-grained control over how much and what new information is taken at which step of the cascade. Finally, this method is entirely generic for applications with socially interactive (humanoid and non-humanoid) robots. Our own future work will focus on the application of the method in autism therapy where we find a strong need for
socially adaptive robots. The ability of a robot to classify in real time human-robot interaction styles is a first step towards the challenging goal of enabling an autonomous robot to influence positively children's interaction styles to guide him/her progressively towards different therapeutically relevant levels of interaction. ACKNOWLEDGMENTS
Dorothee Fran~ois is supported by a research scholarship of the University of Hertfordshire. The work described in this paper was partially conducted within the EU Integrated Project RobotCub (Robotic Open-architecture Technology for Cognition, Understanding and Behaviours) and was partially funded by the European Commission through the E5 Unit (Cognition) of FP6-IST under Contract FP6004370. The authors would like to thank the children who participated in these trials, their parents and their teachers. REFERENCES [I] "Aurora project," 2008, http://www.aurora-project.com/. [2] C. E. Shannon, The mathematical theory of communication. The University of Illinois Press, Urbana, 1949. [3] N. Tishby, F. C. Pereira, and W. Bialek, '''The information bottleneck method," in Proc. of the 37-th annual Allerton Conference on Communication, Control and Computing, 1999, pp. 368-377. [4] D. Francois, D. Polani, and K. Dautenhahn, "On-line behaviour classification and adaptation to human-robot interaction styles," in Proc. 2nd ACM/IEEE International Conference on Human-robot Interaction (HRI07), 2007, pp. 295-302. [5] T. Shibata, K. Wada, T. Saito, and K. Tanie, "Human interactive robot for psychological enrichment and therapy," in Proc. AISB '05 Symposium on Robot Companion Hard Problem and Open Challenges in HumanRobot Interaction, 2005, pp. 98-109. [6] P. Marti, F. Fano, V. Palma, A. Pollini, A. Rullo, and T. Shibata, "My gym robot," in Proc. AISB '05 Symposium on Robot Companion Hard Problem and Open Challenges in Human-Robot Interaction, 2005, pp. 64-73. [7] W. D. Stiehl, 1. Lieberman, C. Breazeal, L. Basel, L. Lalla, and M. Wolf, "The design of the huggable: A therapeutic robotic companion for relational, affective touch," in AAAI Fall Symposium on Caring Machines: AI in Eldercare, 2006. [8] B. Scassellati, "Quantitative metrics of social response for autism diagnosis," in Proc. J4th IEEE Int. Workshop on Robot and Human Interactive Communication (RO-MAN), 2005, pp. 585-590. [9] T. Kanda, H. Ishiguro, T. Ono, M. Imai, and R. Nakatsu, "Development and evaluation of an interactive humanoid robot '"robovie''' ," in Proc. IEEE Int. Con! on Robotics and Automation (ICRA2002), 2002, pp. 1848-1855. [10] T. Salter, K. Dautenhahn, and R. te Boekhorst, "Learning about natural human-robot interaction," Robotics and Autonomous Systems, vol. 54(2), pp. 127-134, 2006. [II] T. Salter, F. Michaud, D. Lee, and I. P. Werry, "Using proprioceptive sensors for categorizing human-robot interactions," in Proc. of the 2nd Int. Conference on Human-Robot Interaction HRI07, 2007, pp. 105-112. [12] A. Derakhshan, F. Hammer, Y. Demazeau, and H. H. Lund, "Mapping children and playgrounds into multi-agent systems," in Proc. JJth Int. Symposium on Art~ficial L~fe and Rohotics (ISAROB), 2006. [13] D. Kim, 1. Song, and D. Kim, "Simultaneous gesture segmentation and recognition based on forward spotting accumulative hmms," Pattern Recognition, vol. 40(11), pp. 3012-3026, 2007. [14] C. Lee and Y. Xu, "Online, interactive learning of gestures for human/robot interfaces," in Proceedings of the IEEE International Conference on Robotics and Automation, 1996, pp. 2982-2987. [15] 1. P. Crutchfield, Information and its Metric. Nonlinear structures in physical systems- Pattern Formation, Chaos and Waves, L.Lam and H. C. Morris Eds. Springer Verlag, pp I 19- I 30, 1990. [16] T. M. Cover and J. A. Thomas, Elements ofInformation Theory. WileyInterscience, New York, 1991. [17] N. Slonim and N. Tishby, "Agglomerative information bottleneck," in Proc. of Neural Information Processing Systems (NIPS 99), 1999, pp. 617---623.
359
Authorized licensed use limited to: UNIVERSITY OF HERTFORDSHIRE. Downloaded on March 13, 2009 at 07:58 from IEEE Xplore. Restrictions apply.