3846
IEEE SENSORS JOURNAL, VOL. 13, NO. 10, OCTOBER 2013
Towards the Implementation of IoT for Environmental Condition Monitoring in Homes Sean Dieter Tebje Kelly, Nagender Kumar Suryadevara, and Subhas Chandra Mukhopadhyay, Fellow, IEEE
Abstract— In this paper, we have reported an effective implementation for Internet of Things used for monitoring regular domestic conditions by means of low cost ubiquitous sensing system. The description about the integrated network architecture and the interconnecting mechanisms for the reliable measurement of parameters by smart sensors and transmission of data via internet is being presented. The longitudinal learning system was able to provide a self-control mechanism for better operation of the devices in monitoring stage. The framework of the monitoring system is based on a combination of pervasive distributed sensing units, information system for data aggregation, and reasoning and context awareness. Results are encouraging as the reliability of sensing information transmission through the proposed integrated network architecture is 97%. The prototype was tested to generate real-time graphical information rather than a test bed scenario. Index Terms— Internet of things (IoT), wireless sensor network, home automation, ZigBee, energy management.
I. I NTRODUCTION
W
ITH the advancements in Internet technologies and Wireless Sensor Networks (WSN), a new trend in the era of ubiquity is being realized. Enormous increase in users of Internet and modifications on the internetworking technologies enable networking of everyday objects [1]. “Internet of Things (IoT)” is all about physical items talking to each other, machine-to-machine communications and person-to-computer communications will be extended to “things” [2], [3]. Key technologies that will drive the future IoT will be related to Smart sensor technologies including WSN, Nanotechnology and Miniaturization. Humans usually inside their home interact with the environment settings like light, air, etc., and regulate accordingly. If the settings of the environment can be made to respond to human behavior automatically, then there are several advantages. The automation of home settings to act according to the inhabitant requirements is termed as intelligent home automation system. Ambient intelligence responds to the behavior of inhabitants in home and provides them with various facilities [4]. Manuscript received February 5, 2013; revised April 10, 2013; accepted May 3, 2013. Date of publication May 16, 2013; date of current version August 28, 2013. The associate editor coordinating the review of this paper and approving it for publication was Dr. Chonggang Wang. The authors are with the School of Engineering and Advanced Technology, Massey University, Palmerston North 4472, New Zealand (e-mail:
[email protected];
[email protected];
[email protected]). Color versions of one or more of the figures in this paper are available online at http://ieeexplore.ieee.org. Digital Object Identifier 10.1109/JSEN.2013.2263379
In general, intelligent home automation system consists of clusters of sensors, collecting different types of data, regarding the residents and utility consumption at home. Systems with computing capabilities analyze the assimilated data to recognize the activities of inhabitants or events. These can automate the domestic utilizations effectively and also can support the inhabitant by reducing the costs and improving the standard of living. In the recent past, several research activities were actively involved with IoT such as [5]–[7]. Most of the research activities related to IoT are confined to management of resource constraint devices [8], and different mechanisms of interconnection [9], [10]. The future cyber-age networked infrastructures of household appliances in homes are likely to be reliant on sensors embedded in/on the infrastructure. Such technologies will act as a catalyst to the evolution of a new generation of services that will have a great impact on the social and technological eco-system. According to [4], it can be envisaged that the next generation systems and services will encompass several domains such as e-Governance, Health Care, Transportation, Waste Management, Food Supply Chains, and Energy & Utilities. New technologies and applications built on top of smart devices may fulfill the vision of Intelligent Infrastructure. There are several examples of intelligent home automation or “Smart Home Monitoring” in research labs around the world, such as the GatorTech Smart House [11], Casas Smart Home [12], iDorm [13], Georgia Tech Aware Home [14], Place Lab [15], etc. To date, there has been no complete development of a monitoring smart home of commercial perspective, nor any investigation into how such a house is perceived by either the inhabitants or their careers. The smart homes designed so far are for different purposes such as information collection and decision support system for the wellbeing of the inhabitants [16], [17], storing and retrieving of multimedia data [17] and surveillance, where the data is captured from the environment and processed to obtain information that can help to raise alarms, in order to protect the home and the inhabitants from burglaries, theft and natural disasters [17]. This paper illustrates an effective low-cost and flexible solution for condition monitoring and energy management in home. The basic operations include remote management and control of domestic devices such as electric lamp; water heater etc., unobtrusive monitoring of domestic utilizations and providing ambient intelligence to reduce the energy consumption through IoT technology are the key functions of the developed system. This will support and reschedule the inhabitant operating time according to the energy demand
1530-437X © 2013 IEEE
KELLY et al.: TOWARD THE IMPLEMENTATION OF IOT
3847
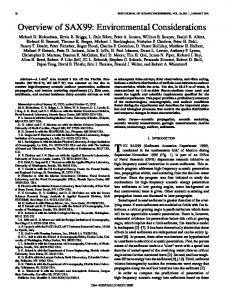
and supply. The novelty of the system is the internetworking mechanisms, which are practicable to integrate with comodules like intelligent home monitoring systems for wellness determination of inhabitants [18]–[22]. II. S YSTEM D ESCRIPTION The remote measurement and controlling of domestic devices over the Internet can be mechanized by following certain network architectural design strategies and applying ZigBee communication standards. The data transmission of smart sensing devices augmented with ZigBee over the internet can be done by integrating an internet gateway with WSNZigBee network. In a ZigBee network, end devices collect and forward data to a coordinator and then ZigBee protocol data format is translated to Internet protocol (IPV6) format by the gateway. The home automation scheme proposed in this paper can distantly measure electrical parameters and control domestic objects. The unified system will assist the inhabitants to avoid multiple systems to monitor their domestic utilization. The system can be run with the help of an inhabitant favorite laptop or i-pad device. Fig.1 shows the basic layout depicting key elements of the integrated WSN with internet system. It consists of i) Smart Sensing devices, ii) IoT Gateway and iii) Internet Server. A. ZigBee Wireless Sensor Network The ZigBee WSN comprises of XBee-S2 modules built by Digi [23] are configured as end devices (sensor nodes) and communicate wirelessly to a coordinator in the form of a mesh topology. If the end device is within the range of the coordinator device, the system runs like a star topology. Otherwise, hopping takes place and the outer most end device will send its data to the nearby router and consequently the data will reach to the coordinator. The coordinator is connected to a router with a wired serial connection. The router runs an open source embedded Linux (OpenWRT) [24] software, providing networking functionality to connect the internet. This essentially provides internet access to the Xbee-S2 sensor data collected by the Xbee-S2 coordinator. Router acts as an IoT application gateway and interconnects the IPv6 and ZigBee network. A private IPv6 network using a Virtual Private Network (VPN) is used for connecting the IoT application gateway to the server. The server collects sensor data forwarded by the application gateway and store in a database for further processing and then to be viewed via a website. Data can be viewed in terms of previous day, week, and month time periods graphically. In the present setup, heterogeneous sensing units are designed and developed indigenously for intelligent home monitoring systems to integrate with IoT networks. The following sections describe these entities: B. Sensing Units We have used three different types of sensing units as shown in Fig. 2 for effective data management on the IoT networks.
Fig. 1.
Overall system structure connecting different sensing units.
The sensing unit type #1 measure the attributes of a hot water system in home. This unit comprises of a hot water cylinder that heats the water from mains electricity and a solar heater that uses sunlight to heat the water. The various parameters measured by sensors related to the hot water system are: water temperature in the hot water cylinder, water temperature in the solar water heater, current supplied to hot water cylinder and outside light intensity. All these parameter values are monitored through the IoT application interface. The sensing unit type #2 measures the current and voltage parameters of a household appliance, thus indicating the power consumed and the conditioning of the respective usage of the appliance. The usage pattern of the appliance can be monitored through the IoT website interface wherein the data is forwarded through the IoT gateway integrated with WSN ZigBee coordinator. The sensing unit type #3 measures the environmental conditioning values such as temperature, light intensity, humid-
3848
IEEE SENSORS JOURNAL, VOL. 13, NO. 10, OCTOBER 2013 Solar Heater T_Sen #1 T_Sen#3 L_Sen#1
(a)
WRT54GL Router/ Gateway
Geyser-T_Sen#2
T_Sen#5
Water Pump P_Sen#1
T_Sen#4
Fig. 3. Placement of sensors in the WSN home. (T_Sen: Temperature Sensor, L_Sen: Light Intensity Sensor, P_Sen: Power Sensor).
functional characteristics within an indoor range of about 70-80 meters provided an XBee S2 Pro module is used. We considered Xbee-S2 modules in the present setup as they provide sufficient indoor range (i.e. up to 40 meters).
(b)
(c) Fig. 2. In-house fabricated sensing units for IoT. (a) Sensing unit type #1: Hot water system monitoring- light intensity and temperature monitoring. (b) Sensing unit type #2: Household electrical appliance monitoring and controlling. (c) Sensing unit type #3: Measuring environment temperature.
C. IoT Application Gateway The transformation of sensing information between the ZigBee and IPv6 network is executed by a program at the IoT application gateway, as the ZigBee network does not have the architecture to communicate with internet protocols. The IoT application gateway consists of a program for transforming ZigBee addresses and encapsulating data payloads in an internet protocol. The XBee-S2 modules produce sample packets which are converted by the application gateway to IPv6 User Datagram Protocol (UDP) packets and sent to a server. Command packets to control the XBee-S2 modules are encapsulated in an UDP packet by the server, and converted by the IoT application gateway to ZigBee packets. D. Sensor Characteristics
ity, etc.,. Thus, the fabrication of different types of sensing units enabled in remote monitoring and controlling of household appliances through IoT gateway and IoT application. Fig. 2(a,b,c) depicts the fabricated sensing units used in the IoT application. The power supplies for sensing unit’s type #1 and type #2 are from electrical outlets, whereas for type #3 the power is supplied from a battery. Type #1 and type #2 radio units are continuously on, therefore consume 40 mA. Type #3 radio units’ uses a duty cycling method in which, it is on for 30 ms for every 5 secs, therefore current consumption is 0.24 mAh. The wireless sensing units with internal sensors to measure temperature, light, humidity, electrical parameters, etc., are deployed at the house as shown in Fig. 3. Electrical sensing units are fabricated in such a way that they can be easily plugged into power points and can operate according to their
The environmental parameters (temperature, humidity and light) are important aspects for deciding whether equipment such as (fans, electric heaters or lamps) should be switched on or off in a wireless monitoring network used for energy management in the home. The following sensors are used in the present setup. The sensor nodes used in the ZigBee WSN have a temperature sensor (TMP 36) [25] operating in the range of −20 °C to +125 °C. The output voltage out of this sensor varies 1 °C for every 10mV with 500mV offset voltage. The light sensor used was BPW21R [26], consists of a planar silicon NPN photodiode that is equipped with a flat glass window and built in colour correction filter designed to approximate the spectral response of the human eye. The power dissipation is about 300 mW with operating temperature range of −40 °C to +125 °C and sensitivity to 9 nA/lx [26]. The AC voltage sensor has a range of 200-280 Volts-RMS with an accuracy of
KELLY et al.: TOWARD THE IMPLEMENTATION OF IOT
3849
Fig. 5.
Fig. 4. Address transformation from ZigBee sensing unit to Internet packet.
± 2Volts-RMS. The current sensor consisted of an ASM010 current transformer manufactured by Talema [27], with a range of 1 to 100 Amps and operating temperature range from −40 °C to +120 °C. E. Display on Web Interface A windows based server collects sample data by receiving the UDP packets containing sample data from the IoT application gateway and store in a database. These samples can be accessed from the database from a website hosted on the server. The raw sample data, sample source (channel and sensor node) and time of arrival is stored in the database. This enables the samples to be ordered by date and organized by their source. Sample data is displayed on the website in time series graphs; each graph represents the corresponding sensing input information specifically depicting each of the parameter values. The website (in the background process) performs conversion of raw sample data to engineering units for display in these graphs. III. I MPLEMENTATION D ETAILS A. Address Transformation The key element in the data transformation from ZigBee to IPV6 format is the address translation. This was implemented by the application gateway program for determining the source or destination address of a packet that encapsulates a ZigBee packets’ payload. The corresponding application gateway performs the address transformation mechanism for ZigBee to address non ZigBee nodes. ZigBee is based upon the 802.14.5 protocol which uses a 64 bit address for each node on a PAN, and 16 bits to identify the PAN ID. IPv6 uses 128 bits to address a node on the network, of which 48 bits represent the network, 16 bits represent the local network (PAN ID), and 64 bits represent the host id (sensor node). Therefore, the node address for 802.15.4 can placed in an IPv6 address, and the PAN ID can be used to identify the ZigBee network in an IPv6 address. Fig. 4 shows the address transformation of ZigBee and IPv6 packet. B. Packet Translation The packets originated from the XBee-S2 network are sent to a server using a tunneling technique, where the addressing
ZigBee packet transformation to IPv6 format.
information is removed and placed in the encapsulating protocol. Packets destined for the XBee-S2 network use a stateful translation where the source address is stored on the gateway. This enables reply packets from the XBee-S2 network to be sent to the correct address. A serial interface is used to transmit Application Programming Interface (API) packets from/to the coordinator and router. The WRT54GL router has two serial ports – one of which is used to connect to the XBee-S2 coordinator. The router performs the conversion of the XBee-S2 API packet to an IPv6 packet. Xbee-S2 modules provide architecture to sample an analogue value and transmit a packet containing this sample to a coordinator. The coordinator outputs an API packet on its serial interface each time a sample packet is received. The API packet contains; the type of API packet, the address of the node that took the sample, the PAN ID of the network the node is on and the sample data. To enable transmission over the internet the API packet is translated into an IPv6 UDP packet. The address is translated using the method discussed in section III.A and the sample data is encapsulated as the UDP payload. The source and destination port of the UDP packet is arbitrarily set in order to identify the UDP packet as containing sample data. Fig. 5 shows the corresponding schematic of ZigBee packet transformation to IPv6 format. Transformation from IPv6 to an API packet requires a stateful conversion. This implies that the source address of the packet must be stored on the router as there is no method of including it in the API packet. C. Transmission Over IP The Linux-OpenWRT software provides the networking architecture to participate in many types of networks. These networks are abstracted into devices, which generalizes management and configuration. This abstraction requires device drivers which operate in the kernel space, making development difficult. A TUN/TAP device driver acts as a virtual network device with its output directed to a user space program instead of a physical device. This simplifies the development of a network device, as a user space program is easier to develop. The IPv6 can be used with a TUN/TAP driver provided the kernel has IPv6 support. This means a virtual IPv6 network can be created, where packets destined for this network are routed to a user space program. IPv6 packets can also be created and sent via the TUN/TAP driver and will appear to originate from the virtual network.
3850
IEEE SENSORS JOURNAL, VOL. 13, NO. 10, OCTOBER 2013
°C
These are the same routines used for the serial interface implying multiplexing between the serial interface and TUN/TAP interface can be done by the Linux kernel. This eliminates the need for complex threading.
Watts
°C
D. Storage of Data
Fig. 6(a)
The UDP packets produced at the gateway encapsulate sample data to be sent to windows based server. An application running on the server uses the standard socket interface to receive UDP packets on an arbitrary port, and stores the relevant information in the MySQL database. The database table has 4 columns; source address, time, source channel and sample data. Rows are added to this table for each UDP packet received. This allows samples to be sorted by time, sensor node and sensor channel. In the present system, programs for address, packet transformations and data transmission are written using ‘C’ programming language, programs for packet reception and data storage are written using ‘C#’ and Web interface is developed using PHP and Java Scripts.
°C
E. Network Monitoring
lux
In order to monitor and maintain the condition of the WSN it is necessary to have access to information about the actual network and the communications between the different elements of the network. Important information for the setup of the system, deployment of the network, connectivity, health and reliability of the communication can be accessed from the developed Web user interface of the network.
Ampere
Volts
Fig. 6(b)
Fig. 6(c)
Fig. 6. Real-time graphical representation of different types of sensing information on the IoT web site. (a) Sensing units inside the house, measuring hot water system parameters on the IoT website. (b) Outside temperature and light intensity sensor data. (c) Voltage and current measurement of water pump on the IoT web.
This virtual network can be mapped to the ZigBee PAN using the address transformation as discussed in section III.A and packets are transformed using the technique in section III.B. Access to the TUN/TAP driver is provided through the standard input output routines of embedded Linux.
IV. E XPERIMENTAL R ESULTS The developed system is tested by installing the Smart sensing units and setting up a ZigBee based WSN at few houses. Interconnecting ZigBee network with IPv6 network is performed by connecting and configuring the modified router (IoT application gateway) as discussed in section III. Integrated system was continuously used and generated realtime graphical representation of the sensing information. Fig. 6(a,b,c) shows the graphical representation of type #1 sensing unit information in real-time on the IoT website. Measurements related to hot water and solar heating systems are shown in Fig. 6(a), Fig 6(b). Measurements of water supply pump are shown in Fig. 6(c). Thus, the hot water system of the household entities has been reflected in the form of IoT for better remote utilization and controlling through an internet website. Fig. 6(a) shows temperature measurements taken at the hot water cylinder and the solar heater, and the power consumption of the hot water cylinder. From the graphs it is easy to determine when hot water was being used and the reduction in power consumption when the solar heater is active. Fig. 6(b) shows temperature measurements taken outside the home and the approximate light intensity that the solar heater is subjected to. When compared with Fig. 6(a) it can be seen that when the light intensity and temperature outside the home is above a threshold the solar heater becomes active. Fig. 6(c) shows measurements of the voltage and current at the water
KELLY et al.: TOWARD THE IMPLEMENTATION OF IOT
3851
Fig. 8(a)
Fig. 7. Correlation between power, light intensity and temperature sensor of hot water system on a particular day.
supply pump. The voltage measurement has large amount of noise, this is due to several factors such as ungrounded inputs, insufficient filtering and power supply fluctuations. The above mentioned parameters support the automation operation of the of the solar water heating system. It was observed from the Fig. 6, that when water cylinder temperature decreases then there was an increase in power consumption by the water cylinder. This is also reflected in Fig. 7 depicting that when there was sufficient light energy then there is decrease in power consumption of the hot water cylinder. The temperature of water in the solar heater does not exceed the water cylinder temperature due to a circulation pump providing colder water. The second type of sensing unit ‘#2’(IoT) was used to monitor and control regular electrical household appliances such as Battery Charging units, Room Heaters, Washing Machines, Refrigerators, etc. through IoT web site. Depending on the inhabitant usages, these devices are controlled either by automation depending on the tariff conditions or by the inhabitant using the IoT website. The tariff conditions refer to the situation wherein unimportant electrical appliance will be automatically switched off by the system during high price of the electricity. The control program is running on the server. Based on the inhabitant usages, control commands are sent from the server program to the appropriate sensing devices. Fig. 8(a) shows the usage pattern of a fridge on a particular day based on the tariff control mechanism. Fig. 8(b) depicts the regular usage of an electrical appliance without tariff control. The application is flexible in usage as these devices can be controlled remotely using the secured IoT website. Thus, the regular household electrical appliances have been internetworked through IoT technology by integrating ZigBee with IPV6 for better remote management.
Fig 8(b) Fig. 8. Fridge power consumption. (a) Fridge- Power consumption with tariff control. (b) Fridge- power consumption without tariff control.
The third type of sensing unit ‘#3’ was used to measure the ambient readings inside the home, such as room temperature. These sensing units enable us to regulate the usage of the appliances such as room heaters on/off depending on the environmental values. Room temperatures over a period of time are depicted graphically on the website as shown in Fig. 9. Thus, through the IoT website the environmental conditions of the house are monitored for effective remote management. The web application charts are designed and developed using “Flot” chart library, using PHP JSON functions. These functions provide the real-time display of the sensor data on the web pages. “Flot” is a pure JavaScript plotting library for j Query, with a focus on to display real-time data graphically [29].
3852
IEEE SENSORS JOURNAL, VOL. 13, NO. 10, OCTOBER 2013
TABLE I R ELIABILITY OF THE D ATA T RANSMISSION IN THE I NTEGRATED Z IG B EE –IP V 6 N ETWORKS OF T WO S ENSING U NITS FOR A P ERIOD 31 D AYS Average Time Between Correctly Received Samples (seconds)
Number of Lost Packets
Expected Number of Packets
Number of Correctly Received Packets
Reliability (%)
1
9.80
7502
272908
265406
97.25
2
10.55
7354
253774
246420
97.10
Sensing Module
Fig. 10. Fig. 9.
Throughput of a IoT sensing module for a period of one month.
Inside cupboard temperature sensor displayed on the web.
A. Quality of Service (QoS) of the Integrated ZigBee and IPv6 System The data from two sensors for the duration of a month was analyzed to determine the reliability, throughput and jitter of the system. The XBee-S2 devices were configured to send samples every 10 seconds. The arrival time of these samples on the server are recorded in the database accordingly. The time between these recorded times is the interval at which the XBee device is sending sample information. The total amount of sample information received by the server was calculated by dividing running time of the system with the sample interval. Reliability: The reliability of the system was determined by comparing the calculated value with the amount of sensor information received correctly. The lost packets include the total of lost packets between sensing device-coordinator, coordinator-router and router-server. The difference between arrival times of successive sensor information gives the interval value. If the time interval is greater or less than 10 seconds then there was an error. When the interval is less than 10 secs then the sample information received was incorrect or duplicated and therefore it is erroneous. When the interval is greater than 10secs sample information has been lost, the amount of information lost can be determined by dividing the greater interval by the expected interval, Table. I show the reliability of two devices sensor information transmission of ZigBee data encapsulated in IPv6 packet. Throughput: The throughput of the sensing module is the amount of data sent from the sensing module to the server in a given time period [28]. The amount of data in each sample packet was 16 bytes, which is sent every 10 seconds. Therefore the throughput of the sensing module was 1.6 bytes per second. To measure the throughput of the sensing module, the number of packets received in a 5 minute time span was considered. The throughput was obtained by dividing the time interval of
5 minutes. Fig. 10 shows the throughput of a sensing module for the period of one month. The average throughput is 1.55 bytes/second and the reliability was 97%. Investigation into the sporadic significant change in throughput is in process. Causes are likely to be the interferences from other networks such as Wi-Fi. The stability of the IoT household appliances condition monitoring; relating to interconnection with the WSN and the IPv6 depicts that the IoT technology is reliable in transforming intranet of things to internet of things with low-cost system utilization. V. D ISCUSSION AND F UTURE W ORK With the advancements in technology, it is expected that the availability of internet is everywhere and online at all time. Low-cost smart sensor node development enabled devices to be connected easily and corresponding information can be accessible globally. With the features of scalability, fault tolerance and effective power consumption of nodes and transceiver IoT have facilitated ubiquity computational ability to internetwork heterogeneous smart devices easily and facilitate availability of data anywhere. In this paper, we proposed an efficient method for internetworking of 802.15.4 with IP network. The key idea of the proposed method is to provide a low-cost solution and flexible connection mechanisms for integrating Internet of things with home monitoring systems. The advantages of the developed system are to have greater control over routing of packets (security and customization) and ability to adapt to other wireless sensor networks. The QoS of the integrated network architecture is determined in terms of two parameters i) throughput and ii) reliability. The evaluation shows that the sensing information of the domestic object usages through IoT can be effectively realized by following the procedure mentioned in sections II and III.
KELLY et al.: TOWARD THE IMPLEMENTATION OF IOT
Issues like availability of IPv6 connectivity may be a major concern in implementing the methods as discussed in this paper. As most of the internet domains still operate using IPv4 and IPv6 adoption is low. Better compression techniques can be implemented for minimizing storage requirements and effective retrieval of data. In the next step, sensing units will be interconnected using 6 LowPAN network setup for better reliability and effective data transmission. Also, security issues and study related to comparison of ZigBee based data transmission and 6 LowPan network for Smart Home environment with heterogeneous smart sensors will be performed. R EFERENCES [1] D. Surie, O. Laguionie, and T. Pederson, “Wireless sensor networking of everyday objects in a smart home environment,” in Proc. Int. Conf. Intell. Sensors, Sensor Netw. Inf. Process., 2008, pp. 189–194. [2] H. Sundmaeker, P. Guillemin, P. Friess, S. Woelffle, Vision and Challenges for Realizing the Internet of Things. Luxembourg, Germany: European Union, 2010, ISBN 9789279150883. [3] Internet 3.0: The Internet of Things, Analysys Mason, Singapore, 2010. [4] M. Eisenhauer, P. Rosengren, and P. Antolin, “A development platform for integrating wireless devices and sensors into ambient intelligence systems,” in Proc. 6th Annu. IEEE Commun. Soc. Sensor, Mesh Ad Hoc Commun. Netw. Workshops, Jun. 2009, pp. 1–3. [5] S. Hong, D. Kim, M. Ha, S. Bae, S. Park, W. Jung, and J. E. Kim, “SNAIL: An IP-based wireless sensor network approach to the internet of things,” IEEE Wireless Commun., vol. 17, no. 6, pp. 34–42, Dec. 2010. [6] N. Bui, A. P. Castellani, P. Casari, and M. Zorzi, “The internet of energy: A web-enabled smart grid system,” IEEE Netw., vol. 26, no. 4, pp. 39–45, Jul.–Aug. 2012. [7] A. Iera, C. Floerkemeier, J. Mitsugi, and G. Morabito, “The internet of things,” IEEE Wireless Commun., vol. 17, no. 6, pp. 8–9, Dec. 2010. [8] A. Gluhak, S. Krco, M. Nati, D. Pfisterer, N. Mitton, T. Razafindr alambo, “A survey on facilities for experimental internet of things research,” IEEE Commun. Mag., vol. 49, no. 11, pp. 58–67, Nov. 2011. [9] M. Zorzi, A. Gluhak, S. Lange, and A. Bassi, “From today’s INTRAnet of things to a future INTERnet of things: A wireless- and mobilityrelated view,” IEEE Wireless Commun., vol. 17, no. 6, pp. 44–51, Dec. 2010. [10] A. Sehgal, V. Perelman, S. Kuryla, and J. Schonwalder, “Management of resource constrained devices in the internet of things,” IEEE Commun. Mag., vol. 50, no. 12, pp. 144–149, Dec. 2012. [11] S. Helal, W. Mann, H. El-Zabadani, J. King, Y. Kaddoura, and E. Jansen, “The gator tech smart house: A programmable pervasive space,” IEEE Comput., vol. 38, no. 3, pp. 50–60, Mar. 2005. [12] D. J. Cook, “Learning setting-generalized activity models for smart spaces,” IEEE Intell. Syst., vol. 27, no. 1, pp. 32–38, Jan.–Feb. 2012. [13] F. Doctor, H. Hagras, and V. Callaghan, “A fuzzy embedded agentbased approach for realizing ambient intelligence in intelligent inhabited environments,” IEEE Trans. Syst., Man Cybern., A, Syst. Humans, vol. 35, no. 1, pp. 55–65, Jan. 2005. [14] J. A. Kientz, S. N. Patel, B. Jones, E. Price, E. D. Myantt, and G. D. Abowd, “The Georgia tech aware home,” in Proc. Extended Abstracts Human Factors Comput. Syst., 2008, pp. 3675–3680. [15] I. S. Larson, K. Tapia, E. Beaudin, J. Kaushik, P. Nawyn, and J. R. Rockinson, “Using a live-in laboratory for ubiquitous computing research,” in Pervasive Computing (Lecture Notes in Computer Science), vol. 3968, K. Fishkin, B. Schiele, P. Nixon, and A. Quigley Eds. Berlin, Germany: Springer-Verlag, 2006, ch. 22, pp. 349–365. [16] N. K. Suryadevara and S. C. Mukhopadhyay, “Wireless sensor network based home monitoring system for wellness determination of elderly,” IEEE Sensors J., vol. 12, no. 6, pp. 1965–1972, Jun. 2012. [17] L. C. De Silva, M. Chamin, and M. P. Iskandar, “State of the art of smart homes,” Eng. Appl. Artif. Intell., vol. 25, no. 7, pp. 1313–1321, 2012. [18] N. K. Suryadevara, A. Gaddam, R. K. Rayudu, and S. C. Mukhopadhyay, “Wireless sensors network based safe home to care elderly people: Behaviour detection,” Sens. Actuators A, Phys., vol. 186, pp. 277–283, Oct. 2012. [19] C. Ranhotigamage and S. C. Mukhopadhyay, “Field trials and performance monitoring of distributed solar panels using a low cost wireless sensors network for domestic applications,” IEEE Sensors J., vol. 11, no. 10, pp. 2583–2590, Oct. 2011.
3853
[20] K. Kaur, S. C. Mukhopadhyay, J. Schnepper, M. Haefke, and H. Ewald, “A Zigbee based wearable physiological parameters monitoring system,” IEEE Sensors J., vol. 12, no. 3, pp. 423–430, Mar. 2012. [21] H. M. Alabri, S. C. Mukhopadhyay, G. A. Punchihewa, N. K. Suryadevara, and Y. M. Huang, “Comparison of applying sleep mode function to the smart wireless environmental sensing stations for extending the life time,” in Proc. IEEE Int. Instrum. Meas. Technol. Conf., May 2012, pp. 2634–2639. [22] G. M. Mendez, M. A. M. Yunus, and S. C. Mukhopadhyay, “A WiFi based smart wireless sensor network for monitoring an agricultural environment,” in Proc. IEEE Int. Instrum. Meas. Technol. Conf., May 2012, pp. 2640–2645. [23] ZigBee Alliance, (Accessed May 30, 2013). Understanding ZigBee Gateway [Online]. Available: http://docs.zigbee.org/zigbee-docs/dcn/095465.pdf. [24] (Accessed Apr. 2, 2013). OpenWRT [Online]. Available: http://openwrt.org/ [25] (Accessed Apr. 3, 2013). Data Sheet TMP36 [Online]. Available: http://www.analog.com/static/imported-files/data_sheets/ TMP35_36_37.pdf [26] (Accessed Apr. 2, 2013). Data Sheet BPW21R Vishay Semiconductors [Online]. Available: http://www.vishay.com/docs/81519/bpw21r.pdf [27] (Accessed Apr. 3, 2013). Data Sheet ASM010 [Online]. Available: http://www.datasheetarchive.com/ASM-010-datasheet.html [28] Y. Wang, “Probabilistic QoS analysis in wireless sensor networks,” Ph.D. dissertation, Dept. Comput. Sci. Eng., Univ. Nebraska, Lincoln, NE, USA, 2012. [29] (Accessed Apr. 3, 2013). Flot [Online]. Available: http://www.flotcharts.org/
Sean Dieter Tebje Kelly is currently pursuing the Master of Engineering degree at Massey University, Palmerston North, New Zealand. His current research interests include wireless sensor networks and internet of things. His work includes developing software for embedded devices, developing hardware for sensors, and website development.
Nagender Kumar Suryadevara received the Bachelor of Technology degree from Sri Krishnadevaraya University, India, in 1996, and the Master of Engineering degree from Madurai Kamaraj University, Madurai, India, in 1998. He is currently pursuing the Ph.D. degree at the School of Engineering and Advanced Technology, Massey University, Palmerston North, New Zealand. In his career he has demonstrated consistent success as an administrator and educator at the graduate and post graduate education levels in India, Ethiopia, and Oman in wireless sensor network and real-time data mining. His current research interests include the domains. He is currently involved with the development of software system for the home monitoring project using WSN.
Subhas Chandra Mukhopadhyay (M’97–SM’02– F’11) is a Professor of sensing technology with the School of Engineering and Advanced Technology, Massey University, Palmerston North, New Zealand. He has over 22 years of teaching and research experience. His current research interests include smart sensors and sensing technology, wireless sensor networks, internet of things, electromagnetics, and control engineering. He has authored or co-authored over 275 papers in different international journals, conferences, and book chapter. He has edited 11 conference proceedings. He has edited 11 special issues of international journals as a Lead Guest Editor and 15 books with Springer-Verlag. He has delivered 188 seminars, including keynote, tutorial, invited, and special seminars.