Archives Italiennes de Biologie, 148: 189-205, 2010.
Towards the virtual brain: network modeling of the intact and the damaged brain V.K. Jirsa1, O. Sporns2, M. Breakspear3,4, G. Deco5, A.R. McIntosh6 Theoretical Neuroscience Group, CNRS UMR 6233, Université de la Méditerranée, Marseille, France; 2 Department of Psychological and Brain Sciences, Indiana University, Bloomington, Indiana, USA; 3 Queensland Institute of Medical Research and the Royal Brisbane and Woman’s Hospital, Queensland 4006, Australia; 4 School of Psychiatry, University of New South Wales and The Black Dog Institute, New South Wales 2031, Australia; 5 Institució Catalana de la Recerca i Estudis Avançats (ICREA), Universitat Pompeu Fabra, Passeig Lluís Companys 23, Barcelona, 08010, Spain; 6 Rotman Research Institute of Baycrest Center, Toronto, Ontario, Canada 1
A bstract
Neurocomputational models of large-scale brain dynamics utilizing realistic connectivity matrices have advanced our understanding of the operational network principles in the brain. In particular, spontaneous or resting state activity has been studied on various scales of spatial and temporal organization including those that relate to physiological, encephalographic and hemodynamic data. In this article we focus on the brain from the perspective of a dynamic network and discuss the role of its network constituents in shaping brain dynamics. These constituents include the brain’s structural connectivity, the population dynamics of its network nodes and the time delays involved in signal transmission. In addition, no discussion of brain dynamics would be complete without considering noise and stochastic effects. In fact, there is mounting evidence that the interaction between noise and dynamics plays an important functional role in shaping key brain processes. In particular, we discuss a unifying theoretical framework that explains how structured spatio-temporal resting state patterns emerge from noise driven explorations of unstable or stable oscillatory states. Embracing this perspective, we explore the consequences of network manipulations to understand some of the brain’s dysfunctions, as well as network effects that offer new insights into routes towards therapy, recovery and brain repair. These collective insights will be at the core of a new computational environment, the Virtual Brain, which will allow flexible incorporation of empirical data constraining the brain models to integrate, unify and predict network responses to incipient pathological processes. Key words Virtual brain • Connectivity • Dynamics • Space-time structure • Network modeling • Brain damage
Introduction An increasing body of research indicates that “network dysfunction” in the cortex – a disturbance in key, distributed forms of information processing – is the final common pathway mediating between a myriad of underlying incipient molecular and neuronal pathologies and their varied clinical expression. At the same time, compensatory network dynamics should underlie clinical recovery, either through the
natural history of a remitting disorder or through specific clinical interventions. Numerous lines of clinical evidence support the network basis of brain function, dysfunction, and repair. Classic studies have documented that the perturbation of a single brain region or node can affect the network as a whole (Hughlings Jackson, 1884; von Monakow, 1911). Whether the manipulation of certain network parameters enables the restoration of brain function remains to be demonstrated. Our primary goal in this
Corresponding Author: Viktor Jirsa, Theoretical Neuroscience Group, Institute of Movement Sciences UMR 6233, Faculté des Sciences du Sport (UFR STAPS), Université de la Méditerranée (Aix-Marseille II), 163 avenue de Luminy, CP 910, 13288 Marseille Cedex 9, France - Email:
[email protected]
190
V.K. Jirsa et al.
article is to provide a firm theoretical basis for the idea that manipulation of network parameters may be useful for the recovery of brain function. Any successes in this domain stand to have an enormous impact to the field of neuroscience. The work discussed here summarizes our scientific objective and the network approach that we take as a group. Large-scale brain network models refer to mathematical and computational models that have spatiotemporal characteristics typically not encountered in the more traditional neural network literature. The network nodes represent brain regions, which incorporate a realistic computational model of their internal dynamics. The network links between brain regions represent interregional pathways that convey neuronal signals, not instantaneously but with a finite transmission speed. The resultant time delay may often be negligible in intraregional networks, but not on larger scales involving multiple brain regions. Large-scale brain networks are well suited to describe the generation of spatiotemporal activity patterns observable in scalp topographies such as EEG and MEG, as well as the BOLD signal. With only a few notable exceptions discussed below, most extant brain network models do not explicitly use a biologically realistic connectivity matrix derived from empirical measurements of anatomical pathways, but make generic simplifying assumptions about the topology, density and range of the underlying large scale connectivity (Jirsa and Haken, 1996; Robinson et al., 1997; Breakspear et al., 2004). Model-driven multimodal integration has not been often attempted either, though some recent examples link neuronal activity (local field potential and firing rate of neural masses) to EEG/MEG (see for instance Jirsa et al., 2002; Valdes-Sosa et al., 2009). As a first step, a series of large-scale models has explored the spatiotemporal dynamics that arise on an anatomically based cortical model. The emphasis has been on intrinsic dynamics rather than those resulting from stimulus-evoked processing. A large body of empirical work has shown that spontaneous brain activity during wakeful rest is not purely random but rather displays detailed spatiotemporal structure, which includes the slow fluctuating spatiotemporal patterns observed in the fMRI BOLD signal (Biswal et al., 1995) and the rapid fluctuations in electrical activity observable in EEG and MEG
(e.g. Lehmann, 1971; Breakspear et al., 2004). Understanding how this activity emerges in the absence of an externally imposed task is not a trivial problem. In complex dynamical systems like the brain, the collective result of system-wide dynamics is difficult to predict even with near-perfect knowledge of all major contributing factors (e.g., corticalcortical connectivity, local cortical dynamics, and intracortical connectivity). Across time scales usually considered in fMRI, the patterning of resting state networks appears largely dependent on anatomical connectivity, although it is less constrained on the faster time scales of EEG. Both modeling and empirical work illustrate that anatomical connections enable functional connections to emerge, but that there are a number of possible functional connectivity patterns that can be expressed around the same anatomical skeleton. Beyond connectivity, the dynamics of this global pattern are also shaped by other factors including the local dynamics of the brain regions, signal transmission delays, and noise. In the following, we review recent progress in each of these fields.
Quantitative analysis of structural and functional brain networks Recent methodological advances, especially in the application of whole-brain noninvasive neuroimaging approaches, have revealed the architecture of structural and functional brain networks in unprecedented detail. Diffusion imaging and tractography allow the comprehensive mapping of inter-regional pathways (Johansen-Berg and Behrens, 2009) and resting-state fMRI has demonstrated that spontaneous neural activity exhibits characteristic spatiotemporal patterns (Fox and Raichle, 2007). A key issue for systems and cognitive neuroscience concerns the relation between structural and functional networks – how does the anatomy of the brain shape and constrain dynamic interactions, and how do these interactions in turn mold the efficacy and strength of structural links? Moreover, what are the implications of these relationships for fluctuating cognitive processes, including sensory integration, attention and consciousness? An important set of tools for the analysis of brain networks is provided by graph theory, the quantita-
towards the virtual brain
tive study of complex networks, composed of sets of nodes and edges (Bullmore and Sporns, 2009). Numerous graph metrics are available, roughly classifiable into measures that assess the degree of local ordering, global communication, and regional participation, which we refer to as measures of segregation, integration and influence, respectively (Rubinov and Sporns, 2010). Measures of segregation capture the degree to which the network’s nodes are clustered together, forming densely connected communities (modules) that are more weakly interconnected amongst each other. Community detection is of special relevance because structural and functional modules are often found to coincide with sets of brain regions and pathways that are functionally related – they often form known sensory or motor systems or jointly participate in a particular task domain (e.g. Dosenbach et al., 2007). Measures of global integration assess the capacity of the network to exchange information. Integration is facilitated by a preponderance of short paths between pairs of nodes, which defines the global “communication distance” across the network. Integration can be measured by computing the average length of the shortest paths, or by deriving a closely related (essentially inverse) measure of global efficiency. Measures of influence quantify the centrality of individual nodes (or edges), for example with respect to the overall exchange of information across the network. Graph metrics have been shown to be robust and reliable across multiple imaging runs (Deuker et al., 2009), although their numerical values are greatly dependent on the partitioning scheme used to define nodes and edges (Zalesky et al., 2009). Additional advantages are that they can be applied to networks derived from anatomical as well as physiological data, and can be compared across imaging modalities, individual subjects or clinical conditions. The application of graph-theoretical methods to human brain data sets has already demonstrated that structural and functional networks have characteristic, nonrandom attributes. Large-scale structural networks derived from DTI or DSI measurements exhibit a high propensity for clustering of nodes into structural modules, coupled with a high capacity for global information flow, the hallmarks of a small-world organization (Hagmann et al., 2007, 2008; Iturria-Medina et al., 2008; Gong et al., 2009). Modules are coupled via hub nodes, representing
191
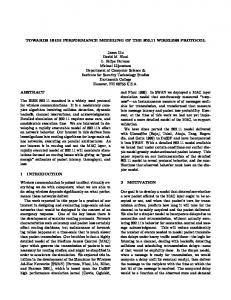
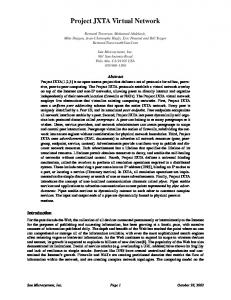
highly connected and highly central regions of the brain. These regions are located primarily within the parietal and frontal lobes of the cerebral cortex, and aggregated to form a prominent posteromedial core (Hagmann et al., 2008). Large-scale functional networks exhibit a similar organization, with several studies documenting functional clusters or modules (He et al., 2009), highly connected hub nodes (Buckner et al., 2009), and high efficiency (Bassett et al., 2009). Both structural and functional networks appear to be organized on several hierarchically nested scales (e.g. Meunier et al., 2009, Basset et al., 2010), with modules that are composed of smaller modules, a type of organization that may have deep implications for the complexity of neural dynamics. While graph theoretical tools have now been widely employed in the human brain, it should be noted that the interpretation of graph metrics in the context of neuroscience sensitively depends on the choice of nodes and edges (Rubinov and Sporns, 2010). In general, graph metrics are more easily interpreted in structural networks, where potential causal paths of information exchange can be unambiguously identified, while path-based metrics may yield spurious results in functional networks, particularly those based on pair-wise cross-correlation (e.g. Muskulus et al., 2009). An exciting prospect, and one that is directly relevant to the main topic of this article, is the use of graph-based approaches to investigate the relationship of structural to functional networks. This can be carried out within a neurocomputational model (Honey et al., 2007; Ghosh et al., 2008; Deco et al., 2009), where the structural coupling matrix is known and functional networks are derived from spontaneous or evoked dynamics, or by comparing imaging data that records structural and functional connectivity from the same set of human subjects (Honey et al., 2009). The availability of empirical data on both structural and functional connectivity allows an investigation of how much of the dynamic pattern of functional connectivity can be predicted from the underlying anatomy (Honey et al., 2010). Computational models of functional connectivity can reconstitute patterns of empirically derived functional couplings between brain regions to a significant extent (Fig. 1). While these results argue for a major role of the anatomy in shaping functional interactions, they should be viewed as indicative of
192
V.K. Jirsa et al.
Fig. 1. - (A) Scatter plot of functional connectivity between 66 cortical regions covering both cerebral hemispheres derived from a set of empirical observations of resting-state fMRI (“rsFC empirical”) and from a computational neural mass model (“rsFC nonlinear model”). The correlation between empirical and modeled functional connectivity is strong and highly significant (r = 0.70, p < 0.001). (B) Connection profiles for structural connectivity (“SC”) as well as empirical and modeled functional connectivity (“rsFC”) for a single region, the posterior cingulate cortex in the right hemisphere. Note the high correlation between all three profiles. Data replotted from Honey et al. (2009).
a dynamic, not a static, relationship. Modeling studies, reviewed in more detail below, clearly demonstrate that functional connectivity is constrained but not rigidly determined by the topology of anatomical linkages, and that functional connections form a rich repertoire of actual or potential couplings that greatly expands upon the relatively limited set of direct anatomical connections. The richness and diversity of functional connectivity is a major challenge for our understanding of structure-function relationships in the human brain.
Principles of multiscale modeling in brain networks Empirical research motivates a computational approach that is mindful of the presence of repeating patterns of structural (Nunez, 1997) and topological (Meunier et al., 2009; Basset, 2010) principles of organization across a recursive hierarchy of spatial and temporal scales. In this regards, computational neuroscience may have much to benefit from the
physical sciences, where multiscale dynamics have been identified and studied in a variety of complex systems – particularly in the field of “critical phenomena” (Amit and Martin-Mayor, 1984). One can identify three potential approaches to this challenge. The first approach parallels that taken in the physical sciences, by explicitly employing a unifying multiscale framework (Breakspear and Stam, 2005; Fusi et al., 2005; Kiebel et al., 2008). That is, a recursive set of scale-specific governing equations are specified, with a single underlying rule that links each scale iteratively with the next. In physical settings, such as fluid turbulence and magnetization, this has been seamlessly achieved within an elegant mathematical framework called the “renormalization approach” whereby a single scaling operation, the renormalization group, can be identified and written down (Wegner and Houghton, 1973). Critical phenomena, such as phase transitions and spatiotemporal chaos, occur when this scaling factor is close to unity – implying self-affinity amongst the tiers of the hierarchy. A phase transition towards macroscopic phenomena and large-scale correlations occurs rela-
towards the virtual brain
tively rapidly (as in the onset of magnetization) if, under the action of a tuning parameter, the scaling factor passes from below to above unity quickly. Conversely near-criticality may robustly occur if the scaling factor is close to unity in a broad region of parameter space. This may be of special significance in neural systems, where evidence for criticality has been observed in in vitro tissue culture (Beggs and Plenz, 2003), as well as in vivo in primate cortical activity (Petermann et al., 2009). Furthermore, evidence of strong large-scale correlations has been reported in human resting state brain rhythms (Freyer et al., 2009). Similarities to the formal renormalization approach appear in multiscale neuronal models in both the spatial (Breakspear and Stam, 2005) and temporal (Fusi et al., 2005; Kiebel et al., 2008) domains although they differ in the degree to which they have been explicitly mapped onto neuronal substrates. For example, Fusi et al. (2005) appeal to synaptic processes occurring over different time scales, whereas Kiebel et al. (2008) propose a mapping between time scales and bottom-up anatomical substrates of the human cortex. In complex physical systems (such as turbulence) spatiotemporal structures emerge dynamically from a substrate (such as water) that has no macroscopic structure in the absence of an energy flux. In contrast, different scales of the cortical hierarchy arguably do have scale-specific rules of organization which exist, to varying degree, alongside the dynamics which they support. This challenges the notion of a single multiscale framework for brain dynamics. A more pragmatic approach to the preceding one might be termed the “multiscale minded” approach and is embodied in many large-scale models of the human brain (Deco et al., 2008; Breakspear et al., 2010). By this, we mean modelling approaches that engage brain dynamics predominantly at one particular scale, but are nonetheless cognizant of processes at adjacent finer and/or coarser scales. An overarching principle is the technique of scaling up from small to large-scales not by brute force, but rather by dimension reduction techniques – such as the mean field approximation – that allows details at one scale to be embodied in fewer degrees of complexity at the next (for review, see Deco et al. 2008; Breakspear and Knock, 2008). In this way, processes at small scales – such as the time scales of dendritic filtering – can nonetheless enter as parameters at coarse scales (e.g.
193
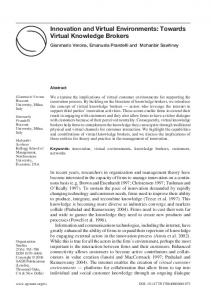
Robinson et al., 2004). Similarly, we advance the notion of “digging down” from coarse to finer scales by adding specific details – such as synaptic plasticity – in order to test specific hypotheses – such as their contribution to dynamic neuronal assemblies in cortical-like ensembles (Rubinov et al., 2010). In this way, no particular scale is afforded a privileged status but rather multiple scales are seen to operate in a mutually interdependent manner. Moreover, depending on the exact requirements, computational loads for model implementation are relatively light, ranging from what could be deployed on a laptop computer, to something that may require several days on a modest server, allowing a rapid exchange between theory, experiment and hypothesis. What are the implications if the multiscale nature of brain dynamics is not considered? The answer to this question may be found in the outcome of the various large projects that are premised in a third approach towards models of large-scale neuronal systems that may be termed the “brute force” approach – that is of building very large computational ensembles of spiking neurons. For example, the “Blue Brain” project aims to incorporate the detailed three-dimensional morphology of individual neurons, their ion channel composition, the distributions and electrical properties of different neuronal classes and their relative proportions into detailed models of neuronal microcircuitry (Markram, 2006). These detailed microcircuits are then considered the elementary building blocks of increasingly larger – but not coarser – scale models, as computational resources permit. The lack of an explicit multiscale architecture entails several drawbacks. These models are extraordinarily difficult to implement, requiring advanced supercomputing, and their output can be difficult to interpret as the complexity of the model approaches the complexity of the brain itself. These three approaches are outlined in Fig. 2. At this stage, we propose that the principles exemplified in the second approach represent the optimal trade-off between complexity and tractability. Crucially, their very abstraction – which some may regard as a compromise – provides the key mechanism for testing scale-specific hypotheses concerning neurobiological mechanisms. That is, the presence or absence of a particular detail in two otherwise identical models allows one to infer, using appropriate model comparison techniques (Friston et al., 2007) precisely whether
194
V.K. Jirsa et al.
Fig. 2. - Schema of three approaches to dealing with the brain’s multiscale complexity: Approach I (multiscale framework) incorporates intra- and inter-scale principles of organization over a hierarchical tier (j = 1, 2,…, N) of dynamics. Approach II (multiscale-minded) takes a pragmatic approach to the dynamics of a particular scale, whilst also incorporating smaller scale processes (left) and also remaining aware of processes at smaller scales that may be lost during the mean field reduction (right). Forward models allow specific such models to be tested with model inversion schemes. Approach III (brute force) incorporates biologically validated information at the microscopic scale of the cell compartment and has the objective of large-scale simulation through massive parallel computation.
that mechanism is required for the observed phenomena of interest. By employing such an approach, together with dimension reduction approaches, one can construct increasingly sophisticated – but not necessarily more complicated – generative and hypothesis-driven models for different data sets.
Spatiotemporal dynamics arising in brain networks Brain networks are nonlinear spatiotemporal dynamic systems that are characterized by the fact that they are comprised of cortical and subcortical networks.
towards the virtual brain
Due to their spatial separation and finite transmission speeds, communication between brain regions includes time delays, which is in sharp contrast to communication in local networks where these delays are negligible. The coupling between any two regions in a brain network is a function of the connection strength, their symmetry (or direction) and the time delay. These properties are referred to as the space-time structure of a given coupling where space refers to the coupling strengths and time to the associated delays. From previous work (Honey et al., 2007; Ghosh et al., 2008a, 2008b; Deco et al., 2009, Cabral et al., unpublished) it appears that the spacetime structure of interregional couplings is the crucial component of brain network dynamics, at least as far as resting state dynamics is concerned. When the intrinsic dynamics of a network node is manipulated, the resulting brain network dynamics remains invariant under these changes, whereas manipulations of the space-time structure of the couplings result in profound functional reorganization. For these reasons it is worthwhile to take a closer look at the effects of such manipulations, and to illustrate them with the help of some intuitive examples. The simplest case of coupling with time delay involves a recurrent connection within a linearly
195
stable neuronal population at rest. Mathematically this is expressed as
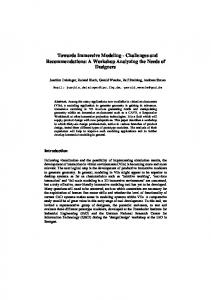
where x(t) is the time-dependent neural population activity, m the coupling strength and τ the time delay. When calculating the stability of the rest state of this population, stable and unstable regions are obtained as functions of m and τ as illustrated in Fig. 3. The stable region of the equilibrium is limited by two curves (the so-called critical lines), to the right by the vertical line at m = 1 which identifies the onset of a non-oscillatory instability, and to the left by the curved line, which identifies the onset of unstable oscillatory activity. The area in between these lines (traced out by three parallel lines) is the stable rest state of population activity, whereas dynamics outside the rest state are unstable. For this trivial example the space-time structure is just a point in the plane spanned by the coupling strength m and the time delay τ. Manipulation of the coupling’s space-time structure translates to navigation within this plane. If the time delay is negligible (τ = 0), then only variations along the horizontal line are possible
Fig. 3. - Stability diagram of a single neuronal population with delayed self-coupling.
196
V.K. Jirsa et al.
and oscillatory behavior is completely non-existent. The rest state can be left only through a non-oscillatory instability by increasing the coupling strength towards positive (excitatory) values. The introduction of a time delay enriches the dynamic repertoire and allows for oscillations in the neighborhood of the left critical line for non-zero time delay, that is τ = τc. The frequency ω of the oscillation is given by the coupling strength
and reflects a network property, specifically the coupling’s space-time structure, rather than a property of the neuronal population. The simplistic scenario of one neural population with a self-coupling may appear artificial. However, it is instructive since the same insights gained here are recovered in the case of two coupled neural populations. Consider two neural populations described by their activities x1 and x2, respectively,
the coupling strengths and the time delay τ. As in the previous situation of one population and selfcoupling, we find critical zones defining the borders between stable and unstable régimes. For τ = 0 the critical zone is a line indicating a non-oscillatory instability. When traversing this line from the stable to the unstable region by changing the coupling strengths, the neural population activity begins to grow exponentially, but does not oscillate. When the time delay is introduced, there are critical surfaces, indicated by SU in Fig. 4a, showing the critical values of the time delay τ = τc, at which the neural population activity begins to increase in an oscillatory fashion. The oscillation frequency is entirely determined by the network connectivity,
where the coupling strengths are denoted by m12 and m21. The regions of stability and instability of the resting state are indicated in Fig. 4 as functions of
The critical surfaces in Fig. 4a are two topologically disconnected surfaces. A simpler and more compact representation of this situation is obtained when we calculate the eigenvalue of the connectivity matrix, λ = a + ib, and display the stability zones as a function of the real and imaginary part of the eigenvalue (see Fig. 4b). Here the more complicated situation with multiple critical surfaces in Fig. 4a translates into one critical surface that converges towards a central cylinder as the time delay τ increases. This manipula-
a
b
Fig. 4. - Stability diagram of two delay-coupled neural populations. (a) The critical zones are plotted as functions of the coupling weights m12 and m21, and the time delay τ. (b) The critical zone is plotted as a function of the real and imaginary part of the eigenvalue of the connectivity matrix, as well as the time delay (see Jirsa and Ding, 2004).
towards the virtual brain
tion illustrates how a well-chosen transformation of the coupling’s space-time structure may simplify the system’s representation of stability zones. In the previous paragraphs we have illustrated two of the crucial effects when dealing with the spacetime structure of couplings: First, the introduction of time delays into a network enriches the network dynamics and creates behaviors that are absent otherwise; second, when performing appropriate manipulations of the space-time structure, we can generate simplified representations of the network behavior. This latter insight is relevant in the context of restoration of brain function. It suggests that an appropriate metric of the space-time structure of the coupling will allow us to perform informed manipulations thereof with the objective to navigate the brain network dynamics into desirable (that is healthy) parameter régimes. A concern that arises in this context is the availability of structural connectivity data. The anatomical database Cocomac, developed by Rolf Kötter (Stephan et al., 2001; Kötter, 2004) is unique in the sense that it contains directed connectivity data, whereas due to the nature of the measurements DTI/ DSI provides us only with non-directed estimates of anatomical connections. Does the absence of directed connectivity in these latter matrices pose a problem for the investigations of the space-time structure of coupling? To put it differently, what constraints does the artificial symmetry in the connectivity matrix as introduced by DTI/DSI impose? Knock et al. (2009) discussed the symmetry breaking effects of connectivity by means of a direct comparison of the functional organization between Cocomac and DSI-based connectivity data. In the following, we summarize the insights pertaining to the use of symmetric and asymmetric connectivity matrices. Reconsider the two neural populations with the coupling strengths m12 and m21 as we discussed above, but now write m12 = m and m12 = m + ε. If ε = 0, then the connectivity matrix is symmetric, else it is asymmetric. The stability of the rest state of the network of two populations with no time delay is actually determined by the condition
When the degree of asymmetry is sufficiently small, ε