Performance Modeling for Virtual Network based Service Provisioning* M. El-Darieby1, J. Rolia 2, D. C. Petriu 1 Dept. of Systems and Computer Eng. Carleton University Ottawa, ON, K1S 5B6, Canada {mdarieby, petriu}@sce.carleton.ca 1
2
Internet and Mobile Systems Lab Hewlett-Packard Labs Palo Alto, CA, 94040, USA
[email protected]
Abstract One of the goals of Network Service Providers (SP) is to provision efficiently value-added networking services to their end users. The services may have different duration, connectivity, and Quality of Service (QoS) requirements. An SP meets such requirements by exploiting various routing and management mechanisms for edge and core networks. We focus on network services that require the establishment of Virtual Networks (VN’s). This paper considers a VN creation architecture based on Multi-protocol Label Switching (MPLS). MPLS is one approach for implementing VN's that enables programmability for network infrastructure and hence the creation of value-added services. An analytic performance model is developed to assess the scalability of the architecture as the underlying physical network infrastructure evolves. The model we present describes only coarse features of the architecture, yet offers insights regarding its performance and scalability. In particular we assess the impact of a flat versus hierarchical MPLS mechanism on the response time of service creation. Keywords Virtual Networks, Service Provisioning, Performance modeling, QoS, MPLS, Layered Queuing Networks.
1. Introduction Virtual networks (VN) offer the opportunity to treat a collection of geographically remote devices as if they are part of a private network. Group communication, workflow management, and commerce applications can all benefit from VN's. From an end-user's perspective VN's simplify application development and management. They enable legacy applications to operate across corporate boundaries. *
To appear in the Proceedings of IM’2001 IFIP/IEEE International Symposium on Integrated Network Management, Seattle, Washington, USA, May 14-18, 2001.
Provisioning VN's is an important objective for the telecommunications and computing industries. A competitive differentiator between Network Service Providers (SP) will be the ability to provision virtual network services efficiently [1]. These services may have different duration, connectivity, and Quality of Service (QoS) requirements. An SP meets such requirements by exploiting various routing and management mechanisms for edge and core networks. In [8] we built an analytical performance model for the whole process of provisioning VN-based services, and found that the software bottleneck for the system is the establishment of VN. In this paper, we study an architecture for creating VN-based services using Multi-Protocol Label Switching (MPLS). The architecture is based on the Traffic Engineering extensions to RSVP [7]. It offers a flat approach that implements VN's using core network connections directly. Furthermore we also consider the effect of aggregating RSVP messages as described in [3]. This represents a hierarchical approach for allocating VN's that multiplexes multiple VN's onto core network connections. An analytical performance model is developed for service creation within the architecture and used to assess performance as the underlying physical network evolves. The model should help answering the following questions: a) How do increases in size of physical networks and VN's affect the service creation performance under different loads? b) How sensitive is service creation performance to various architectural parameters? These parameters include the number of Autonomous Systems (AS) and the average number of routers within an AS. Section 2 describes a taxonomy of VN creation models and provides scenarios for flat MPLS-based VN creation. Section 3 uses the scenarios to develop a performance model for MPLS-based service creation architecture. Section 4 offers comparative results along with concluding remarks in the following section.
2. Network services and Virtual Networks 2.1. IP VN creation models Internet Protocol-based VN’s are created using the following models: • Flat models: where a set of end-to-end tunnels is established among different end devices. • Hierarchical models: which allocate VN's within other VN's [2], [5]. The flat models are further sub-divided into two categories depending on which part of the infrastructure is responsible for provisioning the VN. In premise-based flat models, a VN is created at the user's premises, for example at an individual's PC or behind a corporate firewall. The network is unaware of the VN, it acts only as a raw transport mechanism. For the network-based flat model, the status of the VN is maintained in the network. The network may provide QoS and security mechanisms as part of its transport services. L2TP [14], MPLS [9] and IPSec [10] are standard protocols that follow the flat model. They operate at Layer 2, Layer 2.5, and Layer 7 of the OSI reference
model, respectively. L2TP establishes tunnels that enable remote users to access remote sites privately. It relies on the negotiation between two processes that run at either the customer premises or at edge routers. MPLS tunnels are established between edge routers. The IETF has proposed RSVP extensions to MPLS [7] that enable the allocation and reservation of network resource for specific flows, thus providing QoS guarantees for the whole VPN. In IPSec, all data packets are encrypted at the user premise and will be decrypted only at the destination points. Others use firewalls to provide private access to important data.
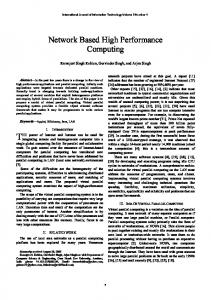
2.2. MPLS-based VN provisioning In this paper we focus on MPLS because it has the following advantages: It provides QoS guarantees through allocating the required network resources using signaling protocols (e.g. RSVP [13, 4], LDP-CR [15]). • MPLS tunnels can be multiplexed together into other larger tunnels [6]. This is an aspect of hierarchical VN provisioning. Thus, we consider a "bundled" MPLS tunnel to have aspects of both VN creation models. • It supports and enables the network infrastructure programmability. • MPLS integrates layer 2 switching and layer 3 routing and consequently it supports multi-protocols networks (e.g. IP, ATM or Frame Relay). A VN is created by setting up one or more MPLS tunnels. Each tunnel is known as a Label Switched Path (LSP). A request for setting up an LSP is received at an ingress router of an AS. The request is forwarded through Label Switching Routers (LSR) downstream all the way to an egress router. In order to support QoS guarantees, ingress routers specify an Explicit Route (ER) [7] that the MPLS path setup messages follow. An ER is the best candidate route that meets specific QoS constraints (e.g. delay, jitter and bandwidth requirements). To calculate the ER, the ingress router should have information about the current status of the network (e.g. topology and utilization). This information can be piggy-packed in status-update messages exchanged among routers. MPLS setup messages allocate required network resources in the routers along the ER and, consequently, establish a QoS-capable LSP. Two proposals for standards for these setup protocols are: 1) Constraint-Based Routing Label Distribution Protocol (CR-LDP) [15] and 2) Traffic Engineering (TE) extensions to the Resource reSerVation Protocol (RSVP). Figure 1 shows the scenario to create an MPLS path for the MPLS + RSVP case. The figure includes numerical estimates for the mean execution time of each operation (in msec). The scenario is as follows: 1. A VN management process, at the premises of the VN provider, receives a request to establish a VN. The request specifies the connectivity of the endpoints (e.g. access points of the end users) of the VN. 2. The VN process selects the AS's to be traversed by each LSP (using a shortest path algorithm, for example). Here we assume the best-case scenario of having enough resources available in each AS. •
3. Bandwidth brokers of the selected AS's are consulted to check resource availability. AS’s are consulted in parallel. 4. Within each AS, an ingress router calculates the ER, and starts sending PATH messages to LSR’s. 5. Each involved LSR checks if it has enough resources for that LSP, and if so (which is the case we assume here), it forwards another PATH message to the next LSR in the ER. 6. Step 5 is repeated till the PATH message reaches the egress router. 7. At the egress router, the PATH message is processed, resource availability is checked and a new label is allocated. This label is used to construct a VN ID. 8. The egress router sends back RESV messages to its preceding LSR's. 9. Each LSR processes its RESV message and allocates a new label for that LSP. It confirms the resource reservation for the LSP, and forwards a RESV message to the LSR from which it received the PATH message related to this flow. 10. Receiving the RESV message at the ingress router indicates that the creation of the LSP was completed. 11. Steps 2- 10 are repeated for all the LSP’s that connect the end points. 12. The provisioning of the service is completed and the users can start sending data. VN
BB
Ingress
RSVP agent 1
RSVP agent N
Egress
VN creation request 1.. Model end points connectivity ≈ 33.22 2. Select AS’s ≈ 12 yes
3. Admission control ≈ 46
Allocate resources 4. Calculate ER ≈ 21.06 4. PATH message = 2 5. Check resources ≈ 3.6 5. PATH message 5. Check resources ≈ 3.6 5. PATH message =2 7. Check resources ≈ 3.6 7. Bind Label ≈ 0.285 8. RESV message = 3.6 9. RESV message =3.6 9. RESV message =3.6 Positive acknowledgment
10. Establish LSP
Figure 1: UML Scenario Diagram for creating an LSP
Afterwards, the functions of service management have to be applied for the duration of the ser vice to ensure the conformance of both the user and the service provider to the Service Level Agreement.
2.3. Related Work The criteria for evaluating VN implementations involve their connectivity, management, QoS, and security features. Here, we present a layered queuing model (LQM) [4] for an MPLS-based architecture that creates VN’s. The
architecture exhibits features of flat VN provisioning and hierarchical VN provisioning via the bundling of MPLS paths. In [12], issues related to the switchlets-based automatic creation of VN's are examined. The author considers how users should specify their requests for a VN and how a VN provider may maximize his/her resource usage. She shows that automated VN creation is a feasible procedure that is well suited for both the end user and the VN provider. The author also investigates the performance of the search of network topology and how it may be enhanced using a simple heuristic. In [7], the performance of RSVP-based flow creation using a mathematical model is studied. The model is validated against a simulation model. A Fast Establishment Mechanisms that aims at speeding up the creation of these flows is proposed and evaluated. In [16], the authors examined the end-to-end delay bounds incurred by a data packet traversing the access and core networks. Schemes to reduce that delay are proposed and evaluated. Also, the author studied a flow aggregation scheme and analyzed its blocking probability.
3. System Modeling for Performance Analysis 3.1. Performance Metrics & Models In this paper we are concerned with the mean response time of the service creation processes involved in creating a service as performance measures. The response time includes the response time of the network and of the software processes that participate in the service. There are two widely applied approaches to analyze the performance of a system: a) use performance measurements from a controlled testbed, or b) use predictive models. Measurements techniques are more accurate, but usually consume more time and costs, and presume that the system or a substantial prototype exists. On the other hand, estimates from performance models can often reveal performance blunders [4] and provide feedback for making system design decisions even before prototypes exist. We follow the latter approach. Analytic and simulation models are complementary alternatives for predictive models. We focus on analytic models to gain some insights into system behavior prior to the development of more detailed simulation models. In this paper, we develop a Layered Queuing Model (LQM) [4] for the creation of a VN. The model takes into account the impact of user connectivity and LSP creation based on MPLS + RSVP (as described in section 3). The model includes mean resource demand estimates for every operation (as given in Figure 1). Layers of software processes that consume network, processor, and disk resources process user requests. Memory and buffer resources are not considered in the model. An LQM modeling tool [4, 17] was used to model the VN creation scenario, described in Section 2.2 and Figure 1. The models rely on the tool's ability to describe the organization of system components (hardware and software) as hierarchical packages. The number of replicates of each package is easily
controlled as a parameter of the model. For example an ingress router and its underlying hardware can be a package. As the workload for a system increases we can increase the number of these servers by increasing the replicates of this server's package. The visits to the server are divided equally across the replicates. The tool is computationally efficient; increasing the number of replicates does not actually increase the size of the model to be solved [4] so that solution times remain small – a few seconds for each of the models considered in this paper. The solution of LQMs is beyond the scope of this paper. In general the layered model is decomposed into a series of queuing network models (with servers representing hardware resources and software processes) that are solved iteratively using the Mean Value Analysis technique to provide performance measures for the system as a whole [17, 4]. The results we present rely mainly on the LQM tool's ability to sum up resource demands for scenarios and to compute utilizations in the presence of package replication. Response time measures for scenarios are largely affected by a computation for the expected maximum of the response time of parallel activities. The tool relies on standard methods for computing this value. In this paper we focus more on the challenge of describing an appropriate and useful model rather than on the underlying analytic solution mechanisms. Furthermore the LQM model could be solved by using discrete event simulation.
3.2. LQM Performance Model for MPLS-based VN Figure 2 shows the LQM model for an MPLS-based flat model for creating a VN. It represents the software architecture of the system and its demands for hardware resources (in our case, for network and processor resources). It shows how the LQM is used to model the Traffic Engineering extensions to RSVP as a set of packages and software processes. The components of the model are organized in hierarchical packages. This provides a modeling abstraction that aggregates related subsystems, nodes, networks and processes together. The model consists of a parent package System that groups all other packages. It contains a SP node and the federated_network package. The SP node models the behavior of the service provider. The SP node contains a user process for modeling the arrival of requests for VN creation and a VN management process for accepting such requests. The federated_network_package contains a network_manager node and several AS packages each representing different autonomous systems. The network_manager node is responsible for maintaining a DB that characterizes the topology and performance of the network. Its network mgmt process interacts with each AS to get timely performance information about the AS and forwards it to the VN management processes so they can make provisioning decisions directly. Note this approach is more scalable than the simple scenario of Figure 1.The Replication Factor (RF) represents the number of AS's in the system and controls the aggregate size of the physical network under study.
SP
RF: Replication factor BB: Bandwidth broker
User System
A node A process
VN mgmt
Net Manager
Federated Network
Net Mgmt.
Net2 RF =# AS
AS RF =# LSR’s traversed by the ER
Edge Router BB Ingress
Edge Router LSR
RSVP agent
RSVP agent Egress
Net1
LSR
LSR
RSVP agent
RSVP agent
BB Ingress RSVP agent Egress
Figure 2: Software Architecture of an MPLS-based VN creation system S/W processes and their hierarchical architecture An AS package Figure5: contains the physical Edge_Router and LSR packages. The number of LSR packages controls the physical size of each AS. The interactions among these packages are carried through networks that are represented by the two entities net1 and net2. An Edge_ router provides its functionalities through the following server processes: 1) Bandwidth Brokerage (BB) 2) Ingress, 3) Egress, and 4) and RSVP_Agent. Each LSR runs an RSVP_Agent process that processes and exchange RSVP messages. Each of the nodes (entities) is characterized in terms of the CPU processing speed and the speed of Input/Output operations. Each of the processes has an average service demand for the scenario. The effect of the delays caused by network latencies for communication among the subsystems is also taken into consideration. Network latencies are parameters for the model; we assume per byte latencies of 0.0001 msec that correspond to 10 Gbps links. One of the most difficult tasks when building predictive performance models is to estimate the resource demands for each process per scenario. Our estimates are based on measurement results reported by other researchers for the OSPF protocol and the label allocation mechanism in MPLS [13]. We have used these results to estimate the CPU service demands for processing the PATH and RESV messages as 2 ms and 3.6 ms, respectively. In [13], the authors give estimates for the label allocation time (based on simulation experiments) for different MPLS label allocation mechanisms. In our
model, we used the average value for the downstream on-demand label allocation mechanism, which is approximately 0.285 ms. The purpose of this paper is to describe our overall modeling approach. Our goal with parameter estimates has been to capture order of magnitude differences. Actual parameter values will be different for different product configurations. Even the ratios of CPU demand to network latency will change as technology evolves. We have the intention to validate these estimates through detailed simulation experiments and measurement of a prototype implementation of TE extensions to RSVP. Regardless, the models can be used to study the sensitivity of system behavior to the CPU service demand and network latency estimates. The requests among processes are shown in Figure 2. The user node visits the VN management process once per each VN creation request. The latter uses the information periodically received from the Network mgmt process to decide which AS will be used for the VN. Then, the VN management process visits the Ingress process of each EdgeRouter in each chosen AS (these visits are done in parallel). The Ingress process forwards a PATH message to the first LSR in the Explicit Route (ER). Each LSR in the ER will forward a PATH message to the next LSR, and so on. The last LSR forwards a PATH message to the RESV_agent of the egress router. That agent processes the message and visits the Egress process of the same router. The Egress process forwards a RESV message to the preceding LSR. Each RSVP-agent of each LSR processes the RESV message it receives and forwards another one to the LSR preceding it. This is repeated till we reach the RESV_Agent of the ingress router. The latter process visits the Ingress process of the edge router. Then, the VN management process is notified of the admission of the request for VN creation. We are assuming that no critical resources (such as operating system threads) are held by a process while waiting for a reply for a forwarded message. The time taken to create an LSP is the summation of the main processes described in the above scenario. That is, the time for VN creation is equal to the time taken to model user connectivity plus the time taken to establish the resulting LSP in the AS's. We consider the processing performed in different AS's to be asynchronous (i.e., performed in parallel). LSP establishment time for the VN is the maximum establishment time over all the AS involved in the VN. Computing end-to-end user connectivity depends on the number of AS in the physical network. We have assumed that a network management process maintains a database that reflects the status of the network. The database is populated and its contents updated through the BB processes of the different AS's. Computing connectivity uses a routing algorithm to determine the AS's to be traversed by the LSP. The time to establish an LSP in an AS consists of the time to calculate the ER within each AS plus the time to send and process PATH and RESV messages. The response time to calculate the ER depends on the response time of a shortest path routing algorithm (e.g. Dijkstra's). The complexity of the algorithm is O(n.log(n)), where n is the number of physical routers in an AS. The algorithm determines the
number of LSR's (hops) in the ER. This affects the time of establishing intra-AS LSP as it determines the number of RSVP messages exchanged to build the LSP. Consequently, we have considered the following architectural parameters as experimental factors: • The number of AS traversed by an LSP, taking the levels of 2, 4 and 6. This value grows with the size of the physical network. • The average number of LSR's traversed by an LSP within an AS, with levels of 6, 10, and 20. This also grows with the size of the physical network. We have set the total number of LSR's in an AS to be 40 routers. That is because we considered an AS to be an OSPF domain. The OSPF literature advises not to have more than 50 routers per such domain. We have, also, considered a physical network of 10 AS's. The service times we have shown in Figure 1 are calculated for the final values of these factors (i.e. 6, and 10, respectively). In order to represent workload intensity, we have considered the number of user nodes to be the third experimental factor. It takes the levels 2, 25, and 50 nodes with 60 users per node. Users are service provider entities that alternate between requesting VNs and thinking for 60 seconds. Each corresponding ingress router receives VN creation requests at that intensity. Furthermore, the net mgmt process acquires state information from each BB every 60 seconds and forwards it to all VN processes so they can make their selection of AS when establishing a VN. We solve the model for all factor combinations and calculate the effect of the experimental factors on different parts of the model. The changing factors reflect the scaling of the network. The resource demands of the various subsystems depend on the above factor levels. For example they affect the service demand of Dijkstra's algorithm. The model assumes that all LSP's are statistically identical in terms of the number of physical routers. Also, it assumes that each path within an AS traverses the same number of routers, and that each router is visited, on average, by an equal number of paths. We divide the visits among replicas of software processes for the AS's and their routers. Therefore, each process will receive, on average, an equal number of messages. This is a best-case scenario for the network in that load is evenly divided across routers and its processes. Another assumption is that we consider only the scenario where resources are always available to admit new requests for VN creation. This is also optimistic. Future work will model in more detail the problems of resource allocation and admission control with the help of simulation models.
3.3. Hierarchical Tunnels MPLS tunnels can be multiplexed (i.e., "bundled" together) into larger tunnels [6]. We consider "bundled" MPLS tunnel to have both flat and hierarchical properties of VN creation models. First, network resources are allocated using RSVP to
establish the larger tunnel; smaller tunnels are then allocated appropriate portions of these resources [16]. Bundling should enhance the scalability of LSP establishment and reduce the response time to establish new VN's. This is because the RSVP mechanisms within an AS are only exploited to create the larger tunnel. Establishing smaller embedded tunnels does not result in the extensive message exchange of the original RSVP proposal. RSVP does not provide mechanisms to aggregate individual reservation sessions into a single reservation [11] so alternative approaches are needed. In [3], an approach is proposed to solve this problem. An aggregation region is defined as "a contiguous set of RSVP routers that are capable of performing RSVP aggregation along any possible route through this contiguous set." An aggregation region has two LSR routers known as aggregator and deaggregator that operate as its ingress and egress routers, respectively. The "aggregating" router is the first router that processes the PATH message as it enters the aggregation region. The "deaggregating" router is the last router to process the PATH as it leaves the aggregation region. Interior routers perform neither aggregation nor deaggregation. An aggregate reservation is established between the aggregator and the deaggregator. The aggregate reservation is a larger reservation that carries the traffic of a large number of smaller flows. Only the aggregator and the deaggregator maintain state about the flows that are carried by the interior routers. In [3], the authors described a mechanism to identify the aggregator and the from Aggregation Area
RF =# interior routers
Ingress
LSR
LSR Aggregator RSVP agent
LSR
LSR
LSR
FE
FE
FE
Aggregator RSVP agent Deaggregator
Deaggregator Net1
Figure 3: Software representation of the TE-extensions to RSVP
deaggregator within an AS. They also described a signaling scenario to establish an aggregate reservation between them (i.e. a tunnel). The aggregation of messages is accomplished by having the aggregator router change the IP Protocol Number in the PATH message from RSVP to RSVP-E2EIGNORE. This causes interior LSR routers to forward these messages as normal IP packets (no router control-plane message processing required). The deagregator router restores the IP Protocol Number in the PATH message to RSVP and forwards it to other LSR's outside the aggregation area. Thus, the aggregator router considers the deaggregator router to be the next RSVP hop, regardless of the
Response time (msec)
number of interior LSR's between them. As the deaggregating router receives a RESV message, it makes the same changes described above, causing the interior routers to forward the RESV message as an IP packet. Only the aggregator router processes the RESV messages. That is, the deaggregating router perceives the previous RSVP hop to be the aggregating router. In this paper we consider the scenario where aggregate reservations (tunnels) are pre-established by ASs between all aggregator and deaggregator routers within their aggregation areas and that they have enough resources to admit requested VNs, as described in appendix 2 in [3]. To represent message aggregation in the LQM, shown in Figure 3, we added the aggregation_area package as a child package of the AS package. We have added three new processes that run on LSR nodes. These are: the aggregator, deaggregator and Forwarding Engine (FE) processes. We assumed the time to forward a packet to be negligible with respect to message processing. Other assumptions are as follows: the aggregation and deaggregation processes take the same time as an RSVP-agent in the above scenario; an aggregation area cannot span more than one AS. We have considered two other cases: one with four aggregation areas where each area covers one quarter of an AS, and one with a single aggregation area that covers the AS completely. These cases are considered in addition to the case with no aggregation, as discussed in section 4.2. Aggregating several end-to-end reservations that cross an aggregation region into one larger reservation has potential for better scalability, but it also presents disadvantages. Only the aggregator and deaggregator maintain state for the different tunnels. This increases the probability of call blocking at the aggregator routers and of inefficient bandwidth assignment. It also increases the load on these routers because they have to process more state refresh messages. In our model we assume that each BB sends refresh messages to its AS’s aggregator routers every 60 seconds. Another disadvantage is that a centralized aggregator/ deaggregator 2500
No AA
Many AA's
One AA/AS
2000
1500
1000
500
0 # LSR's 6 # AS's 2 # user nodes 2
10 20 2 2 2 2
6 4 2
10 20 4 4 2 2
6 6 2
10 20 6 10 20 6 10 20 6 10 20 6 10 20 6 10 20 6 10 20 6 6 2 2 2 4 4 4 6 6 6 2 2 2 4 4 4 6 6 6 2 2 25 25 25 25 25 25 25 25 25 50 50 50 50 50 50 50 50 50
Figure 4: Response time for the user process with 1 CPU for the Edge Router
for an entire aggregation region may constitute a single point of failure in the system.
4. Results and Conclusions Figure 4, 5, and 6 show the results of solving the LQM models for creating an LSP with the three different configurations of aggregation areas. These are 1) the LSP must choose between all LSRs (no aggregation area) within an AS; 2) the LSP exploits tunnels of 4 aggregation areas; and 3) the LSP exploits one tunnel to span the entire AS. The figures shows the results as the three experimental factors, represented along the x-axis of each figure, change. Figure 4 shows the response time for creating an LSP as perceived by the user process. The response time depends a great deal on the number of network elements traversed by an MPLS path; it increases with the number of LSR's and the number of AS's. The experimental factor LSR (i.e., the number of routers traversed by an LSP) affects the performance dramatically. From Figure 4, for the case of 4 AS's and 25 user nodes the response time grows from 194, to 264, to 627 msec as the number of LSR's increases from 6, to 10 and to 20 for the no aggregation area configuration. Also in Figure 4, the number of AS's traversed by a path affects the response time, but in a lesser way than the number of LSR’s. For the case of 6 LSR's and 25 user nodes, the response time grows from 139, to 194, to 237 msec as the number of AS's grows from 2 to 4 to 6 for the no aggregation area configuration. This demonstrates the sensitivity of VN creation time to the number of AS. It is governed by the expected maximum of LSP creation times within each chosen AS. As global networking connectivity for the Internet grows one can only expect SP’s to require support from multiple AS causing longer VN creation times. Aggregating MPLS paths pays off for larger networks under high workload. This is expected due to the reduction in the number of messages exchanged. For example, for the case of 20 LSR's, 6 AS's, and 50 user nodes the response time is reduced from 2483 msec with no aggregation involved to 1054 msec if the LSP 0.9
No AA
Many AA's
one AA/AS
0.8 0.7 0.6 0.5 0.4 0.3 0.2 0.1 0 6 10 20 6 10 20 6 10 20 6 10 20 6 10 20 6 10 20 6 10 20 6 10 20 6 10 20 # LSR's 2 # AS # user nodes 2
2
2
4
4
4
6
6
6
2
2
2
2
2
2
2
2 25 25 25 25 25 25 25 25 25 50 50 50 50 50 50 50 50 50
2
2
2
4
4
4
6
6
6
2
2
2
4
4
4
6
6
6
Figure 5. CPU Utilization of the Edge Router (one CPU per node)
Response time (msec)
traverses four aggregation areas (tunnels) per AS. It is further reduced to 595 msec when each AS is an aggregation area (one tunnel is used). As the resource demands grow, increasing the arrival intensity of requests causes increases in queuing for physical and logical resources leading to larger response times. The performance model helps to illustrate how such combinations affect service performance. Detailed performance results show the edge router CPU is the system bottleneck (it has the highest utilization). Software process threading levels of 10 were adequate to avoid software bottlenecks for the experimental factors considered. As shown in Figure 5, the utilization of the edge router CPU is dependent only on the number of user nodes (and almost independent of other factors). It is almost independent of the number of AS chosen for the VN. It increases from 5%, to 40%, to 80% as the number of user nodes increases from 2, to 25, to 50 nodes. Next we consider introducing two CPU in each edge router. As expected this reduces the CPU utilization by approximately 50% of the values shown in Figure 5. This has a substantial impact on the response time of the user process as is shown in Figure 6. This shows how important processor queuing can be in such systems. Note also that with two CPUs, the per thread utilization of the edge router processes also decreased because less time was spent waiting in the CPU queue. As a result the same number of threads can serve a greater workload intensity. To summarize, these results comply with the well-known fact that the RSVP reservation does not scale well. We modeled the aggregation (or "bundling") of several end-to-end reservations that cross an aggregation region into one larger reservation. The LQM results show that such aggregation enhances the scalability of the path establishment and reduces the response time to establish new VN's, due to the fact that the RSVP mechanisms within an AS are only exploited infrequently to create the larger tunnels. In our future work we plan to introduce further detail into the models and validate them through simulating the process. Simulations will help us to represent cases in 1600
No AA
Many AA's
One AA/AS
1400 1200 1000 800 600 400 200 0
# LS R's # AS's # user nodes
6 2 2
10 20 2 2 2 2
6 4 2
10 20 4 4 2 2
6 6 2
10 20 6 10 20 6 10 20 6 10 20 6 10 20 6 10 20 6 10 20 6 6 2 2 2 4 4 4 6 6 6 2 2 2 4 4 4 6 6 6 2 2 25 25 25 25 25 25 25 25 25 50 50 50 50 50 50 50 50 50
Figure 6. User response time for the case with 2-CPU Edge Router node
which the resources required for an LSP are not always available; to compare different resource allocation algorithms; and to explore the impact of hierarchical VNs on call blocking and the inefficient use of network resources. We plan to use the analytic models to narrow the experimental design space for simulation.
Acknowledgements The authors wish to thank Communications and Information Technology Ontario (CITO) for financial support and to the reviewers for their helpful comments.
References [1] [2] [3] [4] [5] [6] [7] [8] [9] [10] [11] [12] [13] [14] [15] [16] [17]
A. Lazar, "Programming telecommunication networks," IEEE Network, Vol. 11, No 5, September 1997. D. Awduche, L. Berger, D. Gan, T. Li, V. Srinivasan and G. Swallow; "RSVP-TE: Extensions to RSVP for LSP tunnels," Internet Draft . F. Baker, C. Iturralde, F. Faucheur and B. Davie, "Aggregation of RSVP for IPv4 and IPv6 reservations," Internet Draft . J. Rolia and K. Sevcik, "The method of layers,'' IEEE Transactions on Software Engineering, vol. 21, no. 8, August 1995. J. Touch and S. Hotz, "The X-Bone," in the 3rd Global Internet Mini-Conference in conjunction with GlobeCom, Sydney, Australia, 1998. K. Kompella and Y. Rekhter; "LSP hierarchy with MPLS TE," Internet Draft . L. Mathy, D. Hutchison and S. Simpson, "Modeling and improving flow establishment in RSVP," in the IFIP 6th international workshop on Protocols for High Speed Networks, Salem, MA, August 1999. M. El-Darieby and J. Rolia, "Performance modeling of a service provisioning design," in Lecture Notes in Computer Science, vol, 1890, Springer-Verlag, 2000 M. Gibson, "The management of MPLS LSP’s for scalable QoS service provision," Internet Draft . S. Kent and R. Atkinson, “Security Architecture for the Internet Protocol,” RFC 2401, November 1998. R. Braden, L. Zhang, S. Berson, S. Herzog and S. Jamin, "Resource reservation protocol (RSVP) version 1," RFC 2205, September 1997. R. Isaacs, "Lightweight, dynamic and programmable virtual private networks," in 3rd IEEE Conference on Open Architectures and Network Programming, Tel-Aviv, Israel, March, 2000. E. Rosen, A. Viswanathan and R. Callon, “Multiprotocol Label Switching Architecture,” Internet Draft W. Townsley, A. Valencia, A. Rubens, G. Pall, G. Zorn, B. Palter, "Layer Two Tunneling Protocol," IETF Network Working Group, RFC 2661. X. Xiao, "Traffic engineering with MPLS in the Internet," IEEE Network Magazine, vol. 36, No 3, March 2000. K. Lida, K. Kawahara and Y. Oie, "Performance evaluation of the architecture for end-to-end quality-of-service provisioning," IEEE Communications Magazine, vol. 36, no 4, April 2000. J. Rolia, "Predicting software performance," Ph.D. Dissertation, University of Toronto, Canada, 1992.