Towards Understanding the Usage Pattern of Web-based Electronic Medical Record Systems Xiaowei Li and Yuan Xue Department of Electrical Engineering & Computer Science Vanderbilt University Nashville, USA Email: xiaowei.li,
[email protected]
Abstract—The benefits and importance of electronic medical record (EMR) systems have been well recognized in the healthcare industry. Yet, their wide adoption still face significant barriers in providing on-demand secure medical information access while preserving patients’ privacy. Understanding the usage pattern of an EMR system is the first essential step towards building such environment. This paper conducts an indepth trace analysis of a large-scale EMR system that has been in operation for more than a decade at the Vanderbilt Medical Center. Our study demonstrates several important characteristics of EMR system usage from the perspective of user-initiated sessions. First, the workload of the EMR system is highly stable and consistent with a weekly pattern. Second, EMR behavior varies between users, but each user’s behavior tends to be consistent with a slow rate of migration across sessions. Finally, the degree of access between users and medical records is sparse, echoing the limits of patient-caregiver relationships that manifest in real healthcare operations. We believe these observations can assist in the development of system security measures, such as EMR-specific anomaly detection systems, and facilitate system performance optimization. Keywords-electronic medical record; usage pattern; user behavior; web session;
I. I NTRODUCTION An electronic medical record (EMR) system is a collection of information technologies that maintain and process patient data. An EMR is built around a data repository of patientspecific information and is connected to many other ancillary clinical systems (e.g., laboratory, radiology, pharmacy, and decision support) and is a critical component of a broader health information architecture that supports medical information sharing and healthcare service delivery. The salient benefits of EMR systems are well recognized and include the reduction of documentation errors, ease in information accessibility, and knowledge discovery. In recognition of such advantages, the U.S HITECH Act [1] (passed in 2009) appropriated $25.8 billion to promote the adoption and use of health information technology, with a special focus on EMR systems. Implementing an EMR system, however, is a complex and expensive process [2] . EMR systems need to safeguard critical medical information and comply with various c 978-1-4577-0351-5/11/$26.00 ⃝2011 IEEE
Bradley Malin Department of Biomedical Informatics Vanderbilt University Nashville, USA Email:
[email protected]
government regulations and local policies, such as the U.S. Health Insurance Portability and Accountability Act [3], to ensure the privacy and security of patient data. Additionally, EMR systems are increasingly connected with web-based portals that allow 24/7 Internet access. While providing greater convenience, the complexity and challenges in building highly-available and secure web systems also become a barrier to the deployment of EMR systems. Due to such factors, the pace of adoption of EMR systems has been slower than expected. Understanding the usage pattern of an EMR system is an first essential step towards engineering a high-performance, robust and secure web-based EMR system. From the perspective of improving system performance, optimizing web application deployment and achieving load balance rely on knowledge of system utilization and user request patterns [4][5]. From the perspective of security and privacy assurance, system usage patterns can be analyzed to learn profiles for anomaly detection systems, defend against outsider intrusions, and identify insider threats [6][7]. To characterize the usage pattern of EMR systems, this work conducts an in-depth trace analysis for a web-based EMR system that has been in operation at a large academic medical center for more than a decade. This work extends the analysis in [8], which focused on daily and weekly patterns, by considering session-level features. Our study examines three aspects: 1) system-level behavior, 2) userlevel behavior and migration over sessions, and 3) userrecord access relationship. The significant findings of this work are follows: 1) The workload of the EMR system, in terms of number of sessions, users and accessed records, is consistent over time with a weekly pattern. This suggests that building a highly effective DoS attack detection system can be achieved by monitoring the observed system load. 2) EMR users are differentiable by the number of sessions they initiate, the actions they trigger, and the number of records they access. Such differences often relate to roles and department affiliations in the
healthcare organization. This implies profiles may be established for users, or group of users. based on such knowledge. 3) The behavior of EMR users’ in web sessions fluctuates significantly across consecutive sessions. Yet, when aggregated over a reasonable time frame, the behavior exhibits greater consistency. Over time, the aggregated behavior exhibits a slow rate of migration. This observation suggests a stable user profile for anomaly detection can be built using aggregated sessions, but attention should be paid to the timeframe. 4) The access patterns with respect to patient records are varied. For instance, the record “popularity” follows a heavy-tailed distribution, such that a large proportion of the records are rarely accessed. Moreover, when a record is accessed, only a few users interact with the record. This sparse “pairing” between users and records echoes the stable patient-caregiver structure in healthcare operations, and may be applied to establish fine-granularity access control policies that enhance patient privacy. To the best of our knowledge, this is the first comprehensive study of the usage patterns and the user behavior of a large-scale web-based EMR system at a session level. However, there are relationships to certain investigations we wish to highlight. First, our objective is similar to, but beyond, that of [9], which studies user behavior and content access patterns in a large-scale video-on-demand system. Our findings suggest that general web system design methods [6] will not fully utilize the unique aspects of an EMR usage pattern. Rather, there is a need for customized anomaly detection and optimization strategies. Second, our study is related to the design and implementation of tethered patient portals (i.e., connected to electronic medical records) [10]. Third, our work is related to studies on portal usage statistics, user satisfaction [11] and analysis of user navigation patterns [12][13] in EMR systems for improving user interface design have also been conducted. However, our work differs from the latter studies in that it analyzes the usage patterns of EMR systems comprehensively. The rest of paper is organized as follows. Section II describes the EMR system and the user session model. Section III presents the trace study results and significant observations. Finally, Section IV summarizes the investigation and suggests future directions. II. S YSTEM D ESCRIPTION A ND M ODEL A. StarChart And StarPanel The EMR system studied in this paper corresponds to StarChart/StarPanel, which was developed by and deployed at Vanderbilt University Medical Center (VUMC) [14]. The system has been in operation for over a decade and is well-ingrained in the daily healthcare and business operations of the medical center [8]. StarChart is an integrated,
longitudinal EMR system for both inpatient and outpatient settings. It aggregates a number of data sources from across VUMC clinical domains, including clinical notes, laboratory tests and radiology reports. StarPanel is a webbased application that allows access to StarChart. Users can access StarPanel via any web browser and workstation in the medical center after approved by VUMC security administrators. The classes of user are varied, ranging from clinical to administrative staff. B. Trace In this paper, we study StarPanel server traces spanning approximately one year across 2005-2006.1 Each entry in the trace consists of the following attributes: {timestamp, ipAddress, userid, actionM odule, parameters}. To clarify, the actionM odule field reports the .cgi module invoked for the web portal, e.g., search.cgi, report.cgi. The parameters include the specific values which those actions involve. Among these parameters, the patient record number (prn) is critical to this study. Patient records include various types of information, such as current problem lists, treatment documentation, and laboratory test results. C. Session Like all web-based systems, users interact with StarPanel by first logging into the system and initiating a session with a server to invoke system functions. Here, we describe our user session model for the EMR system. 1) User Session Model: There are three principals involved in each EMR transaction. Namely, these are the user (u ∈ U , where U is the set of users), the patient record (r ∈ R, where R is the set of patient records), and the action (a ∈ A, A is the set of action modules). A user session s(u,t) (simplified as s hereafter) is indexed by the user u who initiates the session and the timestamp t when the session starts. We use S to denote the set of all sessions from the trace. For session s(s ∈ S), we further use us and ds to denote the corresponding user and session duration, respectively. Let ⃗Γs = (Γt1 , Γt2 , ..., Γtn )s be the operation sequence of session s, where ∪ each operation Γti = (a, r), 1 ≤ i ≤ n, a ∈ A, r ∈ R {−} represents an action over a patient record and a sequence of operations is an instance of clinical workflow.2 Further, let Rs be the set of records accessed in session s (i.e., {r|r appears in ⃗Γs }), and As be the action set invoked in session s, (i.e., {a|a appears in ⃗Γs }). III. T RACE S TUDY The EMR system trace is summarized in Table I. We study the trace from three aspects: 1) system-wide characteristics, including the overall system usage and the session features 1 All identities, including IP addresses, user ids and patient record numbers, were all sanitized before we perform our analysis. 2 {−} means the operation involves no patient record.
4
x 10
4
Record Access Per Day Users Per Day Sessions Per Day
3
Deviation
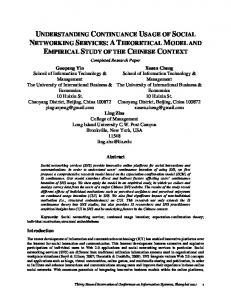
from all users, 2) user behaviors, focusing on the difference across users and the behavior consistency and migration over time, and 3) patient record access patterns, emphasizing the difference among records and the relationship between users and their accessed records.
2 1 0
−1
Table I T RACE S UMMARY
−2 0
Number Number Number Number Number
of of of of of
days users (identified by userid) patient records (by prn) action modules (by .cgi) sessions
50
100
150
200
250
300
350
Day of Study
396 30,093 710,059 906 7,451,588
Figure 2.
Deviation of number of sessions/users/record accesses per day
a log-uniform distribution where more than 60% and 90% of the requests transpiring within 10 seconds and 5 minutes, respectively.
3.5
x 10
3
4
1
0.8 0.6 0.4 0.2 0
1 min
10 min
1 hour
Session Duration Figure 3.
Cumulative Probability
1) Overall system usage: We examine the overall system usage using three measures: 1) the number of sessions, which reflects the server workload, 2) the number of distinct users, which represents the magnitude of the user population interacting with the system, and 3) the number of patient records accessed, which indicates the intensity of database usage. Fig. 1 depicts the daily average of these measures over the trace. We observe that the measures are positively correlated with each other and exhibit a clear weekly pattern. To better characterize the change in system workload over time, we apply time-series analysis. To eliminate the weekly periodicity, we extract the mean value of the same weekday. The result is depicted in Fig. 2, where it can be seen that the workload of the EMR system is highly consistent over the year, especially for the number of users per day. The number of sessions and records accessed per day exhibit an occasional negative deviation from the mean.
Cumulative Probability
A. System-wide Characteristics
Distribution of session duration (x-axis on log scale)
1
0.8
0.6
0.4
0.2
10 sec
Num of Sessions Per Day Num of Users Per Day Num of Record Access Per Day
30 sec
1 min
2 min
5 min
1 min
Inter−request Interval
2.5
Figure 4. Distribution of inter-request interval within one session (x-axis on log scale)
2 1.5 1
0 0
Figure 1.
50
100
150
200
Day of Study
250
300
350
400
Number of sessions/users/record accesses per day
2) Overall session features: Next, for illustration purposes, we report on the session duration and the user request arrival pattern within one session. Fig. 3 shows the distribution of session duration, which is log-uniform. For instance, 40% and 90% of the session durations last less than 1 minute and one hour, respectively. Fig. 4 shows the distribution of inter-request interval within one session. It can be observed that the inter-request interval also follows
Cumulative Probability
0.5
1 0.8 0.6 0.4 0.2 0
1 min
1 hour
1 day
Inter−session Interval Figure 5.
Distribution of inter-session interval (x-axis on log scale)
The intervals between consecutive sessions for each user are summarized in Fig. 5. Notice, 50% and over 90%
400
Su = {s|us = u, s ∈ S}). Fig. 8 depicts the distribution, where it can be seen that more than half of the population initiates less than 100 sessions. Notably, the variance of the number of sessions per user is extremely large. This implies that users have quite different usage patterns of the EMR system. It further suggests that session models should be established for individuals or groups of users. Cumulative Probability
of users invoke sessions within one hour and one day, respectively. We proceed to study the session length in terms of the action sequences and the number of distinct action modules triggered in each session. Fig. 6 plots the distribution of the length of action sequence for each session (i.e., {|⃗Γs |, s ∈ S}) on a log scale. The distribution is highly right-skewed with a mean of 35 actions. About 80% of the sequences contain less than 20 actions. Fig. 7 demonstrates the number of distinct actions in each session (i.e., {|As |, s ∈ S}). There are a non-trivial number of sessions containing only two action modules, reflecting the fact that some users just log into the system without doing anything until the session expires. Overall, the distribution is slightly right-skewed with a mode of 15 distinct actions and, as shown in Fig. 6, certain actions are repeatedly performed in a session.
1 0.8 0.6 0.4 0.2 0
10
100
1,000
Number of Sessions
Cumulative Probability
Figure 8. Distribution of number of sessions per user (x-axis on log scale) 1
2) User actions are different across sessions: We examine how many distinct actions each user has performed (i.e., {|Au |, u ∈ U }, where Au = {a|a ∈ As , us = u, s ∈ S}). Fig. 9 shows that, among all 900 actions, most users performed less than 160, which indicates it may be possible to distinguish users by their sets of actions.
0.8 0.6 0.4 0.2 0
10
100
500
Figure 6. Distribution of the length of action sequence per session (x-axis on log scale)
Num of Sessions
15000
1 0.8 0.6 0.4 0.2 0
10000
5000
Figure 9.
0 0 1 2 3 4 5 6 7 8 9 10 11 12 13 14 15 16 17 18 19 20 21 22 23 24 25 26 27 28 29 30 31 32 33 34 35 36 37 38 39 40
Num of Distinct Actions Figure 7.
Cumulative Probability
Length of Action Sequence
Distribution of number of distinct actions per session
3) Summary: The workload of the EMR system, in terms of number of sessions, users and accessed records for each day, is highly predictable. This observation could be used to develop optimization techniques for the targeted workload for EMR web systems. It also suggests the feasibility of building a highly effective DoS attack detection system based on the accurate load prediction. B. User Behaviors 1) Users can be differentiated by their actions: User behaviors are examined in terms of the number of sessions that are initiated by each user (i.e., {|Su |, u ∈ U }, where
20
40
60
80
100
120
140
Num of Distinct Actions
160
180
200
Distribution of number of distinct actions used per user
To study how user actions change across sessions, we calculate the similarity of actions between sessions of a user as follows. The action set As in session s of user u ⃗ (u,s) . Let us is encoded into an action vector denoted by Υ index actions in Au by ai . For session s of user u, if ai ∈ As , Υ(u,s) (i) = 1; otherwise, Υ(u,s) (i) = 0. The similarity of ⃗ (u,s) and Υ ⃗ (u,s−1) is actions between consecutive sessions Υ computed as the cosine similarity: ⃗ (u,s) , Υ ⃗ (u,s−1) ) = cos(Υ
⃗ (u,s) · Υ ⃗ (u,s−1) Υ . ⃗ (u,s) ∥∥ Υ ⃗ (u,s−1) ∥ ∥Υ
(1)
Fig. 10 shows the similarity score of consecutive sessions of a randomly selected user. It can be seen that user actions fluctuate between sessions, which implies the sessions of a user cannot independently be leveraged to represent a user’s profile.
0.4
0.2
0 0
50
Figure 10.
100
150
Session Index
200
250
300
3) User actions tend to be consistent within a session window: We study whether user action sets stabilize over multiple sessions. To do so, the actions of several consecutive sessions are aggregated to form a composite action vector. Collectively, these sessions are called a session window and the number of sessions within the window is ⃗ w be the aggregated action vector, called the size w. Let Υ (u,s) starting from user u’s session s of size w. Thus, we have: (2)
Mean (Action Set Difference)
⃗ (u,s) and the similarity of actions between a single session Υ w ⃗ and its preceding session window Υ(u,s−w) can be computed using the cosine similarity. Figs. 11 and 12 show the mean and variance of dissimilarity between consecutive sessions as a function of session window size for a randomly selected user. Notice that as the window size increases, the dissimilarity (both the mean and the variance) across sessions drops. The dissimilarity is minimized with a window size of 50, which suggests that aggregated user actions within a certain timeframe are consistent. When the size of session window is further increased, the dissimilarity between sessions slightly increases. This suggests that user actions migrate slowly over a long time period. To validate this observation, we randomly selected a number of users and found they all follow the same pattern, albeit with a different session window size. As a result, if such data is used as the basis of user profiles, the session window size needs to be carefully selected. 0.11 0.1 0.09 0.08 0.07 0.06 0.05
1
2
3
4
5
6
7
8
9 10 20 30 40 50 60 70 80 90 100 200 300 400 500 600 700 800 900
Session Window Size
Figure 11. size
0.015
0.01
0.005
0 1
2
3
4
5
6
7
8
9 10 20 30 40 50 60 70 80 90 100 200 300 400 500 600 700 800 900
Session Window Size
The dissimilarity of user actions across consecutive sessions
⃗ (u,s+1) + ... + Υ ⃗ (u,s+w−1) . ⃗w =Υ ⃗ (u,s) + Υ Υ (u,s)
Variance (Action Set Difference)
0.6
0.02
Mean of action set differences with different session window
Figure 12. Variance of action set differences with different session window size
4) Summary: Aggregated user behavior, over multiple sessions, is highly consistent. This observation suggests aggregated user action sets may serve as a foundation to profile users. Also, there is a user-specific timeframe over which sessions should be combined for profiling. C. Patient Record Access 1) Sessions tend to target a small group of records: We study the number of records accessed per session (i.e., {|Rs |, s ∈ S}). Fig. 13 shows that the dominant proportion of sessions involves less than 3 patient records, a relatively small set. This observation reflects the fact that most users are using the system to serve specific patients. 50
Percentage (%)
Action Dissimilarity
0.8
40 30 20 10 0
0
1
2
3
4
5
6
7
8
9 10 11 12 13 14 15 16 17 18 19 20 21 22 23 24
Num of Accessed Records Figure 13. Distribution of number of patient records accessed per session
2) Records have different “popularity”: We examine the number of accesses for each record at the session level (i.e., the popularity of record). Fig. 14 shows the distribution of the number of sessions per record (i.e., {|Sr |, r ∈ R}, where Sr = {s|r ∈ Rs , s ∈ S}). The result shows that the “popularity” of each record varies significantly. More than 30% of the patient records were accessed only once during the year, while the most “popular” record was accessed more than a thousand times, showing a very heavy-tailed distribution. To compare against the typical power-law web document popularity model [15], we plot the popularity distribution of patient records with the Zipf distribution in Fig. 15 (the straightline on the log-log plot) and notice that the record popularity model deviates from the Zipf distribution. This occurs because the popularity of a record depends on
1 0.8 0.6 0.4 0.2
10
100
Num of Sessions
0.6
0.4
1
10
100
Num of Records
1,000
Figure 17. Distribution of number of accessed records per user (x-axis on log scale)
On the other hand, Fig. 18 shows the distribution for the number of distinct users who access the same record (i.e., {|Ur |, r ∈ R}, where Ur = {u|r ∈ Rs , us = u, s ∈ S}). More than 70% of the records are accessed by less than 10 users and almost all records attract less than 100 users. In
100,000 10,000 1,000
10 1 1
10
100
1,000
10,000
100,000
1,000,000
Record Index (Sorted By Popularity) Figure 15.
Distribution of patient record popularity (log-log plot)
Fig. 16 shows the intervals between immediate accesses across sessions for patient records receiving multiple accesses. Notice, 70% of the consecutive accesses occur within one day and most are within one month, which indicates that the majority of records are “active” for only a short period of time. 1 0.8 0.6 0.4 0.2
1 min
1 hour
1 day
Cumulative Probability
100
Cumulative Probability
0.8
1,000
Figure 14. Distribution of number of distinct sessions per record (x-axis on log scale)
0
1
0.2
0 1
Num of Sessions
60% of the users accessed less than 100 patient records. Still, there are a group of users that visit thousands of patient records during the year. This result further supports our prior observation that user behaviors vary significantly and may be related with their roles or affiliations. Cumulative Probability
Cumulative Probability
various aspects of healthcare, such as the admission status (e.g., outpatient vs. inpatient) and the clinical status (e.g., diagnoses and treatment regimen) of the patient. Also, it may be due to the fact that there is a limit on the number of patients a care provider can work with during a certain timeframe in the real world.
1 0.8 0.6 0.4 0.2 0 1
10
100
Num of Users Figure 18. log scale)
Distribution of number of distinct users per record (x-axis on
total, there are 6,938,673 (user, record) pairs, indicating an extremely sparse bipartite graph between 30,093 users and 6,938,673 710,059 patient records ( 30,093∗710,059 = 0.03%). 4) Summary: Modeling patient record access patterns, and their association with users, is important to establish fine-granularity access control policies that enhance patient privacy. When such patterns are used as feature in an anomaly detection system, they may assist in the identification of impersonators, insider threats, and privilege misuse.
1 month
Inter−access Interval Figure 16. scale)
Distribution of inter-access interval per record (x-axis on log
3) User-record pairs are sparse: We proceed to study the relationship between users and records. Fig. 17 shows the distribution of the number of records each user accessed (i.e., {|Ru |, u ∈ U }, where Ru = {r|r ∈ Rs , us = u, s ∈ S}).
IV. S UMMARY AND F UTURE W ORK This paper conducted an extensive study on StarPanel, a large-scale EMR system. Specifically, we examined several aspects of system-wide characteristics associated with user behaviors and record-level access patterns. The findings indicate that user-level behavior is highly variable and more general views on the system may be necessary to support
performance optimization and anomaly detection. In future research, we intend to focus on abstracting the patterns using the semantics of the healthcare domain (e.g., clinical roles of users and status of patients) in building high-performance and secure EMR systems.
[12] K. Zheng, R. Padman, M. P. Johnson, and H. S. Diamond, “An interface-driven analysis of user interactions with an electronic health records system,” Journal of the American Medical Informatics Association, vol. 16, no. 2, pp. 228 – 237, 2009.
ACKNOWLEDGMENT
[13] E. Chen and J. Cimino, “Automated discovery of patientspecific clinician information needs using clinical information system log files,” AMIA Annu Symp Proc, pp. 145–149, 2003.
This research was funded by NSF grants CCF-0424422 and CNS-0964063 and R01-LM010207 from the NLM/NIH. The authors thank D. Giuse for providing the trace and Steve Nyemba for preprocessing assistance. R EFERENCES [1] “American recovery and reinvestment act of 2009.” [Online]. Available: http://www.gpo.gov/fdsys/pkg/PLAW111publ5/content-detail.html [2] D. Garets and M. Davis, “Electronic patient records – emrs and ehrs, concepts as different as apples and oranges at least deserve separate names,” Healthcare Informatics, 2005. [3] U.S. Department of Health and Human Services, Office for Civil Rights, “Health insurance portability and accountability act,” Standards for protection of electronic health information; Final Rule. Federal Register, 45 CFR: Pt. 164., 2003. [4] C. Stewart and K. Shen, “Performance modeling and system management for multi-component online services,” in NSDI’05, 2005, pp. 71–84. [5] Q. Yao, A. An, and X. Huang, “Mining and modeling database user access patterns,” in Foundations of Intelligent Systems, vol. 4203, 2006, pp. 493–503. [6] C. Kruegel and G. Vigna, “Anomaly detection of web-based attacks,” in CCS ’03, 2003, pp. 251–261. [7] M. Cova, D. Balzarotti, V. Felmetsger, and G. Vigna, “Swaddler: An Approach for the Anomaly-based Detection of State Violations in Web Applications,” in RAID:07, pp. 63–86. [8] B. Malin, S. Nyemba, and J. Paulett, “Learning relational policies from electronic health record access logs,” Journal of Biomedical Informatics, vol. 44, pp. 333–342, 2011. [9] H. Yu, D. Zheng, B. Y. Zhao, and W. Zheng, “Understanding user behavior in large-scale video-on-demand systems,” in Proc. of EuroSys ’06, 2006, pp. 333–344. [10] E. G. P. J. L. S. T. K. G. L. A. V. B. M. Richard W. Grant, Jonathan S. Wald, “Design and implementation of a webbased patient portal linked to an ambulatory care electronic health record: Patient gateway for diabetes collaborative care,” Diabetes Technology & Therapeutics, vol. 8, no. 5, pp. 576– 586, 2006. [11] J. D. Ralston, J. Hereford, D. Carrell, and M. Moran, “Use and satisfaction of a patient web portal with a shared medical record between patients and providers,” AMIA Annu Symp Proc., p. 1070, 2006.
[14] D. Giuse, “Supporting communication in an integrated patient record system,” AMIA Annu Symp Proc, p. 1065, 2003. [15] K. P. Gummadi, R. J. Dunn, S. Saroiu, S. D. Gribble, H. M. Levy, and J. Zahorjan, “Measurement, modeling, and analysis of a peer-to-peer file-sharing workload,” SIGOPS Oper. Syst. Rev., vol. 37, no. 5, pp. 314–329, 2003.