Keywords: performance visualization, monitoring tools,. OMIS, J-OCM, OCM-G, G-PM ... We are conscious that one of the biggest problems we can face while using ... OMIS compliant monitoring infrastructure â J-OCM [4]. We use the on-line ...
Towards user-defined performance monitoring of distributed Java applications Włodzimierz Funika1 , Piotr Godowski1 , Piotr Pe¸giel1 , Marian Bubak1,2 1 Institute of Computer Science, AGH, ul. Mickiewicza 30, 30-059 Krak´ow, Poland 2 ACK CYFRONET AGH, ul. Nawojki 11, 30-950 Krak´ow, Poland {bubak,funika}@agh.edu.pl, {flash,pegiel}@student.agh.edu.pl phone: (+48 12) 617 44 66, fax: (+48 12) 633 80 54
Abstract
One of the most important tasks for the tool under discussion is to enhance performance visualization capabilities. Of course, there are numerous well developed tools that are used for monitoring applications. These tools frequently have quite a closed structure and it is rather hard to add new functionality in the future. Moreover, it often happens that a tool designer cannot foresee in what context this application will be used. Therefore it is very important to enable the user to add in a simple way own functionality, e.g. new metrics. We are conscious that one of the biggest problems we can face while using performance tools (especially, these working ”on-line”) is their complexity. Thus many users give up what these systems offer and benefit from often less complex but easier in to use tools. So one of the most important tasks for us is to simplify user’s interactions with our system. Certainly, the simplification of the program use shall not entail limiting its performance evaluation functionality. In this paper we focus on a visualization tool which provides an interface between raw data obtained from the monitoring system and various user’s needs in performance analysis, based on the functionality of a Java oriented, JOMIS compliant monitoring infrastructure – J-OCM [4]. We use the on-line performance visualization approach - it helps understand how the application is working, how big is resources usage, and how different kinds of measured data are correlated with each other (e.g. synchronous communication overhead and total time of method execution). Online visualization allows also for proper reactions e.g. if applications are requesting more resources. Additionally, due to using the J-OCM system it is possible to observe different applications within a single tool run. So, for example, we can track the behavior of a client and server and compare them with the same time line. In the paper we present the design of Java Measurement Tool (JMT) intended to work with J-OCM monitoring system, and demonstrate its features, like types of performance visualization and user-defined metrics written in
This paper presents a new approach to the issues of performance monitoring and visualization of distributed applications using the J-OCM monitoring system. We are focusing on the building of a GUI measurement-oriented tool with a flexible functionality, Java Measurement Tool (JMT) on top of J-OCM which provides an OMIS-based monitoring interface. The tool addresses the issues of user-defined metrics and user-friendly visualization of distributed Java applications. The paper introduces the functionality, design, and status of JMT. Keywords: performance visualization, monitoring tools, OMIS, J-OCM, OCM-G, G-PM
1 Introduction Computer science cannot be today imagined without distributed computing. The computing power reserved once only to supercomputers is available to developers through connecting heterogenous, distributed machines. Through the last years such a computing model became more available to potential users worldwide than ever before. However, software developers meet many problems. The key issue is to increase the performance and reliability of distributed applications. The design of distributed application is in many cases a challenge to the developer ([1, 2, 3]). On the one hand, there are the limitations and performance issues of distributed programming platforms. On the other hand, the developer must assure that the application manages and uses distributed resources efficiently. Therefore, understanding application’s behavior through performance analysis and visualization is crucial. Performance visualization tools are intended to support exploration of vast amounts of monitoring data on the distributed application with drilling down the available data and switching focus between performance aspects. 1
Java, which enables to define measurements and visualization meaningful in the context of application specifics. The intended goal is to support PMSL–based metrics [6], and maximize the ease of: creating new metrics, aggregating metrics, user friendly visualization interface, and finally providing a set of basic metrics to support PMSL-compliant metrics. This paper is organized as follows: after a discussion of related work in Section 2, we shortly mention the idea of OMIS-oriented monitoring [5] and its derivative for Java, J-OMIS [7] (Section 3), then we come to the way metrics are defined (Section 4), next we are presenting the idea of performance visualization in the JMT tool (Section 5). In Section 6 we are summing up the work done so far and show plans for further research.
Paradyn [11] – the performance measurement tool with dynamic instrumentation. This is an example of tool with special language of metric definition. Paradyn can work with parallel and distributed programs. What is interesting about it is its approach to the instrumentation: Paradyn directly instruments the binary image of a running program so modifying source code is not needed. Due to this it is possible to change metrics dynamically while the program is running – proper instructions will be added to binary image and from this point only selected data will be collected. Paradyn enables user to add dynamically a new metric. Such metrics are written in Metric Definition Language (MDL). It is a simple but powerful language for fast metric creation. Currently Paradyn supports visualizations in data-plots, bar graphs, and tables. But it can be extended in a very easy way – Paradyn’s team has created separate library – visilib. This library provides an open interface to all Paradyn data, and allows programmer build own visualizations. By visilib and remote procedures call interface all ”messy” details of data structures and communication with Paradyn are transparent to user. The Mercury Grid Monitoring System [12] is one of the on-line tools for monitoring grid applications. It provides monitoring data represented as metrics both via the pull and push access semantics and also supports steering by controls. The main architecture is based on Grid Monitoring Architecture (GMA). All metrics are based on sensors and producers models (Mercury also supports actuators). Integration of GRM and Mercury Monitor provides a possibility to monitor not only predefined event types (like process start, exit, function or block enter and exit, etc.), but also supports user defined events. Using a different point of view, ASL and JavaPSL [13] languages are high level languages originally introduced for detecting performance bottlenecks in applications, being similar to user-defined metrics. JavaPSL, a generic performance specification language for modeling experimentrelated data and performance properties of distributed and parallel programs. Performance properties characterize a specific negative performance behavior of a program and are defined over experiment-related data. JavaPSL is not a tool, but intended to be used as a standard performance information interface that can be used to model a large variety of performance information, to build sophisticated performance tools (e.g. to provide automatic bottleneck analysis), and to enable portable access to performance information. The Askalon Grid Application Development and Computing Environment [14] uses the Aksum tool (which is using the JavaPSL language) for online performance analysis. The tools created for monitoring grid systems are wellsuited in their distributed architecture. G-PM ( [15], [16]), a tool designed for performance evaluation on top of the OCM-G monitoring system is an example. This tool works
2 Related work There are a large number of monitoring tools for Java distributed programs. Available commercial tools like JProfiler [8], JMX architecture [9] allow user to monitor Java applications and visualize aggregated data. However, these tools are not well-fitted into real distributed systems. Such tools usually are working as local agents and client application communicating with each agent, request distribution occurs in point-to-point manner. Usually, new nodes are not visible in such tools (because of lacking distribution unit managing attached nodes in their architecture). Most of the tools mentioned above could be used only for finding potential bottlenecks, and usually it is not possible to get low-level (fine-grained) data, like CPU time spent in method, number of fields/methods in Java class, or even time spent on RMI method invocation. Many tools are running in off-line mode, so online visualization if not possible. There are tools that support configurable metrics, but use them only to simplify the internal implementation. It is not possible for the user to specify own metrics, not only because there is no user interface for it, but mainly because the specifications are too low-level, i.e. too close to an implementation and thus too complex for a normal user. Another approach is using a special metrics definition language but targeted to off-line processing traces stored in files. NetLogger Toolkit [10] developed at Lawrence Berkeley National Lab is designed to monitor, under actual operating conditions, the behavior of all the elements of the application in order to determine exactly where time is spent within a complex system. Using NetLogger, distributed application components are modified to produce timestamped logs of ”interesting” events at all the critical points of the distributed system. Events from each component are correlated, which allows one to characterize the performance of all aspects of the system and network in detail. This tool is only limited to monitor time-related performance. 2
• Class Methods (cm )
almost exactly as the described JMT tool, being complaint with OMIS 2.0, allows creating (in the PMSL language) user-defined metrics (after custom application instrumentation) and provides a basic and extended measurement mechanism. The underlying OCM-G monitoring system provides services which monitor events in the application, or perform actions like acquiring information on the application or manipulating processes. The G-PM tool is using these services like the JMT tool. Prompted by a user (custom metric), the system can perform asynchronous ”probes” to read and write the state of the application object and return a measured data back into the tool. Finally, custom metrics can be derived from any existing set of metrics by aggregating or comparing their values (the same idea stands behind ”standalone” user-defined metrics in JMT). Our goal is to create a tool with at least the same set of features as the G-PM tool (including support for a custom metrics, moreover custom metrics are also defined in Java language, in a user-friendly form of ”scriptable Java” feature available, e.g. in the BeanShell library [17]), an especially needed feature are event-triggered measures. User metrics will be also defined and added using dedicated Performance Measurement Specification Language (PMSL) [6], developed within the CrossGrid project [18], for the G-PM tool. PMSL supports a probe mechanism that can be used to make performance measurements meaningful in the context of the application and to retrieve the content of internal application variables. On the other hand PMSL supports also the measurements done via standard OMIS–compliant services, thus with a given set of basic (so called standard) metrics it becomes a powerful measurement environment. Based on PMSL, a well defined mechanism, the JMT tool will be able to evaluate (and visualize) obtained monitoring data on Java-based applications in a distributed environment, especially in HPC environment supported by J-OCM.
• Class Fields (cf ) • Thread Groups (tg ) • Thread (t ) The above objects form a natural hierarchy; for example, a Java class method is under its class, and its JVM, and a thread is under its thread group and JVM. The hierarchy of J-OCM objects is not defined by ”is”, but rather on the ”contains” relation. Using the W3C XML Schema standard and XML notation, it is easy to describe relations between objects, and define how to obtain a list of tokens from each group, attach to an object (identified by its token) in order to monitor its behavior. Attach, detach and listing (query) requests may contain a reference to its parent (using @parent expression) or another token (e.g. @grandparent) in the hierarchy above. The mentioned requests must be unconditional OMIS requests (starting with colon character ”:”). A fragment of the hierarchy definition is shown below: jvm :jvm_get_tokens([@parent]) :jvm_attach([@token]) :jvm_detach([@token]) Java Virtual Machine classLoader :jvm_cl_get_tokens([@parent]) :jvm_cl_attach([@token]) :jvm_cl_detach([@token]) Class Loader class :jvm_class_get_names([@grandparent], ".*" :jvm_class_attach(@parent, @token) :jvm_class_detach(@parent, @token) Java Class
3 Tokens hierarchy The token data type is used in OMIS-compliant systems (therefore in J-OCM, too), to provide a platform independent way of addressing objects being observed. Any object that can be observed or manipulated is represented by a token. Tokens represent different kinds of objects, which are in the hierarchy defined by its environment. The J-OCM system defines the following kinds of objects (and corresponding tokens):
This kind of description makes the visualization tool flexible and even when the underlying system (J-OCM) adds any new kind of objects and defines new tokens, the monitoring tool is able to use new types without any development effort, just a configuration change is required. It could be even possible to use the JMT tool not only with JOCM, but also with any OMIS–compliant system (e.g. the OCM-G system), especially when user defined metrics are involved. The monitoring tool uses the objects and token definition to show to the user a tree-like structure of tokens, and the user can select a J-OCM element to monitor (but prior to start monitoring the object and its visualization one must attach to it).
• Nodes (n ) • Java Virtual Machines (jvm ) • Class Loaders (cl ) • Classes (c ) 3
Node
Metric’s class diagram
runs AbstractMetric
JVM contains
uses
Thread Group controls
+ provideTokens (omisElement :OmisElement ):ArrayList #defaultProvideTokens (omisElement :OmisElement ):ArrayList #makeGetTokensRequest (elementToken :String ):String + initMetric ():void + finalizeMetric ():void + getSelectedTokens ():ArrayList + addSelectedToken (metricToken :String ):void + getMetricName ():String
Class Loader loads
Thread
Class contains
contains AbstractStandaloneMetric
Method
AbstractSimpleMetric
Field + getMetricValue ():Number
+ getMetricRequestStringForToken
():String
Figure 1. Tokens hierarchy (the left picture is a window, where objects to be monitored can be selected) Figure 2. Class diagram with metrics hierarchy
4 Metrics Metric is a way to describe what and how is going to be measured on a monitored system. A metric provides data used for visualization in a standardized way, standardized is also the metric creation method. The first (and only so far) implementation model of gathering data is the PULL model (as opposed to the PUSH model), in which at regular time intervals a measuring request from the metric into the monitoring system is sent, then a response is parsed and returned back into the visualization tool for visualization. There is currently no support for action-triggered metrics (PUSH model). Unlike in the G-PM performance monitoring tool, metrics do not need special instrumentation of the monitored application, because metrics are using J-OCM built-in services (e.g. service returning current CPU utilization time for process, or thread total memory allocation size). Metrics are associated with their tokens used in communication between the tool and monitoring system (tokens were discussed above). User-defined metrics are located and loaded at runtime, using the dynamic class loading feature available in Java environment. It is pretty simple: classes defining metrics must be present in CLASSPATH. User-defined ”simple” metrics are declared rather than implemented - the metric designer has only to extend a base metric Java class, fill some fields and that is all. A ”simple” metric declares a request string to be sent to J-OCM to get new data and string names visible in GUI. User-defined ”standalone” metrics can send as many measuring requests as needed, and combine many responses into a single value returned to the tool. To create this kind of metric, one must have basic Java programming language knowledge, but to a very limited extent (like class extending, and method overriding). From the implementation point of view, simple and standalone metrics have inheri-
tance diagrams shown in Fig. 2. Using the BeanShell library functionality, the user can define these two types of metrics in a scriptable form, just from within our tool, without a need to compile anything. This results in a flexible and extensible facility for the user, even without skills in Java programming, to define metrics (since it involves the implementation of a single method). The second component to create user-defined metrics is based on PMSL [21] which has been specified in the CrossGrid project. In addition to predefined measurement data, like those related to library function calls, PMSL also exploits probes that can be used to monitor control flow during application execution and to retrieve the content of internal application variables. These features are especially useful for the application developer. Using them the developer can design monitoring scenarios useful for the detection of origins of possible performance bottlenecks. Finally, the measurement of both predefined and PMSL-based can be narrowed to any subset of computing sites, nodes, processes or application functions (using a token hierarchy). The measurement of the PMSL metrics can be further narrowed to intervals in the application execution that are specified by enclosing probes. We used the original PMSL parser from the G-PM tool, and after a minor adaptation to J-OCM services and the naming scheme a native library was created and linked with our JMT tool. Currently, PMSL metrics are narrowed to the use of a subset of basic metrics, since J-OCM implementation does not support probes, but work is in progress and we anticipate the needed functionality hopefully soon. Figure 3 shows the whole JMT tool architecture coupled with PMSL. 4
JMT tool GUI uses
uses
PMSL parser
omis.jar
uses
connects to
connects to
Standard metrics J-OCM
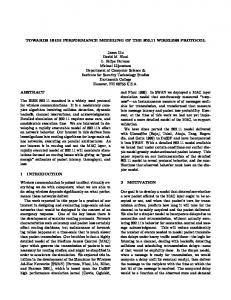
Figure 4. Multicurve chart with different axis range (load average and the number of threads)
Figure 3. PMSL within the JMT tool architecture
5 Approach to performance visualization updating), the axis is automatically scaled (it is also possible to work with the fixed value range)
The visualization of data delivered, e.g. from J-OCM, in a ”user friendly” form is one of the most important functionalities provided by monitoring tools. Because of the great amount of gathered information, the proper presentation of monitoring results becomes quite a difficult task. It is very common that software developers’ plans of the visualization don’t meet users’ expectations. This is the reason why we should concentrate on producing pluggable systems which make it possible to dynamically add new kinds of visualizations. In the created tool we aimed to separate the layer connected with maintenance and processing data (from the monitoring system, e.g. J-OCM) from the presentation layer. It was one of the most important purposes while developing the system – we have significantly simplified the source code of the program and its further evolution. As far as we are concerned with the main profit from such an architecture, it is the possibility to observe more than one metric on a common chart. It is possible to watch completely different types of metrics on the same display. A typical example is the observation of processor and memory usage depending on time. The former metric provides data connected with processor usage and the latter provides memory usage in the system. Another example of this kind of visualization is the chart presenting the length of job queue depending on the average time of processing. An interesting issue (connected with the possibilities of J-OCM) can be the monitoring of the execution time of RMI invocations – we will be able to see time on both sides of invocation – client time and server time. Below is a summary of the charts’ properties:
• one can scale (zoom-in, zoom-out) chart whenever needed – even once a visualization was started • it is possible to dynamically create the ordinal axis separately for different metrics on the same chart (commonly used when different types of metrics are applied (see Fig. 4, Fig. 5 ) • all the time (before a visualization starts or afterwards) it is possible to add a new metric to the chart – if more than a single visualization is started one can choose which one to connect to (in Fig. 4 you can see a situation when the metrics were added in the following sequence (Load average and Total number of threads). Obviously, it possible to remove a selected metric even after visualization had been started. With a single chart one can see the visualization of up to eight different metrics • visualization functionality allows to dynamically change chart types even when monitoring is on. At the current stage of our implementation work two types of displays are available: • multicurve chart – it is the most frequently used display – we use it when monitoring continuously changing data (e.g., processor usage) • histogram chart – helpful in the cases when we need to understand the distribution of measured values . In our program one can dynamically manipulate the number of intervals – it is implemented by the slider (Fig. 5).
• when dynamically adding new numbers to the chart (or 5
We intended to develop a flexible and user friendly system. We also provide a possibility for the tool to further evolve in an easy way. Adding new metrics is as simple as implementing one class in Java language or in BeanShell script, it is also possible to create new metric definitions in the PMSL language. Nor building new types of visualization creates difficulties. Nowadays, the JMT architecture is well defined; we are concentrating on creating new types of displays and on a better integration of the PMSL language into the JMT tool.
7 Acknowledgments We are very grateful to prof. Roland Wism¨uller for a valuable contribution. The research is partly supported by the EU IST K-Wf Grid project.
Figure 5. Histogram chart (RMI calls duration)
References
According to the guidelines there must be a possibility to define new types of visualization. It is an easy task – all one needs is to implement the following interface:
[1] M. Gerndt, R. Wismller, Z. Balaton, G. Gomb´as, P. Kacsuk, Zs. N´emeth, N. Podhorszki, H.-L.Truong, T. Fahringer, M. Bubak, E. Laure, T. Margalef: Performance Tools for the Grid: State of the Art and Future. APART-2 Working Group, Research Report Series, Lehrstuhl fuer Rechnertechnik und Rechnerorganisation (LRR-TUM) Technische Universitaet Muenchen, Vol. 30, Shaker Verlag, ISBN 3-8322-2413-0, January, 2004.
public interface AbstractChart { public JPanel getChartPanel(); public void addSeries(String metricName); public void refreshSeries(Vector values); public void removeSeries(String metricName); }
The getChartPanel() method is used to provide an application with a complete panel containing a visualization logic. Because of using the JPanel container it is easy to create a new form filled with, e.g., control buttons (apart from visualization itself). The Builder design pattern is responsible for proper display of a created panel. Because the chart is created in ”real time” – there should be a possibility of the continuous delivering of the data to the chart – it is realized by implementing the refreshSeries() method. This method takes a vector as a parameter, because we allow for the possibility that more than one series will be displayed on the chart.
[2] N. Podhorszki and P. Kacsuk: Presentation and Analysis of Grid Performance Data. In: Harald Kosch, Lszl Bszrmnyi, Hermann Hellwagner (eds.), Parallel Processing, 9th International Euro-Par Conference, Klagenfurt, Austria, August 26-29, 2003. Proceedings. Lecture Notes in Computer Science 2790 Springer 2003, pp. 119-126 [3] Daniel A. Reed and Randy L. Ribler: Performance Analysis and Visualization. In: Ian Foster and Carl Kesselman (eds), Computational Grids: State of the Art and Future Directions in High-Performance Distributed Computing, Morgan-Kaufman Publishers, August 1998, pp. 367-393.
6 Summary and future plans Performance monitoring and visualization are common problems related to distributed environments. When designing a tool for distributed Java applications we followed the ideas underlying the OCM-G monitoring system and the GPM performance measurement tool, which were developed for interactive grid applications. The idea of JMT is based on the G-PM tool – is supports user metrics definition and a possibility to provide relevant visualization types for metrics. In JMT we use J–OCM as the monitoring layer – so it is possible to monitor ’non-grid’ applications.
[4] W. Funika, M. Bubak, M.Sme¸tek, and R. Wism¨uller: An OMIS-based Approach to Monitoring Distributed Java Applications. In: Yuen Chung Kwong, editor, Annual Review of Scalable Computing, volume 6, chapter 1. pp. 1-29, World Scientific Publishing Co. and Singapore University Press, 2004. [5] Ludwig, T., Wism¨uller, R., Sunderam, V., and Bode, A.: OMIS – On-line Monitoring Interface Specification (Version 2.0). Shaker Verlag, Aachen, vol. 9, 6
LRR-TUM Research Report Series. 1997 http://wwwbode.in.tum.de/\∼omis/ OMIS/Version-2.0/\-version-2.0.ps. gz [6] R. Wismueller, M. Bubak, W. Funika, B. Balis , A Performance Analysis Tool for Interactive Applications on the Grid, Intl. Journal of High Performance Computing Applications, vol. 18, no. 3, pp. 305-316, 2004. [7] Bubak, M., Funika, W., Wism¨uller, R., Me¸tel, P., Orłowski. Monitoring of Distributed Java Applications. In: Future Generation Computer Systems, 2003, no. 19, pp. 651-663. Elsevier Publishers, 2003 [8] http://www.ej-technologies.com/ products/jprofiler/overview.html [9] http://java.sun.com/products/ JavaManagement [10] http://dsd.lbl.gov/NetLogger [11] http://www.paradyn.org/index.html [12] http://www.lpds.sztaki.hu/mercury [13] http://www.dps.uibk.ac.at/projects/ aksum/JavaPSL.php [14] http://www.dps.uibk.ac.at/projects/ askalon [15] R. Wismueller, M. Bubak, W. Funika, B. Balis: A Performance Analysis Tool for Interactive Applications on the Grid, Intl. Journal of High Performance Computing Applications, vol. 18, no. 3, pp. 305-316, 2004. [16] http://gpm.icsr.agh.edu.pl [17] http://www.beanshell.org [18] http://www.eu-crossgrid.org [19] R. Wism¨uller, J. Trinitis and T. Ludwig: A Universal Infrastructure for the Run-time Monitoring of Parallel and Distributed Applications. In Proc. Euro-Par’98, Southampton, UK, September 1998, LNCS 1470, pp. 173-180. Springer-Verlag, 1998 [20] T. Fahringer, C. Seragiotto Jr.: Performance Analysis for Distributed and Parallel Java Programs. IEEE International Symposium on Cluster Computing and the Grid (CCGrid) 2005. http://dps.uibk.ac.at/ local/conferences/ccgrid/2005/pdfs/ 115.pdf [21] http://gpm.icsr.agh.edu.pl/ documentation/CG2.4.1-v1. 2-CYF-G-PMDeveloperManual.pdf
7