(the signaling messages ow across the same VCC or VPC as the data). ...... method is only applicable for special-purposes such as medical imaging or bulk data ...... the distribuiton process (NNTP, SMTP) or because numerous people react to ...
Diss. ETH No 11462
Tra c Estimation and Resource Allocation in ATM Networks A dissertation submitted to the
SWISS FEDERAL INSTITUTE OF TECHNOLOGY ZURICH for the degree of
Doctor of Technical Sciences presented by
Patrick W. Droz-Georget
Dipl. Inf. Ing. ETH born June 10th, 1963 citizen of La Chaux-de-Fonds and Le Locle accepted on the recommendation of Prof. Dr. B. Plattner, ETHZ, examiner Prof. Dr. J.-Y. Le Boudec, EPFL, co-examiner
1996
Acknowledgments First of all, I am very grateful to my advisor Prof. Dr. Bernhard Plattner and my co-advisor Prof. Dr. Jean-Yves Le Boudec. They have guided me through this thesis and gave me many suggestions to improve the contents of this work. By asking the right questions the topic was rounded o as well. Many thanks to the IBM Research Laboratory in R�uschlikon, Switzerland. It provided me with an excellent working environment in the sense of very competent people and of an enormously powerful computing environment. In particular I would like to express my gratitude to Dr. Erich Port and Dr. Douglas Dykeman for the many fruitful discussions on all aspects of this thesis and the support during my stay at the IBM Research Laboratory. In addition, I am grateful to my colleagues, namely Dr. Jean Cherbonnier, Michel Colmant, Dr. Marco Heddes, Dr. Ilias Iliadis. Andreas Meier, Dr. Fredy Neeser Dr. Paolo Scotton, and Dr. Harmen Van As. They helped me with various aspects of this thesis and were always open for general or very speci c discussions. Furthermore, they provided me with pointers to related work and publications. A special thanks goes to Dr. Tony Przygienda with whom I shared an o ce for almost the entire duration of this thesis work. We not only had many extremely animated discussions but also found the necessary distraction from work. Many thanks also to Lilli-Marie Pavka for correcting this manuscript. And last but not least, I am very grateful to my parents for supporting me during my work on this thesis.
Zusammenfassung Diese Dissertation untersucht Aspekte der Verwaltung von U� bertraguskapazit�aten und der Zutrittskontrolle von Verbindungen in Hochgeschwindigkeitsnetzwerken, im speziellen f�ur die Breitbandarchitektur \Asynchronous Transfer Mode" ATM. Gegenstand der Untersuchungen sind Kommunikationsverbindungen, die einen garantierten Service ben�otigen und dies durch einen Satz von Parametern spezi zieren. In ATM kann ein Benutzer bei einem Verbindungsaufbau zus�atzlich zur Zieladresse Parameter vorgeben, die genauere Aussagen u�ber das Erzeugungsmuster von Datenstr�omen zulassen. Dies sind beispielsweise eine maximal und eine durchschnittlich ben�otigte Senderate. Aufgrund von diesen Parametern muss im Netzwerk eine gewisse Menge von Ressourcen reserviert werden. Das Hauptproblem dabei ist nun diese \gewisse Menge" zu dimensionieren, damit die geforderte Qualit�at der Verbindung garantiert werden kann. Da die maximale Senderate ein obligatorischer Parameter ist, kann der geforderte Durchsatz durch eine Reservation des Maximums in jedem Fall garantiert werden. Auf der anderen Seite tendiert dies zu einer Ressourcen-Verschwendung. Deshalb muss der ideale Kompromiss gesucht werden zwischen Kunden-Zufriedenheit und einer hohen Netzwerkausn�utzung. Diese Problemstellung kann mit der Aufgabe einer Fluggesellschaft verglichen werden, die eine m�oglichst hohe Auslastung ihrer Flugzeuge anstrebt. Um dieses Ziel zu erreichen, werden mehr Sitzpl�atze verkauft, als eigentlich zur Verf�ugung stehen. Im Idealfall werden dann beim Ab�ug die u�berbuchten Pl�atze durch nicht erscheinende Passagiere kompensiert. F�ur ein Netzwerk kann eine Quelle, die unterhalb ihrer maximalen Rate oder u�berhaupt nicht sendet, mit einem nicht erscheinenden Passagier verglichen werden. In ATM teilen sich viele Verbindungen die einzelnen physikalischen Kommunikationskan�ale zwischen den verschiedenen Paketvermittlungsknoten. Es wird daher allgemein erwartet, dass sich durch die vielen Datenstr�ome eine gewisse Gl�attung ergibt. Durch solche Gl�attungse ekte kann die erforderliche Menge von Ressourcen f�ur eine bestimmte Verbindung verschieden sein, je nachdem wie das momentane Konglomerat aussieht, und es kann unter Umst�anden n�otig sein, Reservations�anderungen an bestehenden Verbindungen vorzunehmen, wenn andere Verbindungen auf- oder abgebaut werden. Da ATM eine neue Architektur f�ur Hochgeschwindigkeitsnetzwerke ist, gibt es noch keine fundierten Erfahrungswerte, wie der Verkehr aussehen wird. Nebst dem eigentlichen Verkehr ist auch die statistische Verteilung f�ur den Verbindungsauf- und -abbau unbekannt. Wegen der hohen Geschwindigkeiten und der vielen o enen Fragen sind Simulationen notwendig, die ein enormes Parameterspektrum abdecken, um gute Aussagen machen zu k�onnen. In dieser Arbeit wird zuerst eine allgemeine Einf�uhrung zum Themenkreis gegeben. Anschliessend folgt eine Einf�uhrung in ATM und Ressourcenverwaltung im allgemeinen. Danach wird eine ausgedehnte Literatur�ubersicht sowie eine Klassi kation davon pr�asentiert. Danach wird auf Verkehrssimulationen eingegangen und ein neues zweistu ges Verfahren vorgestellt, das Verkehr einschliesslich der Verkehrsparameter erzeugt. Das Verfahren ist sehr e zient und es erzeugt Messwerte, die gem�ass heutigen Erkenntnissen fraktale Eigenschaften aufweist. Darauf wird WAAN
- ein neuer, ausserordentlich dynamischer Zutrittskontrollalgorithmus basierend auf Wavelets - vorgestellt. Die Methode kann auch auf andere Netzwerkarchitekturen ausgeweitet werden. Anschliessend wird der Algorithmus mit Hilfe des Verkehrsgenerators evaluiert. Durch ausgedehnte Simulationen u�ber ein weites Spektrum von Parametern wird aufgezeigt, dass der Algorithmus sich sehr dynamisch und adaptiv verh�alt. Zus�atzlich wird demonstriert, wie Methoden aus der Signalverarbeitung sehr e ektvoll auf Ressourcenverwaltung angewendet werden k�onnen.
Abstract This thesis focuses on aspects of resource allocation and call admission control for high-speed networks, in particular for the asynchronous transfer mode (ATM). It includes connections that request guaranteed services speci ed by a set of parameters. Besides the desired destination address an ATM user can specify additional tra c parameters, e.g. peak cell rate and sustainable cell rate, that describe the behavior of the tra c generation pattern in more detail. Based on these values the network has to allocate a certain amount of resources. The key question is exactly how much \a certain amount" has to be in order to ful ll the quality-of-service requirements. As the peak cell rate is mandatory for every connection it is of course possible to make a peak rate allocation. On the other hand peak rate allocation tends to waste resources. Therefore, a tradeo between customer satisfaction and resource utilization has to be made. This can be compared to the way airlines book seats. Because they expect some no-show passengers, they sell more seats than are actually available on the plane. In terms of networking \noshow" refers to idle periods or periods when data is generated below the maximum possible value. In ATM many connections are multiplexed onto the same link. For this reason it is expected that a certain smoothing of the tra c will take place. This can even make resource allocation dependent on the set of connections currently established, and changes may be necessary to existing connections when other connections are torn down or set up. ATM is a new high-speed networking architecture, so no real-world tra c measurements are available yet. Besides the actual tra c, the call arrival and departure processes are also unknown. Because of the high-speed and very restrictive qualityof-service measures, extensive simulations are necessary to assess the performance of a call admission control or resource allocation algorithm. Owing to the many open parameters, a wide parameter spectrum often has be covered in order to arrive at reasonable conclusions. In this work, a general introduction to the subject followed by introductory information about ATM and resource allocation in general is given rst. Then an extended literature overview and a classi cation will be presented. Next, the focus is placed on tra c simulation. Di erent methods will be shown and some traditional tra c models described. Thereafter, a new two-level high-speed tra c generator based on fractals will be presented. Besides the actual tra c, the tra c parameters for the call arrival and departure processes are generated as well. Then WAAN, a new call admission control algorithm based on wavelets, will be presented. The algorithm is extremely adaptive and thus can cope with greatly varying tra c dynamics. It is not restricted to ATM technology and can be used for other high-speed networking architectures. The algorithm is then evaluated with the help of the tra c generator over a wide spectrum of tra c parameters. Extensive simulation results will be presented that show the performance of the algorithm. The simulation will reveal the e ectiveness of signal processing approaches for resource management and call admission control in high speed-networks.
Contents 1 Introduction
1.1 Brief Introduction into ATM networks : : : : : : : : : : 1.1.1 ATM QoS Parameters : : : : : : : : : : : : : : : 1.1.2 ATM Tra c Parameters : : : : : : : : : : : : : : 1.1.3 Burstiness : : : : : : : : : : : : : : : : : : : : : : 1.1.4 Tra c Parameter Measurement and Enforcement 1.2 Resource Allocation : : : : : : : : : : : : : : : : : : : : : 1.2.1 Peak Rate Allocation : : : : : : : : : : : : : : : : 1.2.2 Minimum Capacity Allocation : : : : : : : : : : : 1.2.3 Tra c Behavior Speci cation and Allocation : : : 1.2.4 Dynamic Adaptation to Tra c Behavior : : : : : 1.2.5 From STM to ATM : : : : : : : : : : : : : : : : : 1.3 The Research Agenda : : : : : : : : : : : : : : : : : : : :
2 Literature Overview
2.1 Method A: by Turner : : : : : : : : 2.1.1 Description of the Method : 2.1.2 Evaluation of the Method : 2.2 Method B: by Boyer and Tranchier 2.2.1 Description of the Method : 2.2.2 Evaluation of the Method : 2.3 Method C: by Hui : : : : : : : : : 2.3.1 Description of the Method : 2.3.2 Evaluation of the Method : 2.4 Method D: by G�uerin and G�un : : 2.4.1 Description of the Method : 2.4.2 Evaluation of the Method : 2.5 Method E: by Bolla et al. : : : : : 2.5.1 Description of the Method : 2.5.2 Evaluation of the Method : 2.6 Method F: by Knobling and Renger 2.6.1 Description of the Method : 2.6.2 Evaluation of the Method : 2.7 Method G: by Suzuki and Tobagi : 2.7.1 Description of the Method : 2.7.2 Evaluation of the Method : 2.8 Method H: by Mishra and Tripathi 2.8.1 Description of the Method :
: : : : : : : : : : : : : : : : : : : : : : :
: : : : : : : : : : : : : : : : : : : : : : :
: : : : : : : : : : : : : : : : : : : : : : :
: : : : : : : : : : : : : : : : : : : : : : :
: : : : : : : : : : : : : : : : : : : : : : :
: : : : : : : : : : : : : : : : : : : : : : :
: : : : : : : : : : : : : : : : : : : : : : :
: : : : : : : : : : : : : : : : : : : : : : :
: : : : : : : : : : : : : : : : : : : : : : :
: : : : : : : : : : : : : : : : : : : : : : :
: : : : : : : : : : : : : : : : : : : : : : :
: : : : : : : : : : : : : : : : : : : : : : :
: : : : : : : : : : : : : : : : : : : : : : : : : : : : : : : : : : :
: : : : : : : : : : : : : : : : : : : : : : : : : : : : : : : : : : :
: : : : : : : : : : : : : : : : : : : : : : : : : : : : : : : : : : :
: : : : : : : : : : : : : : : : : : : : : : : : : : : : : : : : : : :
: : : : : : : : : : : : : : : : : : : : : : : : : : : : : : : : : : :
: : : : : : : : : : : : : : : : : : : : : : : : : : : : : : : : : : :
: : : : : : : : : : : : : : : : : : : : : : : : : : : : : : : : : : :
1
4 7 8 9 10 10 10 11 11 12 12 14
17 17 17 21 21 21 24 24 24 27 27 27 30 31 31 34 35 35 37 37 37 38 38 38
2.8.2 Evaluation of the Method : : 2.9 Method I: by Crosby : : : : : : : : : 2.9.1 Description of the Method : : 2.9.2 Evaluation of the Method : : 2.10 Method J: by DuBose and Kim : : : 2.10.1 Description of the Method : : 2.10.2 Evaluation of the Method : : 2.11 Method K: by Li, Chong and Hwang 2.11.1 Description of the Method : : 2.11.2 Evaluation of the Method : :
: : : : : : : : : :
: : : : : : : : : :
: : : : : : : : : :
: : : : : : : : : :
: : : : : : : : : :
: : : : : : : : : :
: : : : : : : : : :
: : : : : : : : : :
: : : : : : : : : :
3 Comparison and Classi�cation of the Methods
3.1 Comparison : : : : : : : : : : : : : : : : : : : : : : : 3.1.1 Source Description Parameters : : : : : : : : : 3.1.2 Scope of the Method : : : : : : : : : : : : : : 3.1.3 Statistical versus Measurement-Based Models 3.1.4 Application Granularity : : : : : : : : : : : : 3.1.5 Resource Allocation Level : : : : : : : : : : : 3.1.6 Additional Protocol : : : : : : : : : : : : : : : 3.1.7 Global versus Local Application : : : : : : : : 3.1.8 Complexity of the Method : : : : : : : : : : : 3.2 Critique and Motivation for a New Proposal : : : : :
4 Tra�c Simulation
4.1 Introduction to Tra c Simulation : : : : : : 4.2 Source Models : : : : : : : : : : : : : : : : : 4.2.1 File Transfer Protocol FTP : : : : : 4.2.2 Self-similar Ethernet tra c : : : : : 4.2.3 Voice Tra c (Telephony) : : : : : : : 4.2.4 Multimedia Tra c (Video/Voice) : : 4.2.5 World Wide Web (MOSAIC) : : : : 4.3 Di culties of Tra c Modeling : : : : : : : : 4.3.1 Why Aggregated Tra c : : : : : : : 4.4 Aggregated Tra c Models based on Fractals 4.4.1 Introduction to Self-Similarity : : : : 4.4.2 Hurst Parameter Estimation : : : : : 4.4.3 Fractional Brownian Motion (fBm) : 4.5 The Tra c Generator : : : : : : : : : : : : : 4.5.1 Tra c Generator Analyses : : : : : :
: : : : : : : : : : : : : : :
: : : : : : : : : : : : : : :
: : : : : : : : : : : : : : :
: : : : : : : : : : : : : : :
: : : : : : : : : : : : : : :
: : : : : : : : : : : : : : : : : : : : : : : : : : : : : : : : : : :
: : : : : : : : : : : : : : : : : : : : : : : : : : : : : : : : : : :
: : : : : : : : : : : : : : : : : : : : : : : : : : : : : : : : : : :
: : : : : : : : : : : : : : : : : : : : : : : : : : : : : : : : : : :
: : : : : : : : : : : : : : : : : : : : : : : : : : : : : : : : : : :
: : : : : : : : : : : : : : : : : : : : : : : : : : : : : : : : : : :
: : : : : : : : : : : : : : : : : : : : : : : : : : : : : : : : : : :
: : : : : : : : : : : : : : : : : : : : : : : : : : : : : : : : : : :
: : : : : : : : : : : : : : : : : : : : : : : : : : : : : : : : : : :
39 39 39 40 40 40 42 43 43 44
47 47 47 48 49 50 51 51 52 53 53
57 57 59 59 59 60 60 60 61 61 62 64 65 66 69 70
5 The WAAN CAC Algorithm 5.1 5.2 5.3 5.4 5.5
5.6 5.7 5.8 5.9 5.10
Statement of Problem and Requirements : : : : : : : Introduction to Wavelets : : : : : : : : : : : : : : : : General Architecture of the WAAN CAC : : : : : : : Synthetic Model : : : : : : : : : : : : : : : : : : : : : Resource Manager : : : : : : : : : : : : : : : : : : : 5.5.1 Call Arrivals and Increases : : : : : : : : : : : 5.5.2 Call Departures and Decreases : : : : : : : : : 5.5.3 New E ective Capacity : : : : : : : : : : : : : 5.5.4 Launch New Calculation and Save Old Value : 5.5.5 Input from the Queue Manager : : : : : : : : Digital Signal Processor (DSP) : : : : : : : : : : : : 5.6.1 Calculation of the E ective Capacity : : : : : Sampler : : : : : : : : : : : : : : : : : : : : : : : : : In�uence of Filter Basis : : : : : : : : : : : : : : : : Application Area : : : : : : : : : : : : : : : : : : : : Feasibility : : : : : : : : : : : : : : : : : : : : : : : :
: : : : : : : : : : : : : : : :
: : : : : : : : : : : : : : : :
: : : : : : : : : : : : : : : :
: : : : : : : : : : : : : : : :
: : : : : : : : : : : : : : : :
: : : : : : : : : : : : : : : :
: : : : : : : : : : : : : : : :
: : : : : : : : : : : : : : : :
79
: 79 : 80 : 87 : 89 : 90 : 90 : 91 : 92 : 92 : 94 : 95 : 95 : 97 : 97 : 101 : 102
6 Simulations and Interpretations
105
7 Conclusion and Outlook
121
A Abbreviations
125
B Diagrams with Bu�er Utilization of 0.3
127
C Maximum Bu�er Filling
128
D Average Bu�er Occupnacy
129
References
130
6.1 The WAAN CAC Simulator : : : : : : : : : : : : : : : : : : : : : : : 105 6.2 Simulation Results : : : : : : : : : : : : : : : : : : : : : : : : : : : : 109
7.1 Future Research Topics : : : : : : : : : : : : : : : : : : : : : : : : : : 121 7.2 Conclusion : : : : : : : : : : : : : : : : : : : : : : : : : : : : : : : : : 122
List of Figures 1 2 3
ATM cell structure : : : : : : : : : : : : : : : : : : : : : : : : : : : : 6 B-ISDN Protocol Reference Model : : : : : : : : : : : : : : : : : : : : 7 Link bu er : : : : : : : : : : : : : : : : : : : : : : : : : : : : : : : : : 18
4 5 6 7 8 9 10 11 12 13 14 15 16 17 18 19 20 21 22 23 24 25 26 27 28 29 30 31 32 33 34 35 36 37 38 39 40 41 42
FRP/DT reference con guration : : : : : : : : : : : : : : : Time-scaled tra c entities : : : : : : : : : : : : : : : : : : Equivalent capacity : : : : : : : : : : : : : : : : : : : : : : Hierarchical control structure : : : : : : : : : : : : : : : : Two state Markov chain : : : : : : : : : : : : : : : : : : : SDL description of the CAC method : : : : : : : : : : : : Block-diagram of the dynamic algorithm : : : : : : : : : : FIR lter of order 2000 (generated with Kaiser window) : Process hierarchy : : : : : : : : : : : : : : : : : : : : : : : Generated tra c (time unit 10;3 s) : : : : : : : : : : : : : Generated tra c (time unit 10;2 s) : : : : : : : : : : : : : Generated tra c (time unit 10;1 s) : : : : : : : : : : : : : Generated tra c (time unit 1s) : : : : : : : : : : : : : : : Generated tra c (time unit 10s) : : : : : : : : : : : : : : : R/S analysis: H = 0.796 : : : : : : : : : : : : : : : : : : : Variance time plot: H = 0.795 : : : : : : : : : : : : : : : : Peak rate, mean rate, and tra c (time-resolution 10;3 s) : R/S and variance time plot Hurst analyses: H = 0.5 : : : : Peak, mean, and tra c with H = 0.5 : : : : : : : : : : : : R/S and variance time plot Hurst analyses: H = 0.6 : : : : Peak, mean, and tra c with H = 0.6 : : : : : : : : : : : : R/S and variance time plot Hurst analyses: H = 0.7 : : : : Peak, mean, and tra c with H = 0.7 : : : : : : : : : : : : R/S and variance time plot Hurst analyses: H = 0.9 : : : : Peak, mean, and tra c with H = 0.9 : : : : : : : : : : : : Fast Wavelet Transformation Algorithm : : : : : : : : : : Daubechies 2 (Haar) lters : : : : : : : : : : : : : : : : : : Frequency response of a Daubechies 2 (Haar) lter : : : : : Wavelet and scale function of a Daubechies 2 (Haar) lter Daubechies 16 lters : : : : : : : : : : : : : : : : : : : : : Frequency responses of a Daubechies 16 lters : : : : : : : Wavelet and scale function of Daubechies 16 lters : : : : Spline 16/8 lters : : : : : : : : : : : : : : : : : : : : : : : Frequency responses of spline 16/8 lter : : : : : : : : : : Wavelet and scale function of the spline lters : : : : : : : Wavelet hierarchy : : : : : : : : : : : : : : : : : : : : : : : General architecture : : : : : : : : : : : : : : : : : : : : : Call arrival or renegotiation for an increase : : : : : : : : : Call departure or renegotiation for a decrease : : : : : : :
: : : : : : : : : : : : : : : : : : : : : : : : : : : : : : : : : : : : : : :
: : : : : : : : : : : : : : : : : : : : : : : : : : : : : : : : : : : : : : :
: : : : : : : : : : : : : : : : : : : : : : : : : : : : : : : : : : : : : : :
: : : : : : : : : : : : : : : : : : : : : : : : : : : : : : : : : : : : : : :
: : : : : : : : : : : : : : : : : : : : : : : : : : : : : : : : : : : : : : :
: : : : : : : : : : : : : : : : : : : : : : : : : : : : : : : : : : : : : : :
22 25 31 32 33 36 43 44 68 71 71 71 71 71 72 72 73 73 74 74 75 75 76 76 77 81 82 82 83 83 84 84 85 85 86 87 88 91 92
43 44 45 46 47 48 49 50 51 52 53 54 55 56 57 58 59 60 61 62 63 64 65 66 67 68 69 70 71 72 73 74 75 76 77 78 79 80 81 82
New estimate becomes available : : : : : : : : : : : : : : Remember old value and trigger new calculation : : : : : Sampling windows : : : : : : : : : : : : : : : : : : : : : Cell losses occurred : : : : : : : : : : : : : : : : : : : : : Cell-loss-free period passed : : : : : : : : : : : : : : : : : Calculation of the new e ective capacity : : : : : : : : : Daubechies lters: size 2 : : : : : : : : : : : : : : : : : : Daubechies lters: size 16 : : : : : : : : : : : : : : : : : Spline Wavelets : : : : : : : : : : : : : : : : : : : : : : : WAAN CAC simulator : : : : : : : : : : : : : : : : : : : Operation of the WAAN CAC simulator : : : : : : : : : Signal/noise separation (input, signal and noise) : : : : : Tra c: � = 0:7, H = 0:8 : : : : : : : : : : : : : : : : : : Tra c: � = 0:3, H = 0:8 : : : : : : : : : : : : : : : : : : Statistical gain for H = 0.9 : : : : : : : : : : : : : : : : : Statistical gain for H = 0.9, with 95% con dence interval Statistical gain for H = 0.9, bu er utilization 0.1 : : : : : Statistical gain for H = 0.8 : : : : : : : : : : : : : : : : : Statistical gain for H = 0.8, with 95% con dence : : : : Statistical gain for H = 0.8, a zoom : : : : : : : : : : : : Statistical gain for H = 0.7 : : : : : : : : : : : : : : : : : Statistical gain for H = 0.7, with 95% con dence : : : : Statistical gain for H = 0.7, a zoom : : : : : : : : : : : : Statistical gain for H = 0.6 : : : : : : : : : : : : : : : : : Statistical gain for H = 0.6, with 95% con dence : : : : Statistical gain for H = 0.6, a zoom : : : : : : : : : : : : Statistical gain for H = 0.5 : : : : : : : : : : : : : : : : : Statistical gain for H = 0.5, with 95% con dence : : : : Statistical gain for H = 0.5, a zoom : : : : : : : : : : : : Statistical gain for H = 0.4 : : : : : : : : : : : : : : : : : Statistical gain for H = 0.4, with 95% con dence : : : : Statistical gain for H = 0.4, a zoom : : : : : : : : : : : : Statistical gain for � = 0:9 and � = 0:8 : : : : : : : : : : Statistical gain for � = 0:7 and � = 0:6 : : : : : : : : : : Statistical gain for � = 0:5 and � = 0:4 : : : : : : : : : : Statistical gain for � = 0:3, � = 0:2, and � = 0:1 : : : : : Statistical gain for a bu er utilization of 0.3 : : : : : : : Maximal bu er lling : : : : : : : : : : : : : : : : : : : : Mean bu er occupancy : : : : : : : : : : : : : : : : : : : The author : : : : : : : : : : : : : : : : : : : : : : : : :
: : : : : : : : : : : : : : : : : : : : : : : : : : : : : : : : : : : : : : : :
: : : : : : : : : : : : : : : : : : : : : : : : : : : : : : : : : : : : : : : :
: : : : : : : : : : : : : : : : : : : : : : : : : : : : : : : : : : : : : : : :
: : : : : : : : : : : : : : : : : : : : : : : : : : : : : : : : : : : : : : : :
: : : : : : : : : : : : : : : : : : : : : : : : : : : : : : : : : : : : : : : :
: : : : : : : : : : : : : : : : : : : : : : : : : : : : : : : : : : : : : : : :
: 93 : 93 : 94 : 94 : 95 : 96 : 98 : 99 : 100 : 105 : 106 : 107 : 107 : 108 : 109 : 110 : 111 : 112 : 112 : 112 : 113 : 113 : 113 : 114 : 114 : 114 : 115 : 115 : 115 : 116 : 116 : 116 : 118 : 118 : 118 : 119 : 127 : 128 : 129 : 141
List of Tables 1 2 3 4 5 6 7 8 9 10 11 12
Voice service types : : : : : : Data service types : : : : : : Video service types : : : : : : Author to method mapping : Source description parameters Scope of the method : : : : : Imposed source model : : : : Granularity : : : : : : : : : : Reservation allocation level : : Additional requirements : : : Operation level : : : : : : : : Overall complexity : : : : : :
: : : : : : : : : : : :
: : : : : : : : : : : :
: : : : : : : : : : : :
: : : : : : : : : : : :
: : : : : : : : : : : :
: : : : : : : : : : : :
: : : : : : : : : : : :
: : : : : : : : : : : :
: : : : : : : : : : : :
: : : : : : : : : : : :
: : : : : : : : : : : :
: : : : : : : : : : : :
: : : : : : : : : : : :
: : : : : : : : : : : :
: : : : : : : : : : : :
: : : : : : : : : : : :
: : : : : : : : : : : :
: : : : : : : : : : : :
: : : : : : : : : : : :
: : : : : : : : : : : :
: : : : : : : : : : : :
: : : : : : : : : : : :
41 41 41 47 48 48 49 50 51 52 52 53
1 Introduction The requirements and framework conditions of computer networks have undergone tremendous changes in recent years. This trend will continue in the future. New applications and extensions to existing services demand new functions and improvements of communication infrastructures. Therefore, network providers and manufacturers are constantly challenged by the pressure from the market to come up with new solutions and ideas. An enormous amount of research e ort is necessary to cope with the fast-growing demand for networking infrastructures. In the early stage of communications, the trend was to have distinct networks for di erent applications. This led to a network for voice communication, i.e. the plain old telephone system, to data networks such as X.25, and local area networks such as Ethernet or the token ring. All these networks aimed to ful ll the requirements of a more or less special purpose. On the other hand, such a specialization has the advantage that the particular demands can be met with high accuracy, i.e. the network can be engineered to meet the requirements. The disadvantage of specialpurpose networks is that they are only appropriate as long the initial assumptions for which they were designed are valid. New applications very often cannot be accommodated in such an environment because the initial boundaries were set too tightly to cope with future demands. In addition, the multitude of networks leads to resource fragmentation, i.e. unused transmission capacities in one network cannot be used by one of the other networks. Furthermore, the multitude of networks requires networking equipment for the di erent networks, thus increasing the overall costs of the communication infrastructure. Owing to the trend towards pure digital communication it is possible to integrate various services in the same network. The originally analog transmission of voice has been replaced by digitized voice to a very high degree and in the future the analog system will disappear completely. Another important aspect of modern telecommunications is the trend towards global communication, which demands the interconnection of networking equipment all around the globe. The Internet, for example, attracted an enormous amount of attention in 1995. The relatively new application called the world wide web (WWW) has opened the door to global communications even for nontechnicia people and those outside of academia. This globalization demands communication facilities from the local area to the wide area in a very transparent way, e.g. local and long-distance communication should be indistinguishable to users. The general advances in the computing industry also created new framework conditions. New processor architectures have drastically enhanced the performance of computers and networking devices such as routers. The spread of optical bers makes it possible to have very high-speed networks. Optical transmission compared to copper transmission features very low bit-error rates because bers experience no interference with each other. In the early days of networking many networks were designed under the assumption of poor network links. X.25 for instance implements a reliable hop-by-hop transmission protocol that is highly complex. With very reliable links, however, such an architecture becomes obsolete. The redundancy in the networking infrastructure leads to the very fundamental concept of an integrated network that is suitable for many di erent applications.
The rst step in this direction was the introduction of the integrated services digital network (ISDN). This service was intended to transmit voice and data in digital form. For this purpose xed transmission rates of 64 kbit/s were employed. At that time a rate of 64 kbit/s was necessary to transmit digitized voice. Owing to new coding and compression techniques this rate could be decreased to about half of that originally expected rate, thus wasting a unused resources. The assignment of xed minimum rates has made the service questionable regarding versatility and �exibility. New applications such as video on demand or high-end video conferencing add to the limitations of ISDN because very high-speed services cannot be realized economically. ISDN comes from the carrier market, which often has to deal with real-time applications such as voice for which certain performance guarantees are necessary, i.e. delay and throughput for an acceptable communication. On the other hand networks for data communication in the local area have higher transmission capacities but lack the notion of quality of service (QoS) guarantees that can be selected by applications.. Therefore, there is a strong demand for a truly versatile networking architecture that can cope with all kinds of applications, today and in the future. This architecture should have the intrinsic property of being scalable in terms of distance and performance to form global and �exible high-speed networks that can cope with high tra c dynamics and an extremely wide spectrum of tra c characteristics. Indeed, these are very high goals, and it is not surprising that such a networking architecture will have to integrate even more functions already present in one form or another in existing special-purpose networks. One of the most fundamental requirements is the concept of QoS guarantees because real-time applications are emerging extremely quickly. Whenever QoS requirements are present the following ve functions are mandatory. First, a QoS speci cation is necessary that describes what is needed in terms of transmission capacity. This can either be a simple peak rate or a more elaborate description of the tra c generation pattern, i.e. the statistical properties of the idle and active periods of an on/o source. The �ow speci cation can be viewed as a contract between a user and the network. At the access to the network the user is usually checked whether for conformity to its negotiated contract. Because of its authoritative nature this function is often called policing. Without policing it would be impossible for the network to allocate networking resources optimally because the variability of the source behavior would be far too high. Second, QoS routing is the task of determining possible paths through the network that ful ll the requested QoS requirements. In the presence of several metrics, i.e. transmission rate, delay, and delay variation, this function can reach a very high numerical complexity. The routing component maintains a topology database that stores for each link the associated link metrics such a maximal transmission capacity and currently reserved capacity. The computation can be done on demand e.g. at the time a route request arrives or routes can be precomputed. In the case of precomputed routes, the routing triggers a new path computation as soon as the changes in the topology database exceed certain limits. For routing the trend is towards distributed algorithms that exchange knowledge with their neighbors to nd paths between source and destination pairs, called source routing, compared to
hop-by-hop routing where upon each hop, only the next hop is provided. Third, a resource allocation function has to determine how much networking resource, i.e. bu ers or time slots, have to be reserved for the user to guarantee the desired quality of service. The reservation can either be done in a central or distributed way. The general trend is towards distributed allocation because of the speed and the more accurate view of the local allocation state. The allocation process is usually applied to every leg, i.e. per link on which resources can become a bottleneck. This increases the �exibility because transmission legs with di erent properties can be present. Owing to high tra c dynamics of certain applications the optimal allocation of network resources plays a key role in achieving high network utilization while still ful lling QoS requirements. Too optimistic reservations can readily lead to congestion situations in the network or even tra c losses. On the other hand an optimal allocation can increase the utilization but still ful ll the QoS requirements of most of the connections. The tradeo to be made is between user satisfaction and network utilization. In the local area where link costs are usually low, customer satisfaction is often more important than in the wide area, where expensive links often make utilization a predominant objective. Whenever changes of the allocated resources exceed certain limits it is communicated to the routing component. Routing is responsible for spreading the changes across the network to be re�ected in the global view that the routing maintains. Because of the relatively short holding times of some connections the resource allocation function does not show every single change to the routing function. State-of-the art routing algorithms with several metrics can only accommodate changes in the range of about every 0.5 second. Fourth, admission control is a component that grants or refuses access to the network. The QoS concept always requires the notion of a connection with tra c and QoS parameters. In the telephony network this is static and implicit. When placing a phone call one has only to supply the destination address. Because of the limited one-type service the network knows a priori the amount of resources necessary to support the new call. In a �exible network at call setup the user speci es the destination and the required service by a set of parameters. According to the supplied parameters the network has to decide whether to accept or reject the new connection. The decision is heavily dependent on the speci ed set of parameters and the current load in the network. The admission control has to be done for every leg on which resource allocation has to be performed. In most cases the acceptance decision is done on a per link basis. If all links along the path can guarantee the desired QoS requirements the new connection is accepted. The checking for acceptance can be done centralized or distributed i.e. hop-by-hop. The general trend however, is towards distributed methods. Fifth, packet scheduling is the determination of when to transmit which packet. A packet in this context is a certain unit of data. This is required to determine the service discipline for the various connections. The function can be highly complex in the presence of tra c classes that have higher priorities than others. In high-speed networks the bu er queues are usually rather small, so there is not much room left for sophisticated service disciplines. The scheduling is then often reduced to the decision whether to schedule or drop the packet. An important point is that only
packets of connections that can su er a certain amount of losses are dropped, i.e. for a video connection minor losses are acceptable. For this purpose the packets often contain certain �ags that indicate whether losses are acceptable or not. The main subject of this thesis is call admission control (CAC) and, a subcomponent thereof, resource allocation. The allocation process is based on periodic analyses of tra c measurements. The method is a hop-by-hop architecture that has to be applied on every outgoing link. By running several instances of the method one can use it for di erent tra c classes or groups of connections. Owing to its opaque design it can be used for di erent high-speed networks. The architecture is, however, presented in the context of the asynchronous transfer mode (ATM), which is the transfer mode of the future broadband integrated services digital network (BISDN) selected by CCITT. The term transfer mode is used by CCITT to denote a networking technique that involves transmission multiplexing and switching. The following subsections will present introductory information about ATM and resource management in general. Throughout the thesis, abbreviations will be introduced when they rst appear. An alphabetical list of all abbreviations used can be found in appendix A.
1.1 Brief Introduction into ATM networks Asynchronous Transfer Mode (ATM) �Uni94, Uni93, Atm93, Syk91, Bou91] is the networking architecture for broadband networks recommended by the CCITT Study Group XVIII on ISDN Broadband Aspects. ATM is a packed-oriented switching and multiplexing technique for transferring future broadband communication services �Cic93, Pat93] having a wide spectrum of tra c statistics and Quality-ofService (QoS) requirements. ATM o ers higher bit rates and greater �exibility than Synchronous Transfer Mode (STM). By statistical multiplexing of many individual connections onto the same link, ATM networks achieve a higher utilization of the network. In STM, xed time slots are assigned to the individual connections, which can only be occupied by these particular connections, thus making transmission capacity allocation straightforward. On the other hand, ATM networks demand a more sophisticated Call Admission Control (CAC) algorithm and congestion control method in order to achieve a statistical multiplexing gain and simultaneously ful ll QoS requirements. Contrary to the general expectation that ATM would rst make its way into Wide Area Networks (WAN) for broadband services, it is now more likely to enter the Local Area Network (LAN) �Bou92] environment for special high-speed applications rst. During its deployment �Ver92, Kli93] as well as in the future, ATM will have to coexist with other network architectures. Therefore, �exible inter-networking architectures �All95, Dro94] and converters such as bridges and routers are needed to merge the various techniques. Currently, a considerable e ort is being put into the standardization of the Private Network to Network Interface (PNNI) �Pnn95], which will provide the interface to build up entire hierarchies of heterogeneous ATM LANs and even WANs. ATM is a packet-oriented switching and multiplexing technique based on xed-size cells. The cells consist of a header and a payload section, and are sent in sequence
along the connection. The cells themselves carry the routing information inside their header by means of labels. The technique is asynchronous in the sense that cells of a particular connection may appear at irregular time intervals on the link. All cells belonging to a certain connection on a link have the same labels. ATM is connection-oriented, i.e. before data can be sent between a source and a destination a call establishment process has to be executed, which is basically the same as making a phone call. During the call setup phase a Virtual Channel (VC) is set up between the source and the destination. This process involves reserving labels along the path and reserving resources. In Open Systems Interconnection (OSI) terms, ATM provides asynchronous time division multiplexing of ATM Protocol Data Units (PDU), which are cells. The labels consist of two parts, the Virtual Path Identi�er (VPI) and the Virtual Channel Identi�er (VCI). These two identi ers de ne a routing hierarchy. A VP can bundle connections with di erent VCIs. For the routing along the path the labels are looked at, resolved and replaced (label swapping). This processing is done in the hardware because ATM supports link speeds up to several gigabits per second. For connections belonging to a Virtual Path (VP), only the VPI is swapped, the VCIs are xed and end-to-end. For a VC both labels may be swapped at each hop along the path. The call establishment processes for Virtual Path Connections (VPC) and Virtual Channel Connections (VCC) are basically the same but some internal data structures to attach the VCC to the corresponding VPC are di erent. There is always a forward and a backward direction per connection, but the QoS and tra c parameters may be di erent. For signaling and management purposes some labels are reserved and the connections are established at startup of a networking node, which are often called hubs. ATM supports point-to-point and point-to-multipoint connections. It is expected that in the future multipoint-to-multipoint connections will be supported as well. The layout of an ATM cell is depicted in Fig. 1. The header consists of 5 bytes and the payload of 48 bytes. In general the cell layout is xed with one exception. At the User Network Interface (UNI) the VPI eld is 8 bits long whereas on the Network to Network Interface (NNI) it is 12 bits in order to increase the number of possible VPCs. The additional 4 bits are taken from the GFC eld. The elds of the cell header are: Generic Flow Control (GFC): this 4-bit eld is used for the generic �ow control mechanism supported at the UNI. The �ow is controlled towards the network. At the NNI the bits are part of the VPI. Virtual Path/Channel Identi�er (VPI/VCI): the two elds contain the routing information. The VPI indicates the virtual path and the VCI determines the virtual channel inside the virtual path. Several VPs can share a physical network link. Payload Type (PT): this 3-bit eld indicates the type of the payload. It signals whether it is user data or connection associated layer management information. In addition, it is used to indicate congestion states and for resource management.
Figure 1: ATM cell structure Cell Loss Priority (CLP): this bit can be used by the user to indicate explicitly whether losses are acceptable. Header Error Check (HEC): this eld is used for the detection and correction of a one-bit error inside the header. In addition, it is used for cell delineation (cell border detection).
The protocol layers are depicted in the gure 2. The lowest two layers are common to the user and control plane. The user plane provides the interface for user data transfer. The control plane provides all functions concerning connection control functions and switching services, i.e. routing, signaling, and network management. The management plane consists of two parts, the plane management and the layer management. The management plane is to provide an interface between the user and the control plane. The plane management involves management tasks concerning the entire system, whereas layer management only operates between di erent layers. The ATM Adaptation Layer (AAL) provides di erent transportation modes for di erent purposes. They meet the requirements for voice, video, and other types of connections. There is also an adaptation layer for the control plane that provides a reliable communication vehicle for signaling purposes called Signaling ATM Adaptation Layer (SAAL). There are general design goals stated in the UNI document that tra c control and congestion control must be independent of the AALs and any other higher layers.
Figure 2: B-ISDN Protocol Reference Model The reason for this is to be independent of the evolution of AALs. In addition, the complexity of tra c control and congestion control should be minimized and the utilization maximized, which is a somewhat contradictory statement, especially if QoS requirements are present, i.e. peak rate allocation is simple but network utilization is rather poor.
1.1.1 ATM QoS Parameters Seven QoS parameters have been established so far by the ATM Forum: Cell Error Ratio: the quotient of errored cells and total number of error-free and errored transmitted cells. Severely Errored Cell Block Ratio: same as the rst one but calculated in terms of cell blocks. A cell block is the number of cells that are transmitted between two Operation And Maintenance (OAM) cells. OAM cells are for instance used for performance monitoring and failure detection. Cell Loss Ratio: the number of lost cells divided by the total number of transmitted cells. Cell Misinsertion Ratio: the number of misinserted cells divided by the time interval. Misinsertion is usually caused by header errors when the labels suddenly point to another connection. Cell Transfer Delay: total time between source and destination UNI, it includes all processing delays in the individual nodes along the path as well as all the propagation delays on the links.
Mean Cell Transfer Delay: the arithmetic average of a speci ed number of cell transfer delays for one or more connections. Cell Delay Variation: there are two performance parameters associated with cell delay variation, a 1-point and a 2-point criterion. The 1-point criterion de nes the variability of the cell arrival process observed on a single measurement point with reference to the speci ed peak rate. The 2-point relation captures the variation between a source and destination pair.
Of these parameters, the cell loss rate, the cell transfer delay, and the cell delay variation play outstanding roles. The cell loss rate is usually de ned on a perlink basis and is very strongly in�uenced by the link bu er size and the resource allocation method. Cell transfer delay and cell delay variation are speed-related parameters� they are dependent on the link lengths along the path as well as the queuing strategies and service discipline at the output of the link bu ers. They are important for real-time applications. Not all of these parameters are completely speci ed i.e. the exact block size is not yet de ned. It is also possible that new parameters will be added in the future.
1.1.2 ATM Tra�c Parameters The tra c parameters describe tra c characteristics of an ATM connection. The parameters are de ned according to a reference model based on the Generic Cell Rate Algorithm (GCRA). The GCRA is based on a virtual scheduling algorithm that checks the conformance of the peak rate whereas a continuous-state leaky bucket algorithm determines the conformance of the sustainable cell rate. The GCRA uses two parameters, an increment and a limit. The two algorithm together determine for each cell whether it complies with the negotiated tra c contract. The GCRA is only a recommendation and a network provider is not obliged to implement it. Currently there are three tra c parameters de ned: Peak Cell Rate: the highest possible speed with which a connection can transmit data over the established connection. The enforcement of this parameter by the User Parameter Control (UPC) algorithm allows the network to allocate su cient resources to meet the requested network performance objectives, i.e. cell loss rate. The parameter is mandatory for every connection. It is speci ed in cells per second and will be denoted by the letter R throughout this thesis. Sustainable Cell Rate: an upper bound of the conforming average cell rate of an ATM connection. The mean rate itself is the the total number of transmitted cells divided by the connection's lifetime. There is a subtle di erence between the mean cell rate and the sustainable cell rate, which lies in the interpretation of the connection lifetime. For the sustainable cell rate the lifetime is measured from the emission of the rst cell until the GCRA returns to zero after emission of the last cell (conforming average). Throughout this thesis as well as in most of the literature the two terms sustainable and mean cell rate are used interchangeably. This optional parameter is speci ed in cells per second and will be denoted by the letter m.
Burst Tolerance: this parameter together with peak and sustainable cell rate de nes a maximum burst size. The relation is:
� b = 1 + RmR� ;m where � is the burst tolerance and b the maximum burst size. The maximum burst size is speci ed in cells. The parameter � is a limit parameter used by the GCRA, it represents the minimum idle time after the transmission of a maximum bursts. In this thesis the maximum burst size b will be used. In most of the literature about ATM networks the notion of a mean burst size is used. The burst tolerance is an optional parameter that only makes sense together with m and R. The QoS parameters and the tra c parameters are supplied at the moment of call initiation. They are used in the call admission procedure to decide whether to accept or reject a connection and to reserve network resources such as transmission capacity or bu ers.
1.1.3 Burstiness An important property of networking tra c is its burstiness �Fro94]. Many traf c types produce bursty tra c, e.g. compressed videos and voice communication. Burstiness occurs in the arrival process when the arrival points appear in visual clusters with relatively large periods between clusters. Although its mathematical de nition is complex, burstiness can be expressed by the shape of the marginal distribution and autocorrelation of the arrival process. Strong positive autocorrelations is the major case for burstiness. There is not one exclusive de nition of burstiness� di erent factors and de nitions try to capture di erent properties. Some of these de nitions are given below. Simple de nitions of burstiness are functions depending only on the marginal distribution of the interarrival times ( rst-order properties). The simplest variant of this type is the peak rate divided by the mean rate (R=m). This parameter is known to be rather poor in capturing the impact of burstiness. A more elaborated de nition is the coe cient of variation, which is de ned as the standard deviation divided by the mean value of the interarrival times �(tn)=E �tn]. Better de nitions also take temporal dependencies (second-order properties) into account. The Index of Dispersion for Counts (IDC) is de ned as the following function I (� ) = var(N (� ))=E �N (� )]. This is the variance of the arrivals, divided by the mean of the arrivals in the interval 0 to � . The numerator of the de nition contains the autocorrelation function, thus capturing correlations. Another possibility is a de nition based on the self-similar nature of fractals. This parameter is called the Hurst parameter H (named after its inventor). Self-similarity can be expressed by means of a power law that the autocorrelation function follows by averaging the original samples over nonoverlapping blocks. A complete de nition of self-similarity will be given in section 4.4.1.
1.1.4 Tra�c Parameter Measurement and Enforcement The methods to measure and enforce certain parameters, such as the maximum burst size or the cell loss rate, are not simple. Parameters often have to be measured indirectly or with the help of interpolations. The reason for this di culty are manifold. For the enforcement of the parameters a tradeo very often has to be made between network performance and grade of service provided to a user. The peak rate R can theoretically be measured easily by taking the reciprocal of the interarrival time between two cells. But because ATM is a slotted networking architecture, not every value from 0 to the link speed can be expressed properly. The only values that can be speci ed are of the form 1=n of the link capacity, n being an integer. This yields only a few possible values, especially for relatively high cell rates. To cope with this, the GCRA algorithm uses the notion of a Theoretical Arrival Time (TAT) plus a certain o set to check whether a cell conforms to the tra c contract. This performs a kind of averaging function with a small window. The mean cell rate m is somewhat more di cult to measure because one never knows how long the connection is going to last. With the help of tokens that allow the source to send a certain number of cells the problem can be solved. An absolute enforcement can be achieved when the tokens are generated exactly at the mean rate. This has the drawback that a connection cannot start with a burst and that sources can accumulate huge numbers of tokens. The reference model for the GCRA uses a leaky bucket with a token increment parameter plus a limit. To cope with large numbers of accumulated token pools, the algorithm generates tokens after each departure of a conforming cell. Maximum burst size b is critical to measure because it is often di cult to determine the borders between bursts. In addition, bursts can be split or merged during their transmission. In the GCRA algorithm it is measured and enforced through the maximum capacity (size) of the leaky bucket.
1.2 Resource Allocation The management of transmission resources in a network can be done in several di erent ways. In the following four subsections a brief overview of di erent approaches is presented. Afterwards, selected methods from the literature are described in more depth. Each proposal is presented and evaluated separately. At the end of the literature overview a classi cation of all the described methods is given.
1.2.1 Peak Rate Allocation For this method the user speci es at connection setup only its peak rate. The network then reserves the requested peak rate along the path on each link. The call is rejected if the sum of allocated transmission rates on one involved link exceeds the maximum capacity. The network reserves this peak rate independent of the actual behavior of the source. In this approach the network monitors the peak rate of the user and polices its behavior. If the user exceeds its negotiated peak rate the network can take one of
the following actions: Discard o ending cells right at the access. Mark the excessive cells with a high cell loss priority, so that the switches along the way can discard the cells in case of congestion. Flow control the user by not accepting more than the peak rate. The peak rate is simple to monitor by measuring the interarrival period of two cells and taking the reciprocal value of it, as mentioned above� this has to be done over a small interval. Peak rate allocation is straightforward and easy to understand but it leads to poor utilization of network resources. For most sources the tra c behavior is not constant and often varies signi cantly. The disadvantage is especially great for long-lasting connections. On the other hand, peak rate allocation o ers a very strong performance guarantee to the user.
1.2.2 Minimum Capacity Allocation In this approach a network user speci es the minimum required transmission rate needed for operation. The network then reserves this amount of capacity on each link. A new connection is rejected if the total amount of allocated minimal capacity on a link would exceed the total link capacity. The network guarantees only this minimal amount of transmission capacity. A user can inject more than the minimum capacity� the network simply does not guarantee the delivery of the excess data. A possible implementation of this method is that the network assigns link bu ers in direct proportion to the minimum capacity of a connection. Resource allocation inside the network is therefore extremely simple. This method can lead to very high utilization of the network as long as users specify the true minimum of their required capacity. The great disadvantage is that the performance guarantee is rather weak, especially for connections with a great variance in their behavior. If users start to request more than their minimum capacity the approach converges to peak rate allocation and therefore introduces poor network utilization.
1.2.3 Tra�c Behavior Speci�cation and Allocation With this method the user supplies an entire vector of tra c parameters describing its behavior. In ATM technology the vector consists of R, m, and b. The network then tries to calculate the network resources needed for the given parameter vector. The decision to accept or refuse a new connection is di cult to make in order to achieve high network utilization. There is a tradeo between performance guarantees to the user and network utilization. The statistical multiplexing of several virtual channel connections onto the same link by reserving a transmission capacity below the speci ed peak rate can lead to an overbooking of links and therefore to congestion and cell losses. The transformation of the tra c descriptor vector into an amount of resources is a key point to achieve high network utilization. To compute the needed
capacity some assumptions about tra c behavior have to be made. In addition, the computation should be as simple as possible to o er fast connection setup times. The network can police the peak cell rate with the same means that were given in the section 1.2.1 about peak rate allocation. In addition, the average cell rate has to be enforced as well. This can be done with the help of a token pool where tokens are produced at the average rate. Whenever the user sends data the tokens are consumed according to the transmission speed of the user. When the token pool becomes empty, the network can take various actions. It can discard the cells immediately or simply mark them (set the CLP bit in the header) to be discarded in case of congestion. The network can also throttle the user by means of �ow control methods such as backpressure �Che92, Che93] or token-based approaches �Tur91, Gue91].
1.2.4 Dynamic Adaptation to Tra�c Behavior With this approach the user can alter the tra c contract dynamically or the network can propose a change to the user. It is also possible that the network itself changes the contract transparently for certain tra c classes. This method must be combined with one approach described above. The user can for instance change the peak rate or the minimum transmission capacity dynamically. The method requires a renegotiation protocol, which should be a fast, lightweight protocol and a monitoring module to measure the parameters. The measurement process can either try to obtain individual tra c descriptor vectors or an e ective capacity needed to support a single connection or a group of connections. This will be the type of method proposed in this thesis.
1.2.5 From STM to ATM With the introduction of the QoS and tra c parameter concepts, the task of resource allocation has attracted enormous attention. Unlike in traditional circuit switching �Pry95] used for Narrowband Integrated Services Digital Network (NISDN), for which peak rate allocation is performed by means of STM, ATM does not assign xed time slots to individual connections. Networking architectures based on STM often su er from poor utilization because unused transmission slots cannot be used by other connections. The problem can be alleviated with a multirate circuit switching architecture, which allows a multiple of a certain minimum transmission rate to be reserved. Compared to pure circuit switching, the multirate concept introduces additional overhead to cope with the concatenation of several channels to form a transmission circuit of a higher rate. On the other hand it allows better utilization of the network. The di culty with multirate circuit switching is to nd a good minimum unit that does not cause high overhead for low- and high-speed connections. ATM tries to overcome this problem by introducing an asynchronous assignment of transmission slots. The available transmission slots are o ered to all connections concurrently present on a link. In this way empty slots can be used by connections that have data to send.
Compared to multirate circuit switching ATM, introduces even more overhead. Because the slots are no longer reserved for individual connections, the network must guarantee that the resources are shared by the di erent connections according to their tra c contracts. Fairness leads to the concept of usage parameter control which is often called policing. The function enforces the tra c contract, e.g. the requested peak cell rate. Policing is not only necessary to detect users that deliberately try to inject more data than speci ed but also to detect possible failures. The enforcement of tra c parameters is also required by the CAC and resource management functions because only in this way can the bounds within the tra c may vary be determined, e.g. the aggregated peak cell rate represents the worst case in which all connections are active simultaneously. Without policing, no bounds would be known and resource allocation would be impossible especially if QoS constraints are present. Usage parameter control is left to the networking manufacturer's discretion and will therefore not be standardized. ATM is supposed to provide a statistical gain by multiplexing many connections onto the same link. Because it is assumed that not all connections are active at the same time, it is expected that a certain smoothing occurs, i.e. the active periods of some sources are compensated by idle periods of other sources. The smoothing e ect is strongly dependent on the tra c pattern of the individual sources. If very rough tra c streams are multiplexed together, one can expect the aggregated tra c pattern to be quite rough. On the other hand if several smooth tra c sources are multiplexed together, the resulting tra c stream becomes even smoother. An arti cially generated smoothing in the context of ATM is called shaping. A very common practice is to shape a tra c stream according to its peak rate. A tra c source usually operates on larger junks of data than just one cell. During the packetization of the data, cells often become faster available than the contracted peak rate. The network can either send the cells according to the peak rate by rst bu ering the cells or it can transmit the cells at a higher speed. If shaping is done according to the peak cell rate, it has no in�uence on the QoS constraints because the contract is still ful lled. On the other hand, global shaping for a tra c class or per link can lengthen queuing delays. But in ATM only small bu ers are used and, in order to achieve very small cell loss rates, the bu ers must be almost empty most of the time. The load of a network has the most critical in�uence on delays. Above a certain load in the network, the delay starts to increase exponentially. A very frequently quoted gure for this threshold of network utilization is 80%. Since the bu ers are relatively small, such an overloaded situation leads very quickly to unacceptable cell loss rates. Moreover, delays depend also on the queuing discipline employed, especially if there are tra c classes present that have higher priorities than others. Of the QoS parameters, the resource allocation method has the highest impact on the cell loss rate. If the algorithm is too optimistic and does not reserve enough transmission capacity, cell losses can occur quite readily. Therefore, the allocation process is a tradeo mainly between network utilization and cell loss rate. In view of all these additional management functions, one can ask the question whether they are worthwhile. Today, the cost of an OC-3 (155 Mbit) port is about $2500. Generally the additional costs for sophisticated resource management func-
tions must be lower than the achieved gain. A statistical gain of 10% saves about $250 per year. At the moment it is still unknown how high the statistical gain will be, but one might expect a range of between 0 and 30%. Nevertheless one should not only consider equipment costs. Sophisticated resource allocation methods can also alleviate the problem of transient overload situations, which are quite common in the LAN environment as well. Furthermore, the installed cabling very often survives more than one networking architecture and it can become important for the network to try to get the last bit out of the network. In any case, peak rate allocation will certainly often be done in the LAN environment at least as long as there is enough capacity available. A very clear statement can be made whenever expensive leased lines are involved! An E3 (34 Mbit/s) leased line of a few kilometers from the Swiss PTT currently costs about $75000 per year. Hence a statistical gain of only 1% is worth $750 per year. As a general guideline it can be said that sophisticated resource allocation methods are worthwhile when link costs are high. Despite the global trend towards liberalization of the public carrier market, it cannot be expected that leased line costs will drop sharply in the near future because the technology and capacity are not yet available on a large scale. Nevertheless the trend is clear that costs are dropping, the amount of tra c is drastically increasing, too. In conclusion, I am convinced that more elaborate resource allocation methods deserve implementation, but they have to be as simple as possible to be feasible and implementable solutions.
1.3 The Research Agenda The main research objective of this thesis is to develop a new call admission controller that can cope with today's and future demands. A subcomponent of the CAC must be the resource allocation function. The new CAC should not assume a speci c statistical source behavior. In general, as few assumptions as possible should be made to obtain an algorithm that can cope with unknown future demands. In addition, the method must be economically implementable, either with the help of low-cost special-purpose hardware that can cope with the complexity or by means of low numerical complexity. Furthermore, the CAC must be scalable to very high-speed links and extremely high connection set-up and tear-down rates. In addition it must be applicable to all sorts of connection types, e.g. point-to-point and point-to-multipoint. An extensive list of requirements for the CAC will be given in Section 5.1. Because real-world ATM tra c measurements including the call arrival and departure process are still not available, the rst milestone is to design and implement a new tra c generator that produces tra c as well as the call arrival/departure process including tra c parameters for variable bit-rate connections. The tra c generator must incorporate recent research observations that reveal the presence of correlation structures in networking tra c. Furthermore, it must be capable of producing very long tra c logs in a relatively short period of time. This is necessary in order for it to assess the performance of the new CAC algorithm. Because of the extremely small cell loss rates, very long periods have to be simulated to obtain good simulation results. Owing to the unknown exact tra c pattern the model must have
parameters with which di erent tra c situations, e.g. high versus low load, can be simulated. By varying the parameters the entire possible spectrum can be covered. Therefore, it is not necessary to know a priori in which region the real-world tra c will be. More elaborate design goals of the tra c generator will be discussed in Section 4.4. The algorithm, must be assessed either theoretically or by means of extensive simulations. The evaluations must reveal the performance of the algorithm under various conditions. In addition, the possible spectrum for the statistical gain has to be shown.
2 Literature Overview In the following sections a detailed literature overview of the subject call admission control and resource allocation for ATM networks will be given. Some of the publications presented contain only part of the subject, whereas others cover additional aspects as well. Because they are based on di erent assumptions and framework requirements, a direct comparison of the individual methods is often not possible. Owing to the standardization process of ATM some of the methods have become obsolete or even unusable in the context of ATM. The reason for this is that some of the methods rely on additional parameters and others would even require additional bits in the cell structure. Nevertheless the methods will be presented because they contain di erent approaches and ideas about resource allocation and call admission control for high-speed networks. For each paper there are two subsections. The rst one gives a description of the method and the second presents an evaluation. Because of the incompatibility of the di erent methods and very often the lack of an exact speci cation and dimensioning of the parameters, the evaluations are of a qualitative nature and done individually for each method. A classi cation and critique of the methods will be given afterwards.
2.1 Method A: by Turner 2.1.1 Description of the Method The papers �Tur91, Tur92] by Turner present a complete transmission rate allocation architecture for ATM networks with bursty sources. This method aims to ful ll the ve design objectives stated below: It should provide consistent performance to those applications that require it, regardless of the other virtual circuits with which a given virtual circuit may be multiplexed. It should allow high network throughput even in the presence of bursty tra c streams. The speci cation of tra c characteristics should be simple enough that users can develop an intuitive understanding of the speci cation and �exible enough that an inaccurate speci cation does not have seriously negative consequences for the user. It should not arti cially constrain the characteristics of user tra c streams� the need for �exibility in ATM networks makes it highly desirable that tra c streams be characterized parametrically, rather than by attempting to t them into a prede ned set of tra c classes. It must be simple to accomplish for reasons of economy and reliability.
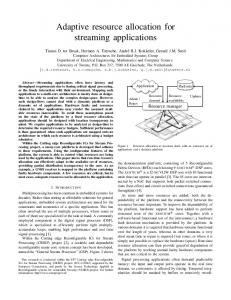
These ve goals are striven for by means of a Fast Bu�er Reservation (FBR) mechanism. The main idea of the method is to allocate network resources on the burst level in order to preserve the integrity of the bursts as a whole. In this way it is also possible to discard cells of only one or just a few connections in case of congestion. Bu ers are reserved when the data are sent, thus eliminating the need for special signaling messages. For this purpose four di erent types of cells are used, start, middle, end, and loner cells. The loner cells are used for low-priority tra c that can be discarded in case of congestion. In the Fig. 3 a link is depicted with its corresponding link bu er. All connections
Figure 3: Link bu er on the link share one common link bu er pool. By means of the reservation method bu ers are allocated to the individual connections. A virtual connection i is characterized by the following three parameters:
Bi the number of bu er slots when the connection is active, bi the number of bu er slots currently used by unmarked cells, si the state of the connection (idle or active). In addition, the following parameter is needed:
B the total number of unallocated bu er slots for that link. The value of Bi is calculated at connection setup according to the desired peak cell rate as follows: & ' � i �L Bi = R � with �i : �i: L: R:
peak cell rate, mean cell rate, number of bu ers slots for the link, link speed.
With this formula the same percentage of bu ers is reserved as the percentage of the peak rate compared to the link capacity. The state of a connection is either idle or active. In the active state the connection gets access to Bi bu ers and can therefore transmit at its peak rate. Transmission between the idle and active states is triggered by start and end cells. A reasonable size for the link bu er is of the order of several hundred cells, i.e. 1000 cells. The complete algorithm works as follows: When a start cell is received: the cell is discarded if the virtual circuit is in the idle state and B ; Bi < 0,
si is changed to active if the virtual circuit is in the idle state and B ; Bi � 0. In addition, a timer for that virtual circuit is started, and Bi is subtracted from B . If bi < Bi, bi is incremented and the cell is placed (unmarked) in the bu er. If bi = Bi, the cell is marked and placed in the bu er. In case of congestion, marked cells can be discarded. If a start or end cell is received while the virtual circuit is in the active state, it is put in the bu er and the timer is reset. The cell is marked if bi = Bi, otherwise it is left unmarked and bi is incremented. If a middle or end cell is received while the virtual circuit is in the idle state, it is discarded. If an end cell is received while the virtual circuit is active or if the timer expires, si is changed from active to idle and Bi is added to B . If a loner is received, it is marked and placed in the bu er. Whenever a cell is sent from the bu er, the appropriate bi is decremented. The time-out value is set such that a few hundred cells can be transmitted in each burst. Owing to the time-out, a lower bound of the peak rate is enforced. Therefore, it is proposed that the method be used only for connections that need more than 1 to 2 percent of the link`s capacity. In case of normal transmission, the cell sequence is like smmm...me (a start cell followed by several middle cells and a terminating end cell). Another possible sequence could be ssss...se. In this case the reservation method would try to allocate the bu ers for every start cell. This could be done for voice transmission. Even if the rst few cells get lost the tail of the sequence is more likely to get through. The author presents further combinations. The reservation mechanism can also be applied for constant bit rate connections and bursty connections that use less than 2 percent of the link`s capacity. The only thing that needs to be done is to subtract the amount of bu ers from B and put them into the active state, where they remain for the entire duration of the connection. As there is only one bit in the ATM header that can be used for �ow control the author describes a way of encoding the cell types into this one bit and combining it with the state of the connection captured by a state machine per connection. In order to decide whether a new connection can be accepted, a virtual connection acceptance algorithm is used. Two methods are presented. The rst is based on the
excess bu�er demand probability (the probability that at a random point in time a set of virtual connections demands more bu ers than are available). Let xi be a random variable representing the number of bu er slots needed by virtual connection i. This leads to the following probabilities:
P (xi = Bi) = ��i = pi� i P (xi = 0) = 1 ; pi = pi: The total bu er demand of a link carrying n virtual connections can then be expressed as n X X = xi: i=1
The probability distribution can be expressed by a generating function n Y fX (z) = (pi + pizBi ) = C0 + C1z + C2z2 + � � � : i=1
Hence P (X = j ) = Cj (assuming the xi are mutually independent). The excess demand probability is then the sum of all Ck with k > L. A new virtual connection can be accepted if C0 + � � � + CL � 1 ; ". These coe cients can be calculated in an iterative way and without much overhead. But the excess demand probability has anomalies in that it is unfair to virtual connections that have a small probability of having a burst. Thus a second approach based on the burst loss probability of connection i (probability that virtual connection i tries to send a burst when the bu ers are not available) is introduced. This is an extension of the rst approach and requires further calculations as well as the coe cients Cj , but it is based on the partial sums. Its mathematical complexity however is still small. It is also proposed only to be applied to connections that need more than about 2 percent of the maximum link capacity. Some simple examples (assumption: all virtual connections require the same peak rate) are evaluated to show the statistical gain of the multiplexing method. In order to ensure that a user does not exceed its negotiated tra c behavior the network has to monitor each virtual connection. Through the reservation mechanism the peak rate is already enforced. To control the mean bit rate an additional mechanism is needed. At the network access point (between the network and host or terminal) a token pool combined with a state machine is used to monitor the average bit rate. The state machine mimics the state machine assigned to the virtual connection inside the network. This is necessary because in the active state, Bi bu ers are assigned to the connection and therefore the tokens have to be consumed at peak rate no matter whether the connection really transmits at its peak rate or not. The token counter is incremented according to the speci ed average rate. If the token pool reaches 0 the cell is converted into an end cell, thus releasing the bu ers and forcing the state to idle. A connection then has to wait until the token pool becomes full again before it can transmit the next burst.
2.1.2 Evaluation of the Method The proposed method for the call acceptance criterion looks quite promising in terms of simplicity and calculation overhead. In addition, the method covers the entire range of topics needed for call admission control. On the other hand There are several points to be observed that make part of the method questionable. If a virtual connection tries to send a burst and is blocked, the bu ers along the way are partially allocated and are only freed after the time-out period which forces a transition into the idle state. As mentioned above, all the sources are modeled as on/o sources that, when active, send at their peak rate. For many tra c sources this behavior is not an appropriate model and can thus lead to poor resource utilization when sources do not transmit at their peak rate. The estimation of the average transmission rate has the same weakness because the tokens are always absorbed at peak rate. The way of encoding the di erent cell types became questionable when the ATM cell became standardized. With the combination of the state and the CLP (Cell Loss Priority) bit in the header the complete mechanism cannot be realized because the space to encode all di erent combinations is too small. In order to obtain good performance the method needs to be applied end-to-end. At the current stage however, it is very unlikely that there will be a standard that guarantees an end-to-end scheme across hubs from di erent vendors. The end-toend requirement stems from the fact that bursts need to be blocked at the access to avoid the need for huge bu ers in the hubs. There is no proposal made by Turner concerning how the bits of the cells are set to identify the cell types. He merely states that the user marks the cells, which is inappropriate because a user does not usually operate on the cell level but works instead with larger junks of data. Hence, it is not straightforward to characterize middle or end cells.
2.2 Method B: by Boyer and Tranchier 2.2.1 Description of the Method
Boyer and Tranchier �Boy92] introduce a Fast Reservation Protocol (FRP) in two di erent �avors. The rst method is called Fast Reservation Protocol / Delayed Transmission (FRP/DT) and the second Fast Reservation Protocol / Immediate Transmission (FRP/IT). As FRP/IT is very similar to the method by Turner, the main focus here is on FRP/DT. The key idea is to pay special attention to connections that demand a Stepwise Variable Bit Rate (SVBR) compared to VBR and CBR already familiar in the ATM world. SVBR sources are characterized by the following criterion: Their behavior cannot easily be speci ed in advance. They can alter their behavior signi cantly. They can a ord to wait for a renegotiation of the tra c contract.
Examples of this kind of sources are le or image servers. These sources often switch between idle and active periods but the idle or burst time cannot be speci ed beforehand. The FRP/DT method is divided into two parts, a user network procedure and a network internal procedure. The user network procedure operates at the TB interface, whereas the internal procedure works only inside the network. In the Fig. 4 two possible con gurations are depicted.
Figure 4: FRP/DT reference con guration In the rst case the FRP runs end-to-end, whereas in the second con guration it runs only between the two gateways. In the second case it is assumed that the protocol is applied to a virtual path connection, which carries the entire tra c from LAN 1 to LAN 2. FRP users exchange mono-cell messages with the FRP unit. Signaling is in-band (the signaling messages �ow across the same VCC or VPC as the data). The user network protocol employs the following cell types: Reservation Request Cell, Reservation Received Cell, Reservation Accepted Cell,
Reservation Denied Cell, Release Request Cell, Release Received Cell. In order to avoid a divergence of the transmission rate, only absolute values are exchanged. When a user wants to increase its cell rate it sends a reservation request cell containing the new absolute transmission rate. The control unit con rms the receipt of the request with an reservation received cell. When the network internal protocol has successfully allocated the new capacity it sends a reservation accepted cell back. From this point in time the user is allowed to send at the new rate. During the negotiation the user is still allowed to transmit at the currently assigned bit rate. In case of failure the control unit replies with a reservation denied cell. This means that the new value could not be granted but the user can still transmit at the current speed. The release of the allocated capacity works in basically the same way except that the user must switch to the lower transmission rate upon receipt of the release receive cell. The protocol is equipped with timers and retries to cope with cell losses or transient congestion. Because of this dynamically assigned peak rate the user can be policed easily according to the currently negotiated peak rate. Inside the network basically the same protocol runs hop-by-hop. Each Switching Element (SE) tries to reserve the new transmission rate. If a SE successfully reserves the new rate it starts a timer and forwards the reservation request cell to the next hop. If all the SEs managed to reserve the new rate, a con rmation cell is sent back hop-by-hop. If this con rmation does not arrive within the time-out value, the SEs release the reserved capacity to the old value. The separation between the internal and external protocols serves to achieve higher �exibility. For public carriers it would be possible to use a central FRP control unit in the rst phase. The FRP provides only the renegotiation of the peak rate along an established connection. For the initial connection setup another protocol is used. At this connection setup a SVBR user must specify its maximum peak rate. With the FRP the user is only allowed to change the transmission rate inside the initial speci ed bound. Owing to the roundtrip delay there is a transmission ine ciency that can be described as follows: � ERT � � = �s 1 + EA � with �s : �: ERT: EA:
o ered load, load reserved by the network, max. roundtrip delay, mean source active period.
The factor ERT=EA represents the transmission ine ciency. This factor grows with long roundtrip delays and/or small burst sizes. The factor shows the limit of the
method. Small bursts cannot be accommodated with FRP/DT. For small bursts the FRP/IT protocol can be used, in which case however the delivery of the burst is not guaranteed. Boyer and Tranchier then evaluate the statistical gain of the method. They nd that in order to achieve good statistical gains the number of simultaneously accepted connections should be greater than 100. Hence it is proposed that the peak bit rate of a FRP connection be limited to about 1/100th of the multiplex capacity. The connection admission control algorithm used is based on the Burst Blocking Probability (BBP). New virtual channel connections are only accepted when the BBP for the already established connections is below a certain probability. The FRP/IT method is for sources that cannot wait for a roundtrip delay until the new tra c contract is con rmed. To each burst there is a starting cell added to the head which reserves the needed transmission capacity. Upon successful reservation, the burst is sent hop-by-hop along the path. If one SE cannot make the reservation the entire burst is immediately discarded. With this method the delivery of the burst is not guaranteed but the source can start transmission without delay. To the end of the burst there is another cell appended that releases the reserved resources again. Boyer and Tranchier state that their concept for FRP/IT is basically the same as that of Hui, which is presented in the next section.
2.2.2 Evaluation of the Method Boyer and Tranchier present a complete architecture for fast resource reservation. The protocol is very robust against errors of any kind. FRP/DT combined with FRP/IT can be a possible approach to resource allocation for certain tra c classes. One criticism is that the protocol cannot be considered lightweight. The protocol itself could be simpli ed to react faster and to take more care not to waste resources during the reservation process. In addition, the same remarks as with Turner can be made here about the necessity of having the protocol run end-to-end to achieve good performance in terms of resource utilization. Another aspect is that the burst-blocking probability needs to be engineered by extended simulations. Hence the question of the amount of statistical gain obtained, is still open. The strict separation of the network-internal and the user-network protocol introduces additional overhead that could be avoided by a more streamlined architecture.
2.3 Method C: by Hui 2.3.1 Description of the Method Hui �Hui88, Hui91, Hui92] was the rst to introduce the concept of reservation at the burst level by sending a pilot cell ahead of the burst. The main proposal of Hui is to perform resource management in a layered fashion. The various levels are depicted in Fig. 5.
Figure 5: Time-scaled tra c entities The allocation of transmission capacity at a larger time scale should attempt to provide a certain Grade Of Service (GOS) guarantee for layers at a smaller time scale. The GOS is measured by the blocking probability on each individual layer. The principle can be stated as follows: Allocate su cient transport capacity for tra c entities at a layer so as to bound the amount of blocking occurring at the next-lower layer. The tra c entities are quali ed as paths, calls, bursts, and cells. In the remainder of this text the path layer is ignored because it describes routing aspects which are beyond the scope of this work. In addition, the description is given for the case of only one type of service. The objective is now to nd a method to determine the amount of resources required to transport a certain amount of tra c. First, a set of parameters is needed to describe the behavior and requirements of each layer. The following list provides the set of parameters for layer l:
�l 1=�l Nl Nl Bl gl #l #l
arrival rate, holding time, state, critical state, blocking probability, bound for the blocking probability, set of all acceptable states, set of nonacceptable states.
For example, on the burst layer these parameters can be interpreted as: the mean arrival rate of bursts, the mean duration of a burst, the number of active bursts, the number of maximal active bursts, the burst-blocking probability, the probability bound for the blocking of a burst (i.e. g = 0.0001), the number of acceptable bursts 0 up to N burst carried in parallel, and the number of unacceptable bursts N burst up to in nity. For the cell layer the state can be characterized by the number of occupied bu ers. With these parameters the equivalent bandwidth can be calculated for each layer recursively from the lowest layer up to the highest layer. Equivalent bandwidth refers to the capacity needed to support a connection under GOS constraints. The value must be below the peak rate to achieve a statistical gain. On the cell layer, Bcell = P (#cell ) = P (Ncell = N cell) < gcell is required. This is the probability that the bu er space will be full. The necessary equivalent bandwidth C is then
Ccell (Nburst) = ��cell Nburst � where � = 1=� and � is the bu er utilization, which is typically 0:9 to achieve a small gcell . The necessary equivalent bandwidth is thus about ten percent higher than the mean value. The equivalent bandwidth on the burst level can then be computed as � ! � burst ; 1 Cburst(Ncall) = ��cell E gburst � Ncall � : burst
The term E ;1 (a� S ) is the inverse function of the Erlang B formula �All90, Pap91]. In this context, this yields the number of bursts to be transmitted in parallel to guarantee the blocking probability. On the call level the equivalent bandwidth can now be computed as ! ! � � � � burst call ; 1 ; 1 � : Ccall(Npath = �call) = ��cell E gburst � E gcall� � � call
burst
The interpretation of this formula is as follows. If we want to support calls of the speci ed type arriving at a rate of �call by ensuring the blocking probabilities on the burst and cell layer we have to allocate the equivalent bandwidth stated above. The equivalent bandwidth grows from a lower layer to a higher layer.
As mentioned above, Hui`s theory holds for one type of source which was described by a certain set of parameters. In the original paper the theory is extended to support di erent types of sources by having vectors of parameters instead of just scalars. Furthermore, the assumption of having only on/o sources is relieved by introducing other statistical models. Hui presents algorithms to calculate the equivalent bandwidth e ciently. In addition, mathematical properties of the various functions are given.
2.3.2 Evaluation of the Method From a mathematical point of view this theory is interesting. From a practical point of view however, it is di cult to consider it a feasible approach. The complexity of calculating the equivalent bandwidth for a wide variety of sources is - despite the simpli ed algorithms - enormous. A main problem with this approach is that a certain tra c type has to be speci ed extremely well through the set of parameters. This is only possible for some types of sources. How should for instance the mean arrival rate, the mean burst size, and the mean cell rate for a connection to a general-purpose le server be determined? The le sizes can vary over several magnitudes and therefore bursts have completely di erent appearances. In addition, a tra c source would then also have to specify at the connection setup what type it is. The theory may be useful for very special-purpose networks such as a telephony network where good estimates of the source behavior are available. It could then be used for network dimensioning, where the key objective is to determine the link capacity necessary to support a certain amount of connections of a certain type, under given blocking probability constraints.
2.4 Method D: by G�uerin and G�un
2.4.1 Description of the Method
In �Gue92, Gue91, Guea91, Mat93, Der94] the architecture of the plaNET test-bed is described. It is a complete concept for high-speed packed oriented networks such as ATM. This overview covers only the resource allocation and the �ow control method. The method is built on the theory of equivalent capacity. A connection j is speci ed through:
Rj peak bit rate, mj average bit rate, bj average burst size. In case of an on/o source with exponentially distributed and independent idle and active periods, this set of parameters describes the statistical behavior completely.
For a link l there are Xl bu ers available. The idea is now to reserve enough transmission capacity on the link such that the bu er over�ow probability will be bound by "l. This amount of resources is called the equivalent capacity cj l for connection j on link l. q yj l ; Xl + (yj l ; Xl)2 + 4Xl �j yj l cj l = Rj � � 2y jl
with
�1� yj l = ln " bj (1 ; �j )Rj� l j �j = m R� j
where �j is the probability that connection j is active. The parameter cj l is the capacity needed for connection j on link l in isolation (not considering the other connections on link l). The value cj l is always between mj and Rj . The di erence cj l ; mj can be viewed as the price of having the bu er over�ow probability bound to the value "l. The next step is now to take into account that several di erent connections are carried in parallel on a link. The idea is to exploit the gain from the statistical multiplexing. The equivalent capacity Cl of link l carrying N connections is de ned as: 8 9 N < = X Cl = min :m + �� cj l j =1 with
s � � = 2 ln "1 ; ln (2 )� l
m=
N X j =1
mj �
�j2 = mj (Rj ; mj )� N X � = �j � j =1
where m is the total mean bit rate and � is the total standard deviation of the bit rate. The rst term in the minimum functions is a Gaussian approximation of the aggregate transmission rate on the link. According to G�uerin and G�un it provides a good estimate when many connections with long burst periods and relatively low utilization are multiplexed. After a new connection is set up and data starts to �ow, the network must make sure that the injected amount of data conforms to the speci ed tra c contract. The method used is a bu�ered leaky bucket together with a spacer. The spacing function
bounds the peak rate that a connection can have, whereas the leaky bucket takes care of the mean bit rate as well as the maximum burst size. The leaky bucket is described by two parameters, � , the speed at which tokens are generated and M the size of the token pool. For each token the user is allowed to send a minimum unit of data e.g. one cell. Therefore a packet can only be sent if there are sizeof(packet) tokens available. The parameter M has to be chosen such that the source can send its bursts without running out of tokens. In the case of a network with xed-size packets such as ATM, the tokens are set equal to one packet. The user is allowed to send one cell per token. First the parameter � has to be speci ed. A straightforward solution would be to choose � such that the equivalent capacity of the connection can be met. This is not possible because it can then happen that the sum of all � on a link exceeds the total link capacity. This stems from the fact that the equivalent capacity allocated on a link also depends on the other connections. This would cause � to change when new connections are accepted or dropped. In addition, the amount of equivalent capacity on a link can vary from link to link along the path because of the di erent aggregated capacities of the links. Therefore � has to be speci ed in a way that it is independent of the other connections. The formulas are rather complex and will not be discussed here. For the sake of completeness they are ( min (cj l� j l) if Nj l > N �, �j l = min otherwise, l2P cj l where P stands for the selected path for the new connection (set of all the involved links) and j l = NRl � jl where j l is the rate that would be allocated to connection j if it would share the link with Nj l connections of the same type: q 32 2 ; �j + 2 �j2 + 4mj Rl 5� Nj l = 4 2m j
where Nj l must be higher than a certain number N �, otherwise peak rate allocation has to be made. The value N � gives the necessary amount of connections needed to achieve the statistical gain. G�uerin and G�un state that a typical value would be about 10. With �j it is now also possible to calculate Mj � ! b ( � j (1 ; �j )�j (Rj ; �j ) j ; �j Rj ) + �j � (Rj ; �j ) Mj = � ln � � ;� R �� (1 ; � ) j
j j
j
j
where � is the bound for the probability to run out of tokens during the transmission of a burst.
Because not every source ts into the model of on/o source with exponentially distributed and independent on/o periods, a monitoring function is needed. This function measures the equivalent mean burst size based on the number of failed burst transmissions (token pool becomes empty during the burst). If the mean burst size changes signi cantly a new computation is triggered for the equivalent capacity as well as for the leaky bucket parameters. The new metric is then sent along the path to reserve the new capacity and the leaky bucket parameters are adjusted to meet the new tra c contract. This renegotiation is done transparently to the user. Following a summary of the actions to be taken when a new connection j is to be set up: 1. Compute �2j from the connection metric vector. 2. Compute cj l for every link along the path. 3. Construct a request vector with the calculated values and send it along the path for transmission rate reservation. 4. Compute the leaky bucket parameters. 5. Upon receiving a con rmation that the rate was successfully allocated on all links, allow the connection to send data. 6. Monitor the characteristic of the connection and send transmission rate update messages if the characteristic has signi cantly changed.
2.4.2 Evaluation of the Method The method described is a complete architecture for high-speed networks. From a mathematical point of view the theory is very promising and interesting, but its price in terms of complexity is quite high. The necessary computing power to calculate the parameters is substantial. In spite of the adaptation algorithm for sources that do not t into the statistical model it is questionable whether the method is appropriate for any kind of source. Only tests in the real-world can provide quantitative results of the usefulness of such complex methods. An interesting task is for instance to compare the wasted capacity (in case of peak rate allocation) with the computation overhead to calculate the equivalent capacity. In Fig. 6 the performance of the normalized equivalent capacity for a normalized bu er size and di erent � is depicted. For an equivalent capacity substantially below the peak cell rate the mean burst size must t several times into the link bu er (region towards the right margin of the diagram). Unfortunately, the adaptation algorithms are not published nor are the exact monitoring functions. The mean burst size is very tricky to measure because arti cial gaps between cells have to be di erentiated from real idle periods. Because of the assumption that the sources are independent and identically distributed on/o sources the method does not capture correlations.
Single Source with Loss Probability = 1e−09 1 rho= 0.9 0.9
Normalized Equivalent Capacity
rho= 0.8 0.8
rho= 0.7 rho= 0.6
0.7 rho= 0.5 rho= 0.4
0.6
rho= 0.3 0.5
rho= 0.2
0.4
rho= 0.1
0.3
0.2 0
2
4
6
8 10 12 Normalized Buffer Size
14
16
18
20
Figure 6: Equivalent capacity One remark on the term equivalent bandwidth. This term was used by Hui as well but the values are not exactly the same because Hui uses a layered model and a blocking probability on each level. In the method described above, only a blocking probability on the lowest layer was used. The two methods are similar but use di erent statistical models. In order to avoid confusion, the method of Hui is referred to by the term equivalent bandwidth, whereas the other will be called the equivalent capacity method.
2.5 Method E: by Bolla et al. 2.5.1 Description of the Method The architecture presented in �Bol92] is a hierarchical capacity allocation strategy. A link is partitioned into virtual links, each carrying the connections for a certain tra c class. The resource management is done on two levels. The higher layer assigns the necessary amount of resources to the di erent tra c classes. This assignment process is done from time to time and is based on statistical models. The lower layer is responsible for the acceptance of new connections. The acceptance decisions are made per tra c class in real-time. Each tra c class is speci ed by statistical tra�c parameters such as peak cell rate and mean cell rate and two performance parameters, delay and cell loss. These parameters and the number of blocked and accepted connections are used to calculate the virtual capacity for each class. The tra c classes are assumed to be on/o
sources which can be speci ed precisely.
The hierarchical structure of the resource allocation method is depicted in Fig. 7.
Figure 7: Hierarchical control structure The capacity allocation controller calculates the virtual capacities for the various tra c classes and controls the output multiplexor. The output multiplexor assigns to each tra c class the necessary number of time slots to support the virtual capacity. Each access controller is responsible for one tra c class. It decides whether to accept or refuse a new connection. The access controllers periodically send the number of accepted and refused connections to the capacity allocation controller. After a new calculation of the virtual capacities the values are communicated to the access controllers. The new values will then be used up to the next intervention point. To each access controller a queue is assigned to ful ll the requirements (delay and cell loss) for this tra c class. The queue length is precomputed and static. The acceptance decision rule is a simple threshold comparison. The threshold is based on the currently assigned virtual capacity and the number of already accepted calls. For the mathematical model the following parameters are needed:
k CT K m M h Vm(h) Q(h)
discrete time variable, the total link capacity in Mbits/s, length of intervention period, instance of intervention m = 0� K� 2K� : : :, number of classes, tra c class number h 2 �1::M ], virtual capacity of class h in period m, queue length of class h,
N (h) maximum number of accepted connections. The value for K is determined by simulations. The virtual capacity Vm(h) is constant during the period k = m� m + 1� : : : � m + K ; 1. The on/o sources are modeled as a two-state Markov chain �All90], which is depicted in Fig. 8. The parameters (h) and � (h) are the transition probabilities. These
Figure 8: Two state Markov chain values are deduced from the source tra c descriptor (peak cell rate, mean cell rate and mean burst size). In the next step the steady-state probabilities for an active or idle period can be calculated as (h) Wi(h) = (h)�+ � (h) � (h) Wa(h) = (h) + � (h) :
The probability of having n(h) active connections in class h can then be expressed as � (h) ! � �n(h) � �N (h);n(h) vn(h) N (h) = Nn(h) Wa(h) Wi(h) : The threshold decision policy whether to accept or refuse a new connection can further be deduced from the following formula: (h) NX
n=0
(h) Ploss (n)vn(h) N (h) � "(h)�
(h) where Ploss (n) is the cell loss probability as a function of the queue length, the assigned virtual capacity, and the number of active sources. The formula can be found in the original paper �Bol92]. The parameter " is the upper bound for the cell loss rate that can be accepted for this tra c class. From the fromula stated above, the maximum number of acceptable connections Nc(h) can be calculated in order to stay below the cell loss bound given by ". The acceptance rule is a simple comparison with this threshold. The authors then add a second threshold to keep the delay under a certain value. The calculation is based on the assumption that the load is generated with a xed
Gaussian distribution. The acceptance threshold is the minimum of the values for the cell loss bound and the delay bound. In order to determine the virtual capacities for the di erent tra c classes the following cost function is introduced:
J = PMh=1 �(h)
2 (h) c 64NX (h) Ploss (n)vn(h) Nc(h)(m) + n=0 8 (h) 93 (h) > > NX Ploss (n)vn(h) N (h)(n) ; Ploss (n)vn(h) Nc(h)(m)>75 : n=0
n=0
The rst term in the square brackets represents the cell loss of the accepted connections whereas the di erence in the curled brackets represents the additional cell loss if all arrived connections would have been accepted during the most recent period. With the parameter � the importance of call refusal can be weighted. The other parameter � is used to weight the importance of the di erent tra c classes. These two parameters must be determined by extensive simulations. The virtual capacity of the individual tra c classes is determined by minimizing J . Two additional constraints are necessary, rst, the total amount of virtual capacities cannot exceed the total link capacity, and second, the new computed virtual capacity for a tra c class must support the already accepted connections. Bolla et al. present a way to reduce the complexity of the computation by partial derivation. Some simple simulations are presented with two di erent types of sources, which show that the algorithm works well for the assumed statistical models of the sources.
2.5.2 Evaluation of the Method This is a network engineering method, where the parameters are adjusted according to statistical knowledge. The acceptance rule is simple as soon as the virtual capacities are computed. The complexity, however, is enormous even under the assumption that virtual capacities are only calculated from time to time. ATM is intended to support a wide variety of tra c classes, which therefore increases the computation overhead drastically. The xed assignment of transmission rates to many tra c classes can cause transmission rate fragmentation. Especially if there are connections that use a substantial amount of the total link capacity, the assignment process becomes crucial. In addition, the determination of the di erent parameters is not simple but very important in order that the cost function is fair (i.e. high versus low transmission rate classes). The method also assumes that each source can be speci ed very precisely with tra c parameters, and that only on/o sources which generate loads with a Gaussian distribution are considered. This contradicts the goal of ATM to support any kind of tra c class. The static assignment of the bu ers to the di erent tra c classes can also lead to a waste of resources.
The method can be useful for special purpose-networks in which part or all of the assumptions are true. Especially the number of tra c classes must be small and the sources have an on/o behavior which can be described with high accuracy.
2.6 Method F: by Knobling and Renger 2.6.1 Description of the Method
Knobling and Renger present an adaptive call admission control method that expects only the peak rate to be speci ed by each individual connection �Kno93b, Kno93a]. The admission decision is based on a threshold comparison. The threshold is dynamically adapted to the tra c load of a link. The adaptation is based on the cell losses within a certain period of time. The following set of parameters is used for the CAC strategy:
LL OR Ralloc Rm Rmax i RL RLinit RLloss TA TAO UL �
lower limit of RL, overload reduction value, allocated bit rate, measured mean bit rate, peak bit rate of a new connection of class i, resource utilization limit, initial value of RL, RL value where the last cell loss occurred, time adaptation, time adaptation within the overload period, upper limit of RL, security value.
In Fig. 9 the algorithm of the method is given in Speci�cation and Description Language (SDL) �Bel91, Tel93]. For a connection request the desired peak rate is added to the already allocated bit rate and checked against the resource utilization limit. If it is below RL the new connection is accepted and Ralloc is updated. Otherwise the connection is refused. A release request is handled straightforwardly and without any interaction. Ralloc is not updated because it will be adjusted according to the measured value for the mean bit rate. A measurement data event triggers the adaptation process. First, Ralloc is set to the mean bit rate measured during the most recent period. It is then checked whether cell loss occurred. If so, the value of RL is saved for which the loss happened. RL is then reduced by the overload reduction value (OR). If the new value drops below LL, it is set to LL. This is to bound RL to the lower limit. If there are no cell losses, RL is increased. If RL is close to the last value where cell loss occurred, a smaller increment is used. In addition, the value is kept below the upper limit (UL). As cell loss occurs only after the acceptance of connections, some additional actions are necessary to cope with congestion. The recovery from congestion is done in two
Figure 9: SDL description of the CAC method steps. First, the peak rate of non-real-time connections is reduced to a value with which the connections can still operate. If this action is insu cient, connections will be dropped. The dropping is done in the order of peak rate, from the highest to the lowest value until the congestion situation disappears. The values of the parameters that are not automatically adjusted must be obtained by simulations. For the adaptation process two parameters must be measured, the mean bit rate and cell loss. Measuring the mean bit rate is straightforward by dividing the number of transmitted cells by the period of time since the previous interaction. The cell loss value cannot be measured easily because in order to achieve a high level of con dence, the measurement period would be far too long. Renger and Knobling therefore take the e ective number of lost cells. This value can be obtained easily when a bu er over�ow occurs. Renger and Knobling present analytical analyses as well as extended simulations of the CAC model. It is shown that the method can achieve a good statistical
multiplexing gain. The model works best when the control parameters to adjust RL are made rather small. The larger the parameters, the stronger the oscillation of RL will be.
2.6.2 Evaluation of the Method The presented architecture for the CAC model can be considered as light-weighte. The method is quite simple in terms of computational complexity. The measurement of the two necessary parameters does not need special hardware because the parameters are also needed for network management. An advantage of the method is that it does not assume a special behavior of the sources. In addition, only the peak rate of a new connection is considered. The policing of the peak rate is straightforward. On the other hand, even if a source can describe its behavior precisely, the additional parameters will not be taken into account. One major drawback of the method is its reaction time. As the control parameter has to be made small to achieve good results, the method also adjusts slowly to new tra c conditions. It may also be possible to make the control parameters adaptive in order to improve the reaction time. In the case of congestion it is di cult to reduce the capacity of non-real-time connections, e.g. to determine the minimum rate they need to remain operational. On the whole the presented method appears promising in the sense of practical use and the number of assumptions.
2.7 Method G: by Suzuki and Tobagi
2.7.1 Description of the Method
The method �Suz92] by Suzuki and Tobagi pays special attention to highly bursty sources with high peak cell rates. The connection establishment is done in two steps. At the connection setup, paths between the source and the destination are selected but no transmission rate is reserved. The reservation is then done on the burst level. Before a burst is transmitted the transmission rate is reserved and released after completion. This is basically the same as the methods by Hui and Turner. The new concept is that the reservation is done on a multi-path as well as multi-link level. The gain of such an approach is that the blocking probability for a burst can be reduced drastically. The terms path and link have the following meanings: path: A possible route between a source and a destination, link: A connection between two adjacent hubs.
It is assumed that there are several links between two adjacent hubs. This can for instance be achieved by having a ber between the two hubs on which multiple 155 Mbit/s trunks are multiplexed.
Upon arrival of a connection setup message, possible routes are selected and memorized. The routes must be capable of carrying the peak cell rate that the source speci es. However, no reservation is done at this level. When the source wants to transmit a burst, a reservation broadcast is sent along all paths to reserve the peak cell rate. At each hop of a path all possible links are examined for the desired transmission rate. After a successful reservation on a link the reservation message is sent to the next hop. The rst path on which the reservation process reaches the destination is taken for the burst transmission. The destination sends an acknowledge (ACK) message back to the source on the selected path. On all other paths the reservation is canceled. Through the broadcast approach the reservation can be done in more or less one roundtrip propagation delay time. If the reservation could not be done the source reattempts the reservation process after a while. After the burst is transmitted the transmission resources are released. In order to avoid out-of-sequence bursts a destination sends an ACK for a new burst only after an ongoing burst has been completely received. Suzuki and Tobagi then present some simulations, the outcome of which is as follows. The multi-link concept improves the blocking probability more than the multi-path concept does but the number of links must by quite high. The method is only useful when the burst sizes are large compared to the roundtrip propagation delay time.
2.7.2 Evaluation of the Method The method of Suzuki and Tobagi is an extension to the concept of allocating resources on the burst level by means of fast reservation protocols. The extension is the multi-path and multi-link concept. As the bursts have to be long compared to the roundtrip propagation delay time the method is only applicable for special-purposes such as medical imaging or bulk data transfers. The parallel reservation of transmission capacity reduces on the one hand the time for the reservation process but on the other hand it causes the temporary allocation of resources that are not needed. On the other extreme, by checking the paths in sequence the delay may grow to an unacceptable time until the reservation process is successful.
2.8 Method H: by Mishra and Tripathi 2.8.1 Description of the Method
The allocation mechanism of Mishra and Tripathi �Mis93] is based on two di erent tra c classes. The rst tra c class is sensitive to delay whereas the second tra c class is loss-sensitive. Each tra c class has its own queue. The method is dynamic in the sense that, depending on the queue occupancy of the rst tra c class, transmission slots are assigned to the two classes. The assignment process is done periodically. The rst tra c class consists of real-time connections such as voice or video. This kind of source rquires upper bounds on delay but can tolerate certain cell losses.
The second class consists of data transfers that require loss-free transmission but can tolerate higher delays. In the following description the term frame stands for the time needed to transmit a certain number of cells. It is the intervention period of the dynamic adaptation of the transmission slots. The Dynamic Queue Threshold (DQT) algorithm uses the following parameters:
Nmin minimal number of transmission slots for class 1, Nmax maximal number of transmission slots for class 1, Qt threshold for the queue length of class 1. Nmin is the minimal number of transmission slots needed to meet the acceptable upper bound of delay for class 1. At the beginning of a frame the queue length of class one is compared with Qt. If the queue length is larger, Nmax slots are assigned to class one for the next frame, otherwise Nmin slots will be assigned. By assigning Nmax the queue will be �ushed rapidly. In case there is no tra c for one class the other can use all the slots. During low loads the algorithm gives priority to class 2 tra c. Class 1 tra c experiences the upper bound of delay. In case of higher loads the method switches priority to class 1 tra c by assigning more slots to it. Mishra and Tripathi then present extended simulations to nd the parameters Nmin , Nmax, and Qt. It is also shown that the method performs better than static allocation models with priority queues.
2.8.2 Evaluation of the Method From the practical point of view the presented architecture is based on far too many assumptions to be used as a resource management method in a real-world application. Especially the number of classes is too small and too many assumptions of the source behavior are made. To make the approach of more general validity the minimum and maximum number of slots assigned to class 1 would have to be made adaptive to the network load. In a general-purpose network it is a di cult issue to de ne tra c classes a priory. In the case of numerous tra c classes, and the assignment of a xed minimum and maximum number of slots to the classes, the resource utilization can drop sharply. A more complex scheduling algorithm would be needed to give the unused slots to other classes to achieve a higher network utilization.
2.9 Method I: by Crosby
2.9.1 Description of the Method In �Cro93] Crosby presents a model to compare static rate allocation to dynamic renegotiation during the lifetime of a connection. Two di erent types of renegotiation schemes are used, simple and optimal.
The simple model basis its decision whether to accept a increase only on the requested increase and on the currently allocated capacity. The optimal approach takes further parameters into account in order to improve the overall blocking probability. Instead of simply accepting an increase of size % it also considers m times an increase of %=m. This approach can reduce the overall blocking probability drastically. An optimal renegotiation algorithm is not further elaborated nor is any indication given whether it exists if the decision has to be made in real-time. The outcome of the simulations is as follows. In all cases studied, the optimal renegotiation scheme performed best, followed by the simple renegotiation scheme. The static peak rate allocation performed worst in all cases. It is shown that renegotiation is only worthwhile on relatively low-speed links. On very high-speed links only a small gain compared to static allocation can be achieved.
2.9.2 Evaluation of the Method Crosby presents a rst approach to quantify renegotiation versus static peak rate allocation. It is shown that more complex renegotiation schemes are probably needed to achieve good results. As the simulation was done only for connections that use a fairly low capacity compared to the total link capacity, the interpretation of the results are only valid under this assumption. The statement that renegotiation is only worthwhile on relatively low-speed links is not valid in general. The truly important factor is the ratio between of the peak cell rate of a connection to the total link capacity. A further drawback of the model is that the additional delay for the renegotiation process is completely neglected, which gives the renegotiation schemes an advantage. The so-called optimal scheme introduces unfairness to high peak rate connections. An optimal scheme cannot exist if the decision has to be made in real-time because the future can never be predicted with certainty. The prediction is especially di cult in ATM because of the wide spectrum of tra c types that are needed to cope with the demands placed on broadband communication.
2.10 Method J: by DuBose and Kim 2.10.1 Description of the Method In �Kim92] the authors present a CAC algorithm based on table lookup. It is called the E�ective Bit Rate/Table Lookup (EBR/TL) method. The main goal of this approach is to move most of the complicated network and tra c analyses o -line. The result of these o -line analyses (simulations and gathered statistics) are depicted in the Tables 1 to 3.
Service category POTS 3.1 kHz PCM POTS 3.1 kHz ADPCM POTS 3.1 kHz DSI High quality voice 7/15 kHz Voice mail Audio on demand Video conferencing
R 64 kb/s 32 kb/s 16 kb/s 192 kb/s - 384 kb/s 16 kb/s - 64 kb/s 1.4 Mb/s 64 kb/s - 192 kb/s
Type CBR CBR VBR CBR CBR/VBR CBR CBR
R/m 1 1 5 - 15 1 1-3 1 1
b N/A N/A 2000-3000 bytes n/A N/A N/A N/A
Loss rate 10;4 ; 10;6 10;4 ; 10;6 10;6 ; 10;8 10;5 ; 10;6 10;6 10;6 10;7 ; 10;8
Delay 10 ms - 150 ms 10 ms - 150 ms 10 ms - 150 ms 10 ms - 150 ms 500 ms - 5 s 500 ms - 2 s 10 ms - 50 ms
Table 1: Voice service types The EBR table groups tra c sources into three general service classes: voice, data, and video. For each entry the peak rate R, the type Constant Bit Rate (CBR) or Variable Bit Rate (VBR), the burstiness R=m, the burst length b, the cell loss rate, and the cell delay tolerance are listed. Service category LAN-LAN interconnect (FDDI) LAN-LAN interconnect (SMDS) Host-host �le transfer PC �le transfer Client/server system Remote database access Remote procedure call (RPC) Electronic mail CAD, CAE on workstation CAD, CAE on mainframe Transaction processing Dumb terminal Semi-smart terminal
R 100 Mb/s 1.5 Mb/s - 44 Mb/s 64 kb/s - 1.5 Mb/s 9.6 kb/s - 64 kb/s 10 Mb/s - 100 Mb/s 1 Mb/s - 10 Mb/s 6 Mb/s - 60 Mb/s 9.6 kb/s - 1.5 Mb/s 64 kb/s - 1.5 Mb/s 1.5 Mb/s - 36 Mb/s 64 kb/s - 5 Mb/s 2.4 kb/s - 9.6 kb/s 9.6 kb/s - 64 kb/s
Type VBR VBR VBR VBR VBR VBR VBR CBR VBR VBR VBR VBR VBR
R/m N/A N/A 1 1 1000 1000 15 - 20 1 5 10 - 100 40 100 30
b 100 - 1000 bytes 100 - 1000 bytes 12.5 k - 10 M bytes 1 k - 1 M bytes 1 k - 500 k bytes 100 - 100 k bytes 60 - 1000 bytes 50 - 5000 bytes 40 k - 100 k bytes 100 k - 1 M bytes 100 - 300 bytes 20 - 2000 bytes 50 - 4000 bytes
Loss rate 10;12 10;12 10;12 10;9 10;9 10;9 10;9 10;9 10;9 10;9 10;9 10;9 10;9
Delay 10 ms - 100 ms 10 ms - 100 ms 1 s - 500 s 10 s - 100 s 10 ms - 500 ms 1 s - 10 s 100 s - 100 ms 1 s - 10 s 1 s - 10 s 10 s - 60 s 1s-3s 100 ms - 2 s 1 s - 10 s
Table 2: Data service types Additional entries can be inserted in the table whenever the required parameters are available. Furthermore, the tables can be exchanged according to other parameters such as the day of the week or the hour of the day. Because resource allocation in the network has to be done according to the current load as well as the current tra c mix, a further table Service category Video telephony Video teleconferencing Video mail / image mail Videotex NTSC quality video HDTV quality video Video browsing (newspaper) Video browsing (catalog) Group IV fax Medical imaging Xray Medical imaging MRI Computer graphics
R 64 kb/s - 2 Mb/s 128 kb/s - 14 Mb/s 1 Mb/s - 4 Mb/s 64 kb/s - 10 Mb/s 15 Mb/s - 44 Mb/s 150 Mb/s 2 Mb/s - 40 Mb/s 50 kb/s - 48 Mb/s 64 kb/s 1.5 Mb/s - 10 Mb/s 10 Mb/s - 200 Mb/s 100 Mb/s - 10 Gb/s
Type CBR/VBR CBR/VBR CBR VBR VBR VBR CBR CBR CBR CBR/VBR CBR/VBR VBR
R/m 2-5 2-5 1 10 2-5 2-5 1 1 1 25 25 25
b 2 k - 10 k bytes 1.6 k - 40 k bytes 64 k - 1 M bits 1 M bits 0.5 M - 1.3 M bits 5 M - 14 M bits 15 M - 40 M bits 0.5 M - 24 M bits 256 k - 640 k bits 5 M - 8 M bits 250 k - 3 M bits 1 M - 100 M bits
Loss rate 10;9 10;9 10;10 10;7 ; 10;10 10;10 10;12 10;9 10;9 10;8 10;12 10;12 10;12
Delay 150 ms - 350 ms 150 ms - 350 ms 1s-5s 100 ms - 2 s 40 ms 40 ms 250 ms - 2 s 100 ms - 2 s 4 ms - 10 s 2s 2s 10 ms - 500 ms
Table 3: Video service types is de ned for each entry in the EBR table. These tables are called EBR percentage tables because they contain values that indicate what percentage of a nominal transmission rate is to be allocated. Five parameters are used to determine the percentage tables. They can be summarized as:
Short-term average network link load: measured mean rate with a small averaging window. Di�erence between average link load and the capacity reserved: the percentage di erence between the allocated capacity and the measured short-term average. Percent of tra�c with peak-to-link ratios of > 0:2: (self-explanatory) This parameter captures situations in which many connections with high peak rates are present. In such situations a statistical multiplexing gain is usually very small. Percent of tra�c with burstiness > 100: the parameter captures connections with very high peak-to-mean ratios. Such connections are dangerous because tra c increases drastically when they change from an idle to an active period. Di�erence between long and short-term average rate > 15%: percentage of the di erence between the short-term and long-term measured average rate.
According to the current measurements of the parameters the correct percentage value can be found in the appropriate table. All the values have to be found through external simulation studies or real-tra c measurements. DuBose and Kim state that by considering future demands, the table would take less than one megabyte of memory. Thereafter, some simulation results are presented. The simulations are carried out only for a very limited set of di erent tra c mixes but they are done for a three-hub environment. The summary of the simulations is that the engineered values captured the di erent load situations. DuBose and Kim state that much more research will be necessary to complete the EBR table.
2.10.2 Evaluation of the Method Table lookup can be extremely e cient compared to other methods that perform fancy calculations whenever a new connection setup arrives. On the other hand it is a somewhat static process in the sense that when new tra c types are created one has rst to optain new table entries. A major problem of the approach is that sources have to know all the supported tra c types in order to select the correct one. A simple mapping of the supplied parameters into one service category is not easy. The chosen de nition of burstiness R=m is known to be rather bad because it cannot capture correlation structures. Therefore, connections with exactly the same parameters can have completely different behavior which is not captured by the EBR table lookup algorithm unless the sources are known and are part of an available service category. Another important point is that the values presented are only valid for unlimited resources at the source and destination point of the connection. Only in this way do the parameters become independent of the end-systems. Furthermore, the variety of end systems is huge, consider for example only the spectrum of powerfulness of various PCs with di erent network interfaces. Another problem is that such a method should be used globally
so that it works in the context of heterogeneous networks. In ATM the resource allocation method is not and will not be standardized, which will lead to di erent implementations among di erent vendors. On the other hand DuBose and Kim present the most complete list of tra c parameters to my knowledge. The gathered parameters are of course valuable for simulation studies and special-purpose applications for which the number of classes is rather limited.
2.11 Method K: by Li, Chong and Hwang
2.11.1 Description of the Method
In �San95, San93] the three authors present a resource allocation method based on a ltered input rate. The focus is on multimedia tra c� in particular a sequence from the Star Wars movie (available in the public domain from Bellcore) is used. Video sequences can be extremely bursty due to scene changes. In addition, they dispose of strong frame correlation. These features are captured by higher order statistical properties such as the power spectrum. A large amount of the powerspectra of coded multimedia tra c is expected to be in the low-frequency range. Therefore, bu ering by a nite bu ering system is rather limited and the low-frequency part must travel through the network more or less unchanged. The low frequencies are induced by consecutive scene changes. The basic idea is to divide the signal into a low- and high-frequency part by means of static low-pass ltering. The output of the lter is then used to drive the rate allocation. Fig. 10 is a block diagram of the architecture. The di culty of this
c
Figure 10: Block-diagram of the dynamic algorithm method is to nd the appropriate cuto frequency for the lter. In case of peak rate allocation the cuto frequency is given by !c = 2 =T , where T represents the minimum time delay between two consecutive cells. The authors use a Finite Impulse Response (FIR) lter of order 2000. An example of such a lter is depicted in gure 11. This lter has the property of implementing a very sharp cuto frequency. Two methods, a static and a dynamic resource allocation model, are given. For the static allocation the cuto frequency is set subject to
0.15
0.1
0.05
0
−0.05
−0.1 0
200
400
600
800
1000
1200
1400
1600
1800
2000
Figure 11: FIR lter of order 2000 (generated with Kaiser window) zero cell loss for a bu er of a certain size. The exact frequency can be found by iteratively reducing the cuto frequency and running the coded video sample through the bu er. This process is repeated until losses occur. This process is similar to nding the leak rate of a leaky bucket of a certain size, subject to zero cell loss. This rate is allocated statically for the connection. By running the movie through the bu er it reaches the maximum lling at least once. For the dynamic algorithm two assumptions are made. First, the output from the lter becomes instantly available. Second, the rate can be adjusted immediately to a new value. The output from the lter is used directly to drive the leak rate of the bu er. The cuto frequency of the lter is xed and again engineered subject to zero cell loss for a certain bu er size. The algorithm is similar to measuring a mean value with an appropriate window size. The measured mean rates are dynamically assigned as leak rate for the leaky bucket. The results can be summarized as follows. Both algorithms allocate a transmission rate that is lower than the peak cell rate. The static allocation, however, still wastes resources due to the high tra c dynamics of multimedia tra c. The dynamic allocation increases performance because it allocates more resources where needed. Additional simulations are presented with several video streams on the same link. It is shown that some smoothing takes place, thus allowing a statistical gain. Further stochastic analyses are given to assess the performance of the algorithm.
2.11.2 Evaluation of the Method In general the approach of using signal processing tools for resource management is promising. The presented algorithms are conceptually simple, which makes them understandable and implementable. The complexity of the ltering can be solved by means of Digital Signal Processors (DSP). Using on-line observations the methods
do not rely on speci c statistical models for the source behavior. Therefore, they can be used for many di erent types of sources. The static algorithm can have its use for video servers where the ltered input rate can be precalculated and used at connection setup as a sustainable cell rate. But for real-time connections the algorithms are useless because in most cases the cuto frequency is not available. Also the dynamic algorithm cannot help in such connections because the cuto frequency is also needed right from the beginning. The algorithm is only dynamic in the sense that it adjusts the transmission rate according to the a prior known cuto frequency. Such a method has several drawbacks. First, by assuming that the rate can always be adjusted, a real statistical gain is not possible because in an overbooking state the transmission rate may not be adjustable anymore. In addition, the assumption that the output of the lter is immediately available is a far too optimistic starting point. In high-speed networks a few milliseconds is a long time, reasonable bu ers sizes can only cope with time periods shorter than 10 ms, typically about 3 ms. Furthermore, simple ltering at a certain cuto frequency is not appropriate because there is no notion of intensity of the frequency involved. The output of the lter looks the same for a constant bit rate source and a constant bit rate source with intensive noise of frequencies above the cuto . This is especially dangerous if many of these source types are present. The situation becomes extremely crucial towards the limit of the link speed, especially in an overbooked state. The reported statistical gains are generally too optimistic because a bu er size of 250 cells for a single connection is too high. In addition, it is too dangerous to allow a maximal lling of the bu ers because the tra c stream may di er depending on di erent implementations and di erent load situations.
3 Comparison and Classi�cation of the Methods In this section, a classi cation of the di erent methods will be given. The comparisons are based on a number of individual criterias. Even though the new proposal for a call admission control algorithm given in this thesis (section 5) has not been presented yet, it is included here for completeness. The various proposals will be referred to according to table 4. Author Abbreviation Turner A Boyer and Tranchier B Hui C Gu�erin and G�un D Bolla et al. E Knobling and Renger F Suzuki and Tobagi G Mishra and Tripathi H Crosby I DuBose and Kim J Li et al. K Thesis work L Table 4: Author to method mapping Then a critique will be given and the motivation for a new call admission control algorithm outlined and defended. Some of the arguments are merely of quantitative or speculative nature due to the absence of real-world measurements for ATM tra c including the arrival and holding process of connections. Further research will be needed to reduce the number of assumptions and to substitute them with facts or quantitative measurements.
3.1 Comparison The comparisons will be made in tabular form with additional explanatory text. In each table the rst column refers to the method. A + is used to indicate a positive or a rmative point while ; is used to represent a negative point or the absence of something. An * will be used for multiple-choice-like classi cations.
3.1.1 Source Description Parameters In table 5 the source model description parameters are summarized for the di erent methods. Some of the methods use only a subset of the available parameters standardized in the context of ATM technology. The peak cell rate R is used in all approaches. For all algorithms based on tra c classes, additional parameters that indicate the particular class are mandatory. For the various methods the parameter either refers directly to a particular tra c class or the tra c class is described more
Method A B C D E F G H I J K L
R + + + + + + + + + + + +
m + + + + + +
b additional parameters + + + + + + + + + + -
Table 5: Source description parameters profoundly by means of an entire vector. Because the standardization process has still not been completed, it is possible that further parameters may be added in the future.
3.1.2 Scope of the Method Table 6 depicts the areas covered by the di erent methods. Because this thesis focuses on CAC and Resource Reservation (RR), all the methods presented had at least to contain these two aspects. Method CAC Flow control Resource reservation Adaptation A + + + B + + + + C + + D + + + + E + + + F + + + G + + H + + + I + + J + + K + + + L + + + Table 6: Scope of the method The column Adaptation refers to the automatic adaptation of the transmission rate per connection or group of connections. The allocation on the burst level does
not count as an adaptation. Only changes of the original speci ed parameters are considered adaptations. A change can either be caused be a renegotiation process or by observations where the changes are then implemented transparently. All three methods that include �ow control employed a token-based approach combined with a spacer to enforce the peak cell rate.
3.1.3 Statistical versus Measurement-Based Models The most fundamental di erences between the individual algorithms are depicted in table 7. The two main categories are methods that rely on statistical models imposed on the source behavior, and the second category is based on tra c measurements and their interpretation according to various criterion and algorithms. Statistical model Measurement Correlation Dynamic Method IID on/o
based captured peak rate A + + B + + C + D + +/E + F + G + + H + I + + J K + L + + Table 7: Imposed source model Method D uses a statistical model but by means of a measurement process the parameters that describe the behavior can be adjusted dynamically. In the column Correlation captured it is shown whether the method can capture correlations in the tra c stream. This may become a very important feature because positive correlations have been observed in many areas of high-speed communications. Methods that allocate resources on the burst level are marked in the last column. These methods use the notation of a burst-blocking probability. Because bursts are only accepted if there are enough resources available, they theoretically should not get into an overbooked state. The statistical gain arises from the fact that the arrival process of the bursts smooth each other out to a certain extent. Approaches that use a statistical model precalculate the needed transmission rate according to the parameters supplied. Therefore, they are in an overbooked state if the allocated rate is below the speci ed peak cell rate. The same is valid for the measurementbased approaches but the di erence is that they try to measure the needed capacity without assuming a particular behavior. The capturing of the needed capacity is of
course di erent for all the given measurement-based algorithms. The e ectiveness of the estimated capacity depends very strongly on the speci c algorithm, particularly on the time horizon. Method F for instance uses an averaging function over a small window. It thus can capture only variations on this small time horizon. Method L uses an entire hierarchy of time scales, and can therefore capture and exploit correlations on di erent time scales. A lot of research work has been published that strongly indicates the presence of correlation structures over a wide range of time scales.
3.1.4 Application Granularity Resource allocation can be done on di erent levels. In table 8 the level for the di erent methods is given. The two extremes are individual connections versus an entire link. Basically there are only two possibilities: either one or several connections. As soon as the method is applicable to several connections the grouping can be done according to di erent criterion. Therefore, the main classi cation can be seen in the rst two columns. The other columns merely indicate what kind of grouping could be used. A Logical Link (LL) is a partition of a physical link, it can be viewed as a super VP. Method VCC VPC LL Link Others A + B + + + + + C + + + + + D + E + + + + + F + + + + + G + + + + + H + I + J + K + + + + + L + + + + + Table 8: Granularity The column Others stands for example for tra c classes based on the ratio m=R. All measurement-based algorithms can be applied to groups of connections containing one or more connections. The granularity is a very important aspect because it has a direct impact on the complexity and feasibility of an algorithm. This can be compared to nding the correct hierarchy in a simulation study where a tradeo between simulation time and accuracy has to be made. This will become a very important issue for very highspeed networks where millions of connections will be present in parallel and with a connection arrival and departure process of thousands of connections per second.
In such an environment it becomes extremely crucial to control and maintain each individual connection with high accuracy.
3.1.5 Resource Allocation Level Table 9 lists the resource allocation levels. Most of the methods allocate either on the burst or the connection level. Only method C uses an entire hierarchy from the cell up to the path level in the allocation process. Method Burst Connection Class Path A + B + C + + + + D + + E + + F + + G + H + I + J + K + + L + + Table 9: Reservation allocation level This results in a certain amount of resources being assigned to a path in order to support a number of connections of a speci c tra c class with a known cell and burst arrival process. This approach is very appropriate for an environment such as telephony where a wide knowledge and vast statistics are available and the number of service classes is rather limited, but not for an environment with many di erent tra c classes. Method E dynamically allocates resources to di erent tra c classes. Inside a particular tra c class the resources are then assigned on a per-connection basis. The assignment process is done periodically according to the number of refused connections per class. For the measurement-based approaches the resource allocation is rst done on a per-connection basis and later on a wider granulate, i.e. per tra c class.
3.1.6 Additional Protocol All methods that allocate resources on the burst level use either special cells or an additional protocol to implement the algorithm. The di erent implementations are given in table 10. Method D uses an additional protocol to renegotiate the parameters.
Method Special cells Additional protocol A + B + C + D + E F G + H I + J K L Table 10: Additional requirements Measurement-based approaches do not need an additional way for communication because they operate only locally i.e. on a speci c tra c class present on a link (see below).
3.1.7 Global versus Local Application Some of the methods work on an end-to-end basis whereas others operate only locally per link. Table 11 depicts the classi cation. Method D uses both by allocating resources per link and performing the �ow control and renegotiation per connection. Method link by link end to end A + B + C + D + + E + F + G + H + I + J + K + L + Table 11: Operation level Measurement-based algorithms operate locally either per link or per subset of a link. In general they can react faster because changes have to be made only locally without the need to communicate with adjacent hubs.
3.1.8 Complexity of the Method The complexity of an algorithm is a product of the number of instances and the numerical complexity of the individual instance. Other factors such as implementability (overall complexity, i.e. many special cases) and special hardware play also an important role. A simple but numerically very intensive calculation can often be handled with of shelf special-purpose hardware such as a DSP. For this reason an absolute de nition of the complexity cannot be made. Table 12 is an attempt to indicate the complexity of the di erent methods. In general, measurement-based approaches are less complex than methods based on statistical models. This is emphasized by the fact that the statistical model-based approaches usually operate on a per-connection basis whereas the measurementbased methods use a wider granulate. On the other hand, measurement-based algorithms can have a high complexity if the intervention periods (time between two new estimates) become extremely short. Method low moderate high A * B * C * D * E * F * G * H * I * J * K * L * Table 12: Overall complexity
3.2 Critique and Motivation for a New Proposal All of the methods presented have advantages and disadvantages. As in other complex areas, tradeo s have to be made to arrive at a workable solution that is as optimal as possible. At the current stage of ATM the new technology is still not mature enough to nd the best possible algorithms for resource management and call admission control. There are still too many open parameters that have to be quanti ed by means of real-world measurements. In addition, new service types are still emerging at a high speed, thus making the task of prediction enormously di cult. One has to keep in mind that ATM is targeted to cover not only the requirements of today but also future demands in the area of high-speed networks from the LAN up to the WAN environment. Therefore, a critique of a certain method is often very subjective and dependent on one's own beliefs. This is similar to the many discussions that have been held about
connectionless services versus connection-oriented services. The discussions are still going on and there will probably never be the answer to the problem. Both methods are equally powerful but for di erent applications there are certain pros and cons. To a large extent a choice is based on personal preferences. One very fundamental believe of mine is that imposing a simple on/o source behavior on the sources is not the right way to go. Most statistical models are based on this assumption. Only method D has an additional algorithm built in that can capture a di erent behavior. This extension however renders the entire architecture extremely complex and only workable as a whole. In my eyes ATM is too broad a technology for such a restriction. All statistical models basically assume a more or less static model that can only vary within some rather tight bounds. This may increase the network utilization but it also restricts a potential user. I favor the view that a network providing a service to users should treat the user like a king, which is a very fundamental principle in economics. Therefore, the network should observe its users and try to draw its own conclusions. This can be compared to a railway company that periodically counts the passengers to determine how many cars the train needs in order to o er a seat to most of the passengers. For this reason a highly adpative, measurement-based approach will presented in this thesis. For most of the methods based on statistical models the architecture is rather rigid and they only become implementable as a whole. A step-wise re nement or implementation is often impossible. Every single component is vital to the system, similar to a cogwheel in a mechanical watch. Therefore, the system becomes somewhat sti
and less �exible. The method presented will operate only locally and without tight framework conditions, thus making it possible to replace or extend the algorithm quickly and very easily. In order that the algorithm be even more �exible, it is highly adaptive and dynamic over a very wide parameter spectrum. Most of the parameters are found out by the algorithm� they therefore do not have to be engineered by additional studies. Another important aspect is that a method which demands resource allocation and monitoring per connection on each link along the path will not, I believe, be the appropriate way to accomodate future demands with millions of connections and immense setup and tear-down rates. Algorithms that can operate on di erent granulates dispose of a much greater scalability than methods that work only if every single instance can be monitored and policed on each link along the path. A single connection can be monitored and controlled more easily at the origin or destination because there are more resources available to perform the job. With an increasing number of hops along the path of the connection the monitoring and controlling should become smaller and smaller. In this way the management becomes hierarchical and therefore, better scalable. This is very similar to the management hierarchy of a company. For this reason the proposed new method can be applied to any kind of tra c classes or groups of connections. Some connections can also be completely excluded, i.e. connections with peak-to-link ratios higher than a certain threshold. For such connections, peak rate allocation has to be made in order not to degrade the service quality of other connections. None of the algorithms presented try to exploit the fact that there are correlations in the tra c pattern, as has been observed for numorous tra c sources. The given
algorithm has built-in means to detect and even exploit such phenomena over a wide range of time scales.
4 Tra�c Simulation 4.1 Introduction to Tra�c Simulation In this section an introduction �Fro94] to tra c simulation and source modeling techniques is given. Source modeling is used to mimic the behavior of a source such as the on/o behavior. Tra c modeling on the other hand focuses on aggregated tra c patterns e.g. how it is seen on a whole link. In-depth coverage of the subject can be found in �Arl95b, Gbu95, She93, Jai91]. Tra c simulation and source modeling in high-speed networks such as ATM has become a challenging task for researchers and engineers. The wide spectrum of applications and fast-moving technology makes it very di cult to design appropriate tra c models and simulation tools. For communications networks, developing a simulation program requires: Modeling random user demands for network resources. Characterizing network resources needed for processing those demands. Estimating system performance based on output data generated by the simulation. Several factors contribute to the di culty of successfully applying simulation technology to performance evaluation. First, the nature of user demands for network resources may be incompletely known or poorly understood. Second, networks are in a perpetual state of �ux, because user services and networking technologies constantly alter usage patterns. Thus any model of user tra c would necessarily be approximative or even speculative, especially when new services are under consideration. Because executing a simulation is analogous to carrying out an experiment involving randomness, simulation outputs must be treated as random observations. In a similar way, because a model is viewed as a faithful representation of the target system, instrumentation is required in order to collect statistics and formulate performance predictions. It is also very important to capture correlation structures. In communication systems very often positive correlation structures have been observed, i.e. in a series of packets transferred on the same link, if packet n experiences a high delay it is more likely that packet n + 1 also experiences a high delay. Correlation structures are very often neglected and independence is assumed to get mathematically more tractable models. Another problematic aspect is that, especially in high-speed networks, the entering of a critical region of operation, often has to be a \rare event", e.g. the occurence of cell losses under a cell loss rate of 10;8 . In order to achieve a certain con dence in this parameter one has to simulate at least 1010 cells. On a 155 MBit link under full load this equals to a time period of over 7 hours. To simulate rare events, vast simulations, usually requiring days or weeks of simulation time have to be made. So the correct simulation technique as well as the correct hierarchy have to be chosen. Two techniques have been proposed to deal with rare
events in a telecommunications network context: Importance Sampling (IS) and the Generalized Extreme Value Theory (GEVT). The general idea of these methods is to increase the probability of rare events in order to reduce the simulation time. A very common tool for performing simulations of network tra c is a Discrete Event Simulator (DES) �Sch92, Scha92]. The method encapsulates user demands and their satisfaction into simulation events that are put into chronological order on an event list. The execution sequence is determined by the order of the event list. The event routines can generate and delete events which are then put on the event list or deleted from it. Randomness enters to the system by generating time periods with the help of random numbers, i.e. the on time of an on/o source is generated with the help of an exponentially distributed random number. For communication systems, typical events are the arrivals of demands for networking resources. Numerous tra c models are known to generate tra c. Just to mention some of the better known models: Renewal tra�c models have been widely used because of their mathematical simplicity. In a renewal model the interarrival times are assumed to be independent and identically distributed (IID). Any kind of distribution can be used. But apart from a few exceptions the superposition of independent renewal processes does not turn out to be a renewal process again. The few that have this feature occupy an outstanding role in the simulation world. One potential drawback of renewal processes is that the autocorrelation function of the interarrival times vanishes for all non zero lags. The Poisson process is a renewal process where the interarrival times are exponentially distributed. It has the feature that the superposition yields in turn another Poisson process. The discrete time variant of a Poisson process is the Bernoulli Process. Another type of tra c models is based on Markov and Markov-renewal processes. Compared to renewal models they introduce dependencies among the interarrival times through the use of state-dependent transition probabilities. In this way they can capture correlation structures. Markov-modulated tra�c models introduce an explicit notion of state into the arrival process. With the help of an auxiliary Markov process that evolves in time and state, the probability law of the arrival process is controlled (modulated). This property is often called \doubly stochastic" because of the two Markov processes. The most popular model of this type is the Markov-modulated Poisson Process (MMPP). As the name states, a Poisson process is modulated by a Markov process. A variation of this is the transition-modulated processes where the modulated entities are the state transitions rather than the states themselves. In areas where vast amounts of tra c have to be simulated the �uid tra�c model can be used. Instead of simulating the nest granularity of a tra c unit, i.e. individual cells, it simulates the �ow rate, i.e. bits per second on a higher granularity. This means that tra c counts are replaced by tra c volumes. Especially in ATM where rather small cells are used, one can view an individual cell as a �uid molecule. Fluid-�ow models often yield a speed-up to several orders of magnitudes, because not every individual cell creates an event. The best results are usually achieved in a combination of events and �ows by choosing the granularity at the correct level. Self-similar tra c (fractal) models have also gained great popularity because they
can capture correlation structures observed in networking tra c. On the other hand the mathematical analyses of these models are often extremely di cult. Selfsimilarity manifests itself in the property that bursts appear on a wide spectrum of time scales. By zooming into smaller time scales one observes the same general appearance of the measurements. These models will be described in more deltail in chapter 4.4.1.
4.2 Source Models Numerous publications are available that describe source models for di erent applications. This subsection is intended to summarize related literature. Because an aggregated (�uid-�ow) tra c simulator that generates tra c measures seen on a link will be introduced and used in this work, this subsection is only a brief summary.
4.2.1 File Transfer Protocol FTP The paper �Bal94] presents some measurement results of FTP tra c running over an ATM (TCP/IP over ATM) testbed. A histogramm of cell interarrival times is given. The environment used consisted of one hub with two workstations attached.
4.2.2 Self-similar Ethernet tra�c After the publications by Leland et al. �Lel94, Lel93] on extensive Ethernet tra c measurements, many researchers focused on this type of tra c either by performing further analyses of the logs available from Bellcore or by developing models that produce such kinds of tra c. The publications by Leland et al. revealed the self-similar (see 4.4.1) nature of LAN tra c thus challenging the traditional tra c models because self-similar tra c has a negative impact on nite queuing systems. This is caused by stronger deviations in the arrival process due to positive corrleation structures. By multiplexing several such tra c streams onto a link, the bu er occupancy does not decrease exponentially with the bu er size like in a Markovian tra c model� the decrease is only geometrical �Geo94, Geo95]. Some of the models used are described below. The papers �Geo94, Geo95] use an aggregation of on/o sources with heavy-tailed (leptokurtic) burst length distribution. Extensive mathematical proofs and simulations are given to assess the model. The paper �Vei93] presents two models, one based on a discrete hyperbolic distribution and one using a Pareto distribution for the packet arrival process. In �Mau94] a model based on fractional Gaussian noise (fGn) is introduced which is characterized by the mean value, the variance and the Hurst parameter. The focus is on LAN tra c that is o ered to a Metroplitan Area Network (MAN) implemented as a Distributed Queue Dual Bus (DQDB) network. A ve-state Markovian model is presented in �Rob95]. The ve states are used to capture the bursts occurring on di erent time scales.
Because self-similarity manifests itself as a power law in the frequency spectrum, the author of �Che95] uses an inverse Fourier transform to generate tra c measures out of a generated frequency spectrum. In �Nor93] a tra c model based on fractional Brownian motion is presented. A recursive algorithm based on normal distributed random number generation where the standard deviation is properly rescaled and the mean value is a rescaled version of the neighbor point. The rescaling is driven by the recursion level.
4.2.3 Voice Tra�c (Telephony) In �Hay83] the evolution of the prediction of the call arrival process is described for a telephony environment. It shows that the original Poisson model had to be revised to cope with switching networks where multiple paths are available between a source and destination pair. It also states that signi cant changes are expected for the future. Statistics on voice sources can be found in �Wil56]. The paper �Dai86] presents a packet voice-tra c model based on the assumption that active and idle periods are exponentially distributed. The authors, however, state that the idle periods are not that well captured by an exponential distribution. In �Tar93] a neural network is used to model packetized voice tra c for ATM networks. The same assumption about the on/o behavior is made as in �Dai86]. A more elaborated method for long-term prediction can be found in �Dav79]. The prediction is based on a projection algorithm by means of Kalman ltering.
4.2.4 Multimedia Tra�c (Video/Voice) The model in �Ske93] uses a histogram of the arrival process generated with the help of various video sequences. In �Luc94] two models are given, the rst one based on a Markov renewal process and the second model based on a discrete autoregressive model (Markov chain that includes the autocorrelation in the state transition matrix). A more extensive analysis of the model can be found in �And95]. The papers �Sen89] and �Liu93] present similar models. A model of teleconferencing without camera motions is given in �Hey92]. An autoregressive model of order 2 (the last two samples are considered for the generation of the next value) is used. In the paper �Gar94] a trace driven model is used. Several video sources are generated by selecting the starting points at di erent spots of the sampled movie at random. In addition, a synthetic model based on fractional noise is given. In �Arl95b] statistics for various video signal compression techniques can be found. Some statistics for picture formats are included as well.
4.2.5 World Wide Web (MOSAIC) The papers �Arl95a, Arl95b] present gathered WWW tra c statistics. It is shown that the transferred amount of data for requests and responses to and from the
Hyper-Text Transfer Protocol (HTTP) deamon are both heavy tailed. In addition, a parameterized model is introduced that can produce tra c similar to the one generated by the Xmosaic WEB browser.
4.3 Di�culties of Tra�c Modeling 4.3.1 Why Aggregated Tra�c
In future LANs an enormous number of di erent source types will be sharing the same network resources, i.e. voice, video, File Transfer Protocol (FTP), telnet, World Wide Web (WWW), and many more. Therefore, if one wishes to simulate a real-world environment such as the LAN of a bank or an airline, the question that arises very soon is, how can a real-world tra c mix be generated? What are the probability distributions of the call arrival times, call durations, QoS parameters, and the actual behavior of all those di erent sources. In addition, a supplier of networking equipment usually sells products in very di erent environments. So even mixes for di erent environments are needed to check, for instance, the performance of an ATM switch, with a high con dence, for all customers. It is certainly possible to gather statistics for the di erent sources and then deduce the probability distributions for the large number of parameters. The question is, how feasible is this? The deduced statistics are only valid for the very speci c environment from which they were obtained. The statistics would be valid in general for a certain environment if there were unlimited resources available� unlimited resources not only inside the network but also on all clients and servers on the network! In such cases all connections become independent of each other. Such a pathological environment is too much of an assumption. Connections do in�uence each other and often drastically, e.g. consider the many notoriously overloaded FTP sites all around the globe. It is also unrealistic to believe that one day we will have unlimited resources. This certainly has not happened in the computer industry so far. Human beings have always managed to reach the limits of the available capacity by using new applications. For example, the amount of memory has increased by several orders of magnitude, but we still put more and more memory into our computers to cope with new applications. Another problem is the fast-growing number of di erent applications and the extension of existing ones. Recently, WWW tra c has drastically increased. In April 1995, 26.2 percent of the tra c on the NSFNet was WWW tra c �Bla95]. In addition, the corresponding protocols are extended, thus changing the tra c pattern constantly. Furthermore, WWW tra c also depends very strongly on the browser used, which have di erent loading strategies. Applications such as WWW can be seen as a kind of networking killer. New compression techniques also belong in this category. A higher compression technique on the one hand reduces the mean transmission rate but on the other hand increases burstiness. Currently and in the near future, most of the tra c on ATM networks is and will be IP over ATM. The reason for this is that many applications have to be ported to ATM, a task which is often not straightforward because the choosing of tra c parameters can in many cases not be left to the user. Therefore, additional intelligence
has to be built into the programs that can choose reasonable tra c parameters. But as soon as applications change to native ATM APIs, the tra c pattern will change drastically again. There is work in progress �Alm95] to standardize a native socket interface for ATM. During the migration phase the mix will be even greater because of the presence of both. For all these reasons it makes sense to simulate tra c as a whole, the way it is seen on a link. A high-speed network is a very complex system with many parameters of in�uence. In the case of heavy loads the network can be compared to a system that is about to enter a chaotic state �Ber92, Dev89, Par89, Par87]. A slight increase in tra c and the system starts to collapse. \Just one more cell can break the network's back". Self-similar tra c seems to be an ideal vehicle to bring in the vast variability present in networking tra c because it produces bursts over a wide range of time scales. In addition, it disposes of the properties that often have been observed in networking tra c e.g. fra c measurements of LANs and compressed video. Furthermore, such tra c models can generate huge logs in relatively short period of time.
4.4 Aggregated Tra�c Models based on Fractals In many di erent areas where long time series �Taq86, Taq85, Cox84] are available certain correlation structures have been observed that manifest a self-similar (fractal) character. To give a few examples: Hydrology �Man65, Hur51] where the object of study is the amount of daily rainfall or the in�ux/out�ux of lakes, reservoirs or rivers. Economics �Mul95b, Mul95a, Eve95b, Eve95a, Gul95, Dac93, Pet91] where the time series consist of foreign exchange rates or trading values of stocks and bonds. Astronomy �Man65, Pet91] with time series of daily sunspot values (number of black spots on the surface of the sun). Communications �Lel94, Lel93] where the time series consist of tra c measurements or occurrences of errors �Man65]. For all the above time series, a memory e ect has been discovered. In other words, the past in�uences the future to a certain extent. The size of this long-term memory varies among di erent systems. In the case of the daily sunspot counts the cycle is about 11 years. The memory e ect can also be expressed in terms of correlation, i.e. there is either a positive or a negative correlation. A positive correlation means that when the series increases during a certain interval the probability is higher that it will increase again during the next interval. In the same way it is more likely that a decreasing interval will be succeeded by another decreasing interval. In contrast a negative correlation means that the probability is higher that an increase is followed by a decrease or a decrease is followed by an increase. A system that has neither a positive nor a negative correlation does not have a memory, so successive
values are completely independent of each other. In such a case the prediction of the future, not even the next value, is impossible. In the case of networking tra c measurements, positive correlation has always been observed. Many traditional tra c simulators assume uncorrelated memoryless behavior. For instance on/o sources with independent identically (exponential) distributed (IID) on/o periods produce uncorrelated tra c. The aggregation of on/o sources thus produces a tra c stream of white noise around the aggregated mean rate very rapidly with increasing number of sources. In the case of correlated tra c, bursts appear over a wide range of time scales and the smoothing e ect appears far more slowly. Another important point is that tra c generators for high-speed cell-based networks such as ATM �Bou91, Syk91, Pat93, Atm93, All95] must be capable of producing huge tra c logs in a short period of time. With increasing link speeds up to Gbit/s or even Tbit/s, event-driven simulation �Sch92, Scha92] becomes increasingly crucial, especially for traces spanning periods of several hours. Here methods are needed to produce tra c as a whole (�uid-�ow approach) compared to the aggregation of single sources. One of the key advantages of ATM is the concept of Quality of Service (QoS) assurance for reserved connections. A user can specify a sustainable cell rate, a peak cell rate, and a maximum burst size. Therefore, a tra c generator for reserved tra c must also produce values for these tra c parameters. So far only self-similar tra c generators for connectionless tra c �Nor93, Lel94, Rob95, Lau95] such as Ethernet LANs have been proposed. Recent studies �Bla95] show that the connection setup/release rates, today in the range of 102 per second, will have to increase drastically to cope with future demands. In the near future a tra c parameter renegotiation process will be introduced that allows connections to change their contract with the network without tearing down the connection rst and then reestablishing it with a di erent set of tra c parameters. In summary, for the evaluation of a call admission control algorithm I have established the following list of design goals to be ful lled by a tra c generator. 1. Produce self-similar tra c and call arrivals/departures over a wide time span and with di erent Hurst parameter values (see below). 2. Generate call arrivals/departures and the actual tra c. 3. Produce tra c parameters with every call arrival/departure. 4. Produce huge tra c logs (at least up to days). 5. Produce traces faster than the simulated time period. 6. Be scalable for di erent link utilizations, overbooking states, and link speeds. A remark on the generated arrival and departure process of connections: In this work it is assumed that the call arrival and departure processes are also correlated. It is currently not provable if this is true but some indications can be made that support this assumption.
Viewing networking tra c during the day, one observes something like a peak region during the morning and in the afternoon when most people are working. Such a behavior can also be observed during the night, when system administration is performed and backups are made. For di erent environments this kind of peak may appear at di erent times. The de nition of peak in this context is of course not meant to be a single spot, but a kind of trend line with increasing and decreasing intervals (hills and valleys). Another example can be observed by looking at a WWW browser. All the pictures on a Web page are transferred individually but in parallel, so there is a notion of a positive correlation. First, the main document is retrieved without pictures. During the upload process the browser determines which pictures have to be uploaded in order to complete the document. Whenever a needed picture is recoginized a new connection is forked to upload the picture. Therefore, the tra c starts to increase more and more. Whenever a picture has been completely uploaded the connection is released, thus generating a decrease in the number of connections. As soon as the page is complete the user views the information, thus generating an idle period. Further evidence is given by news groups and mailing lists where a mail or a posting can generate a tremendous amount of connections and tra c �ow caused either by the distribuiton process (NNTP, SMTP) or because numerous people react to the article or mail. The spreading process of news is very often correlated because it often spreads like a chain letter. For video on demand, certain correlations are also very likely. During the evening hours more people will start to watch a movie. This may be dependent on the season and the weather conditions as well. Certain groups of people will probablity generate other patterns during other hours, i.e. people who work at night. Another example can be seen in the stock market. When shares go up, more and more people start to buy the stock. At a certain culmination point where brokers start to make pro ts by selling the shares, the trendline starts to break into a negative slope that continues for a while because more and more people want to sell their shares. In general, whenever some kind of attractors are present in a system, correlations are very likely to occur. Examples of attractors are last-minute o ers, special sales, or other rare events. An attractor has the property that it can trigger a lot of activity. In addition, I also believe that self-similarity is a rather intrinsic property of the human being as well. Just to give two examples, relaxation periods span the range from fractions of seconds (short absences) to days (vacations). In between, the entire range is covered, i.e. co ee breaks, lunch breaks and night sleep. For many people the amount of work they can process runs through certain cycles of rather di erent time scales. Therefore, the usage pattern of networking and computing equipment is very likely to be correlated.
4.4.1 Introduction to Self-Similarity The mathematical de nition of self-similarity �Man83, Lel94] is as follows. Let X = (xt : t = 1� 2� 3� : : :) be a covariance stationary stochastic process with mean
� = E �xt], variance �2 = E �(xt ; �)2] and an autocorrelation function r(k) = E �(xEt ;�(x�)(;xt�+)k2 ]; �)] t
only depending on k = 0� 1� 2� 3� : : :. Now assume an autocorrelation function of the form r(k) � ak;� as k ! 1 with 0 < � < 2 and a a constant. Now let X m = (xmk : k = 1� 2� 3� : : :) be the averaged series over nonoverlapping blocks of size m which is: km X 1 m xk = m xi i=km;m+1
with k = 1� 2� 3� : : : and m = 1� 2� 3� : : :. For each m, X m is a covariance stationary process. X is called exactly second-order self-similar with self-similarity parameter H = 1 ; �=2 if for all m = 1� 2� 3� : : : var(X m ) = �2m;� (� sample variance) and
rm (k) = r(k)� with k � 0 X is called asymptotically second-order self-similar with self-similarity parameter H = 1 ; �=2 if for all large k rm(k) ! r(k)� as m ! 1: Here X is called exactly or asymptotically self-similar when the aggregated processes X m become indistinguishable from their root X in the sense of their autocorrelation function. There are three distinct regions for H, 0 < H < 1=2, H = 1=2 and 1=2 < H < 1. A value below 1=2 indicates a negative correlation whereas a value over 1=2 expresses a positive correlation. In the special case of 1=2 there is no correlation present. A more vivid characterization of self-similarity is the scaling law �Pei92] on di erent time horizons. This means that time series obtained with di erent sampling frequencies can be scaled such that they visually look the same. If the sampling frequency is doubled one has to scale the amplitude of the new series with a factor of 2H to make it look the same. This scaling law is illustrated in section 4.5.1 with a tra c sample on di erent time scales. Another mathematical property is that the frequency domain spectrum follows a power law and the spectrum disposes of a kind of harmonics.
4.4.2 Hurst Parameter Estimation There are several methods known to measure the Hurst parameter H of a time series, two out of which, R/S analysis �Hur51, Man69b, Man69a] and variance time plot �Lel94] will be described. Samples of diagrams can be found in section 4.5.1, where arti cially generated tra c will be analyzed. The same mathematical notation as in the previous section is assumed for a time series X .
The de nition of the R/S analysis is as follows. Let W = (wt = Ptu=1 xu ) be a time series consisting of all partial sums of the original time series. Now take the standard deviation over the interval �t + 1� t + s]: v 0 t+s 12 u u t +s X 1 X xA 2 ;@ t1 x S (t� s) = u u u s s u=t+1
u=t+1
and calculate the range R(t� s):
u u R(t� s) = 0max � w t +u ; wt ; (wt+s ; wt )] ; min �wt+u ; wt ; (wt+s ; wt )] �u�s 0�u�s s s
The ratio R(s� t)=S (s� t) is then called the rescaled range. One has now to select values for s and t and then calculate the rescaled range. The so-called pox diagram is obtained by plotting � ! R ( s� t ) log S (s� t) against log(s): For each s one calculates the mean value for the di erent k values. With the help of a least-squares t a straight line is then drawn through these points. The slope of this line is equivalent to the Hurst parameter H . The R/S analysis is known to be very robust against changes in the marginal distribution. The variance time plot is obtained from the relation var(X m ) = �2m;� which was given in the section 4.4.1 about self-similarity. By plotting � m) ! var( X log against log(m) �2 one obtains a curve which is a straight line. The slope � of this curve can vary between 0 and ;2. The value stands in the following relation to the Hurst parameter H : H = 1 ; �=2. A very e cient way to calculate points is to start with m = 2 and then multiply in each iteration by 2.
4.4.3 Fractional Brownian Motion (fBm) A well-known structure that has self-similar properties is fractional Brownian motion (fBm) �Man68, Man83]. Unfortunately, the term is ambiguous. It is sometimes used for the summed up deltas (actual position of a particle) and sometimes for the deltas itself. In order to make things clear in this thesis the term fBm is used for the summed increments whereas for the increments the term fractional Brownian noise fBn is applied. Fractional Brownian noise can be transformed into fractional Brownian motion and vice versa. There are several ways known in the literature to produce fBm and fBn. Some of these possibilities are
Fourier Transform: generate a frequency spectrum and then apply the inverse of a fast Fourier transformation to it �Che95, Pax95, Man77]. Displacement Process: exploit the fact that fBm is the limit of a fractional Poisson eld �Nor94, Man83, Fou82]. Pareto distribution: aggregate several on/o sources where the on/o periods are Pareto (heavy tailed) distributed �Geo94, Nor93]. Markov process: use a Markov processes to produce the high and low-frequency spectrum �Man71, Rob95]. Random Midpoint Displacement: summing up properly scaled Gaussian numbers in a recursive manner �Lau95, Pei92, Fou82].
This thesis focuses on the random midpoint displacement. Compared to the recursive implementation in the original paper �Fou82] the algorithm is transformed into an iterative one. An iterative implementation is more appropriate to generate huge data sets. In addition, a highly parallelized implementation can be achieved easily. Fractional Brownian motion with a prescribed Hurst parameter in the interval ]0� 1� is generated as follows: Initialization: x�0] = 0 Initialization: x�1] 1 h 1 i = Gx 0]+ x 1] + rG Iteration 1: x 2 = 2 2 h1i x 0]+x� 12 ] Iteration 2: x 4 = + r2G3 2 h3i 1 Iteration 2: x 4 = x� 2 ]2+x 1] + r2G4 hi 1 Iteration 3: x 81 = x 0]+2x� 4 ] + r3G5 hi 1 1 Iteration 3: x 83 = x� 4 ]+2 x� 2 ] + r3G6 hi 3 1 Iteration 3: x 58 = x� 2 ]+2 x� 4 ] + r3G7 hi 3 Iteration 3: x 78 = x� 4 ]2+x 1] + r3G8 ... Where the Gi denote normal distributed random numbers. The factor r is responsible for the scaling law and thus related to the Hurst parameter H: r = 21H with 0 < H < 1 In iteration n, 2n;1 new samples are generated. In case of a parallel implementation the number of processes that calculate samples can be doubled after each iteration. One has only to make sure that that random Gaussian numbers are generated with di erent seeds because on most systems random numbers are reproducible and therefore run through the same sequence. In a high-speed implementation a central process creates the rst couple of points and delegates the values at the beginning and end of the subintervals to newly
Figure 12: Process hierarchy forked processes. Each process generates its subintervals, see Fig. 12 The dashed boxes represent the processes. In this extreme case every process would calculate only one point, which is indicated by a black dot between the two border points. In a real implementation one would generate the rst couple of points by one process and then fork the additional processes that calculate a complete subinterval. In the case where memory is a bottleneck the subintervals can be calculated sequentially by reusing the array to store one subinterval The actual fBn is then generated by taking the di erence between two succssive samples. By applying a Hurst estimator to such a time series one can check the accuracy of H .
4.5 The Tra�c Generator The tra c �Dro96b] generator presented, is based on the random midpoint displacement algorithm �Lau95, Pei92, Fou82], but extended to two di erent levels. First, the call arrival/departure process for the aggregated mean rate is generated with fBn. Second, the actual tra c is generated as fBn around the mean rate. The following is part of the C-code for the tra c generator. It covers only the rst part to generate the call arrivals/departures, i.e. the peak/mean rate pairs. /* generate the mean and peak rate */ reduction = 1.0/pow(2.0,H)
scale_mean = 1.0
step = nr_of_reservation_steps-1
while (step > 1) { left = 0
right = step
while (right < nr_of_reservation_steps) { mean�(left+right)/2] = 0.5*(mean�right]+mean�left]) + scale_mean * normal_distribution(0.0,1.0)
left = right
right += step
} scale_mean *= reduction
step /= 2
} /* generate the noise */ for (i=0 i. It has to be shown now that the term var(X m )=�x2 remains constant under the linear transformation. It is X m = P (xmk : k = 1� 2� 3� : : :) with xmk = 1=m km i=km;m+1 xi . Now substituting xi by x + � m m yields Y = X + � . Inserting this into the original formula yields var( X m + � )=( 2�x2), which is equal to 2var(X m )=( 2�x2). Hence, and � disappear from the formula, thus making it invariable under the linear transformation. For the R/S analysis a similar proof can be given. After the mean and peak rates are generated the tra c is generated by further iterations. The tra c is generated as fBn around the mean rate. The scaling for the tra c is controlled by the mean and peak rate in the following way. For a single on/o source q with mean m and peak R the standard deviation can be calculated as � = m(R ; m). Viewing the link as a single on/o source is the worst case because there is no smoothing e ect at all. The tra c is then scaled such that the standard deviation is proportional to this worst case �. With the help of an additional parameter the proportion can be varied. For the presented results �=4 was used. In case a sample point falls below zero it is clipped to zero. The clipping is also done for points that are above the peak rate. This means that it is assumed that the user parameter control function is implemented and users are policed. In general the user should be policed right at the access to the network. The most time-consuming activity of the entire process is the writing of the data to the disk. A sequential iterative implemented version used about 28 s on an RS6000/590 to calculate 4� 194� 313 measurements including 524� 289 call arrivals and departures ( (R,m) pairs). Writing these values out to AFS takes about 3.5 minutes (binary format for Matlab). By using several processes that write out the trace, the speed can be improved. For very extensive simulations it is best to avoid writing the trace completely and feed generated tra c directly into the next component, i.e. into a link bu er.
4.5.1 Tra�c Generator Analyses The rst series of pictures (Figs. 13 to 17) is included to illustrate the self-similarity on di erent time scales. The Hurst parameter was set to H = 0:8. From picture to picture the sampling frequency was reduced by a factor of 10. In the rst picture the tra c is normalized to a peak rate of 1. A picture on a smaller time scale is a zoomed in version of the next higher time scale. In spite of this zooming over several time scales the pictures do look similar to each other. This is like in a Julia set �Pei92] where one can nd visualy similar structures by zooming up a certain region of the picture.
Figure 13: Generated tra c (time unit 10;3 s)
Figure 14: Generated tra c (time unit 10;2 s)
Figure 15: Generated tra c (time unit 10;1 s)
Figure 16: Generated tra c (time unit 1s)
Figure 17: Generated tra c (time unit 10s)
In Fig. 18 the result of the R/S analysis is depicted. The estimator yielded H = 0:796. For the trend line a least-squares t was applied. In addition, two lines with slope 0:5 and 1:0 are shown to make the diagram more readable. 7
6
log( R(s,t)/S(s,t) )
5
4
3
2
1
0
−1 0
1
2
3
4
5
6
7
log(s)
Figure 18: R/S analysis: H = 0.796 The result of the variance-time plot analysis is given in Fig. 19. Some measurement points at the beginning and at the end were not considered for the trend line. But there is a large region where the trend is a straight line. 1
0
log( var(X^m)/sigma^2 )
−1
−2
−3
−4
−5
−6
−7 0
1
2
3
4
5
6
7
log(m)
Figure 19: Variance time plot: H = 0.795 In Fig. 20 the call arrivals and departures with aggregated peak and mean rate including the tra c are shown. Every 8 ms there is a change in the reservation state. This is an appropriate value for a switch that handles 125 connection setup/teardowns per second (or renegotiations). The sampling interval for the tra c was set to 1 ms which, is equivalent to 366 cells on a 155 Mbit/s link.
Figure 20: Peak rate, mean rate, and tra c (time-resolution 10;3 s) The correlation structure can clearly be seen. Increments are more often followed by increments and decrements are more often followed by decrements. In the next series of pictures the Hurst analysis and the generated tra c is depicted for di erent values of H . In pictures Fig. 21 and 22, H was set to 0:5. R/S analysis yielded a value of H = 0:49 while the variance time plot gave H = 0:50.
Figure 21: R/S and variance time plot Hurst analyses: H = 0.5 The generated tra c is similar to a random-walk which means that there is no correlation and no memory in the process. A Poisson process for instance has the same properties, no memory and no correlation. In Fig. 23 to 26, generated tra c and a Hurst analyses are given for H = 0:6, and H = 0:7. For H = 0:6 The R/S analysis yielded H = 0:6, whereas the variance time plot revealed H = 0:59. For H = 0:7 both estimators yielded H = 0:69. Figure 25 and 26 depict the analyses and tra c for H = 0:9. With this high H value a clear correlation can be observed. The likelihood that increments are followed by increments and decrements by decrements is very high. Therefore, the curves look
Figure 22: Peak, mean, and tra c with H = 0.5 like trend lines running through cycles. The R/S estimator yielded H = 0:89 and the variance time plot H = 0:88. Towards the boundary value of H = 1 the RMD algorithm produces tra c with too small an H value. The same phenomena can be observed towards the border of H = 0 where the algorithm produces data sets with higher H values than actually speci ed. In the case of networking tra c the H value was always above 0.5 and below 0.9 �Lel93, Lel91, Lela91]. Therefore, the interesting region is not towards either of the two borders of the H spectra. Because of reactive �ow control methods such as backpressure �Che92, Che93] it may be possible that one will also observe negative short-term correlations in the future. On larger time scales there is however an intuitive explanation for positive correlation. During a day period, users arrive in
Figure 23: R/S and variance time plot Hurst analyses: H = 0.6
Figure 24: Peak, mean, and tra c with H = 0.6 the morning one after the other. and they start to produce more and more tra c. During the lunch break one will observe a certain decay in tra c whereas during the afternoon the tra c will increase again. One remark on the generated call arrivals and departures as well as the tra c: All the generated measures are the tra c o ered to a network with unlimited resources. This property is sometimes called \free tra c" �Man95]. In the case of using the generated tra c as input to a call admission control (CAC) algorithm where some connections are rejected, one has to be aware of possible changes in the statistical properties of the samples. How strong the changes will be depends very much on the likelihood of rejections. If a network is operated close to its maximum capacity it becomes more likely that new connections will be rejected. All the real-world
Figure 25: R/S and variance time plot Hurst analyses: H = 0.7
Figure 26: Peak, mean, and tra c with H = 0.7 measurements of LAN tra c �Lel94] come from shared media networks (Ethernet) without any kind of QoS reservation. This means a user can simply try to send data into the network without going through a call setup. This is in marked contrast to a reserved connection in ATM where the connection can be refused. In addition, sources are policed to their committed contract. In order to use the tra c generator to study and evaluate a CAC algorithm the following rules were applied to simulate call rejections. Whenever an increase of the transmission rate (new connection or renegotiation) was rejected, the previous values of the peak and mean rates were kept and the tra c from the last interval (point
Figure 27: R/S and variance time plot Hurst analyses: H = 0.9 between reservation changes) was copied to the next interval. This is of course a heuristic approach but it helps one cope with the problem of \free tra c" as
Figure 28: Peak, mean, and tra c with H = 0.9 input. This will be illustrated further in Chapter 5, where the call admission control algorithm will be presented and evaluated. To evaluate a CAC one has to feed it also with tra c around the maximum capacity because this is the region of interest where in case of false decisions cell losses occurred with a very high probability. In this way it is also possible to increase the probability of \rare events". To give a brief summary of this section, a high-speed, self-similar tra c generator was presented that ful lls the six design goals stated in section 4.4. The method generates tra c as well as the peak and mean cell rates of the aggregated connections on a link. The generation is achieved by a new two-level random midpoint displacement algorithm. The set of input parameters consists of the Hurst parameter H , a utilization factor � (m/R), an overbooking factor o, a noise reduction factor v, a starting seed s and the number of samples to generate. As output is produces, the peak and mean cell rates as well as the tra c measures. For the mean and peak rate (call arrivals and departures) the output is similar to an equidistant (changes every 8 ms) discrete time simulation. The tra c consists of equidistant tra c measurements (one sample per millisecond). Because of the discretization e ect the model incorporates both �uid-�ow and discrete event techniques. The tra c generator can also be used for groups of connections such as virtual path connections or groups of connections that belong to the same tra c classes.
5 The WAAN CAC Algorithm In this chapter the Wavelet Analyzing Adaptive Network (WAAN) CAC �Dro96a, Dro95] will be presented in detail. First, the set of requirements for the CAC will be stated. Before the actual SDL �Tel93, Bel91] speci cation of the algorithm is presented, an introduction to wavelet theory will be given. The core part of the CAC algorithm is based on periodical wavelet transformations applied to partial overlapping windows of tra c measurements. Later, possible application areas will be shown and the feasibility of the algorithm demonstrated.
5.1 Statement of Problem and Requirements The following are the conditions as well as the general requirements for the WAAN CAC algorithm: Input parameters per connection are peak cell rate R, mean cell rate m, and the maximum burst size b or a subset thereof. Real-time decisions whether to accept or reject a new connection or an increase of the transmission rate through a renegotiation process must be possible, even up to high connection set-up/tear-down rates. It must determine the amount of resources to be allocated for the new connection or the increase through renegotiation. It must generate appropriate tra c measurements and specify an algorithm to process the measurements to derive the concept of an e ective capacity (see below). It must be scalable for di erent link speeds and di erent network architectures such as xed-size and variable-size packets. It must be applicable to individual connections or bundles of connections, i.e. VPCs or di erent tra c classes. Its complexity should be as low as possible or else special low-cost hardware must be available to cope with the complexity. It must be a highly adaptive method that can cope with changing tra c dynamics and it must be �exible enough to adopt requirements for future changes in networking tra c. It must be usable on all types of interfaces: UNI, NNI as well as PNNI. It must be applicable to point-to-point, point-to-multipoint, and multipointto-multipoint connections. The method must also work for simplex and duplex types of connections and, in the case of duplex, for asymmetric tra c speci cation for the forward and backward directions.
It must be applicable in the case of heterogeneous network architectures with di erent resource allocation methods. It must be independent of the chosen AALs and other higher layers as requested by the ATM Forum. It must optimize performance of the network while still ful lling tra c requirements of the connections. The term e�ective capacity is used henceforth to denote a transmission rate in the region between the aggregated mean and peak cell rate. Its value determines the trade-o between a statistical gain and a certain cell loss rate. It is similar to the term equivalent capacity but with one fundamental di erence. E�ective capacity is a measurement-based value whereas equivalent capacity is based on statistical models that are imposed on the sources.
5.2 Introduction to Wavelets This subsection is intended to give an introduction to wavelets �Gra95, Zel94, Hwa93, Vet92, Mal89]. It is certainly not my intention to present the entire mathematical background to the theory. The wavelet analyses are used as a tool in the call admission control algorithm to compute an e ective capacity. No claims are made about new discoveries in wavelet theory. A profound background of the theory can be found in �Kai94, Chu92a, Chu92b]. Good sources for signal processing in general are �Opp89, Vis94]. Wavelet analysis can be compared to Fourier analysis. It transforms a signal from the time domain into the frequency domain. In the case of Fourier analysis one is either in the time domain or in the frequency domain but there is no direct relationship between the two. This means that in the frequency domain one can determine which frequencies appeared and how strongly they are present but not where (in the time domain) they appeared. To cope with this problem a Windowed Fourier Transformation (WFT) can be used where the input signal is split into di erent windows which are then analyzed individually. The di culty of this approach lies in the way the window borders have to be handled. The wavelet analysis solves this problem by dealing with the input signal at di erent scales or resolutions. On a large scale the focus is on gross features, i.e. trends, whereas on a small scale minor features, i.e. noise, are of interest. The general idea is to adopt a wavelet prototype function, called an analyzing wavelet or a mother wavelet. These functions are bases in the function space. Compared to a Fourier transform where only one basis consisting of sines and cosines of di erent frequencies exists, one has the choice of numerous bases. This freedom has its price of course, as it is often quite di cult to nd the optimal basis for a particular input data set. Temporal analysis is carried out with a contracted high-frequency version of the mother wavelet. The frequency analysis is done with a dilated low-frequency version of the prototype wavelet.
Many di erent elds such as astronomy, physics, economics, acoustics, signal and image processing, speech recognition, image compression, and the analyses of fractals, continue to make successful use of wavelet theory. The analyses of fractals justi es the use of wavelets because fractal properties have been widely observed in networking tra c. This thesis includes an additional eld, namely call admission control and resource allocation for high-speed networks in particular. I predict a bright future for wavelet analysis and signal processing in general in the area of high-speed networks. I am convinced that measurement-based approaches are of more general use than statistical models because they are more adaptable and require fewer assumptions. Signal processing methods can be used to determine the real behavior of an individual source or an entire group of sources without a priori knowledge of the behavior. Similar to the Fast Fourier Transformation (FFT) there exists a Fast Wavelet Transformation (FWT). Instead of FWT it is sometimes called the Discrete Wavelet Transformation (DWT). The FFT has a complexity of O(n log n), whereas the FWT can be calculated in O(n). For both transformations the input length is expected to be a power of 2, i.e. 2n . Figure 29 is a block diagram of the algorithm. The box
Figure 29: Fast Wavelet Transformation Algorithm marked # 2 stands for a down-sampling of 2. This is achieved by dropping every other sample of the input data. The high-pass ltered output on each scale is kept as the coe cients of that scale. The low-pass ltered and down-sampled output is fed back as input to the transformation process. This process is sometimes called a pyramid algorithm because of the hierarchical processing. The loop is performed until no samples are left. On each scale the number of coe cients is reduced by a factor of 2. The total number of coe cients over all scales equals the number of input values. To be precise, there is actually one coe cient less than the original input size but the nal residual is counted as one coe cient as well, thus yielding the original sample size of coe cients. Low-pass ltering smoothes the signal whereas high-pass ltering reveals details. In signal processing terminology such a lter pair is called quadrature mirror lter pair. In wavelet theory the mother function for the low-pass lter is called the scale function and the mother function for the high-pass lter the wavelet function. The synthesis is similar to the analysis but, instead of
a down-sampling afterwards, rst an up-sampling is carried out by inserting a zero every other sample. It was mentioned above that there are numerous possible bases already known and new ones are still being discovered. Wavelets are classi ed into several distinct families. Within a family, a further distinction is made according to the number of coe cients, which is usually called the order of the wavelet or lter. All wavelets that will be presented here are of compact support, which means that they vanish outside a certain interval. The Fig. 30-38 were generated with a wavelet tool-box �Gon94] for Matlab �Mla93], which is available in the public domain. h
g
2
1
1.5
0.5
1 0 0.5 −0.5
0 −0.5 1
1.5
2
−1 1
1.5
rh
2
rg
2
1
1.5
0.5
1 0 0.5 −0.5
0 −0.5 1
1.5
2
−1 1
1.5
2
Figure 30: Daubechies 2 (Haar) lters One of the simplest known bases is the Haar wavelet �Haa10], named after its inventor. Later on the Daubechies wavelet family was found and the Haar wavelet was |H|[dB]
|G|[dB]
10
10
0
0
−10
−10
−20
−20
−30
−30
−40 0
1
2
3
4
−40 0
1
|RH|[dB] 10
0
0
−10
−10
−20
−20
−30
−30 1
2
3
4
3
4
|RG|[dB]
10
−40 0
2
3
4
−40 0
1
2
Figure 31: Frequency response of a Daubechies 2 (Haar) lter
discovered to be a special case of this new family. In Fig. 30 the low- and high-pass analyses lters h and g as well as the low- and high-pass synthesis lters rh and rg are depicted. The Fig. 31 shows the frequency response of the individual lters. The lters have moderate attenuation. The Haar wavelets form an orthonormal basis. This property can be seen from the relations among the lters. The lters h and rh as well as g and rg are mirrored (with respect to the vertical middle axis) versions of each other and all of them are the same size. Figure. 32 depicts the mother wavelet Scale function 2 1.5 1 0.5 0 −0.5 0
10
20
30
40
50
60
70
50
60
70
Wavelet function 1 0.5 0 −0.5 −1 0
10
20
30
40
Figure 32: Wavelet and scale function of a Daubechies 2 (Haar) lter and scale functions for the given lter basis. The scale function is a moving average operator and the wavelet function is a moving di erentiator. Higher order lters of the same family are depicted in Fig. 33. The length of these lters is 16 instead of 2. An important property of the Daubechies family is that h
g 1
0.5
0.5 0
0 −0.5
0
5
10
15
20
−1 0
5
rh
10
15
20
15
20
rg 1
0.5
0.5 0
0 −0.5
0
5
10
15
20
−1 0
5
10
Figure 33: Daubechies 16 lters
the wavelet itself has a self-similar structure. Here again one observes a somewhat |H|[dB]
|G|[dB]
100
100
0
0
−100
−100
−200
−200
−300 0
1
2
3
−300 0
4
1
|RH|[dB] 100
0
0
−100
−100
−200
−200
1
3
4
3
4
|RG|[dB]
100
−300 0
2
2
3
−300 0
4
1
2
Figure 34: Frequency responses of a Daubechies 16 lters intuitive relationship between what we want to analyze and how we go about it, because on both sides there is self-similarity present. The bump between 5 and 10 converges to a rescaled copy of the original shape when the order is increased further. For the Daubechies family the self-similarity is twofold� rst, the lters themselves are self-similar, and second, the scaled versions of the mother wavelet are again self-similar to each other. The lters have an asymmetric appearance, which is very common for wavelets. There are a few exceptions, however, one of Scale function
0.5
0
0
100
200
300
400
500
600
700
800
900
1000
700
800
900
1000
Wavelet function 1 0.5 0 −0.5 −1 0
100
200
300
400
500
600
Figure 35: Wavelet and scale function of Daubechies 16 lters which will be shown below. Compared to the lter size of 2, the attenuation is about 10 times higher, yielding a sharp cuto frequency (Fig. 34). The sharpness of the cuto frequency increases with the lter size. The low-pass lter is not a
simple moving average function. It weights the signal di erently according to the lter shape. This process can be compared to edge detection in computer vision. The question is, which shapes are good or even the best for lters such that they produce strong outputs at places of interests, i.e. at the center of an edge. The scale and wavelet function are given in Fig. 35. The wavelet function resembles the Canny lter �Can86], a lter that is used quite successfully for edge detection in computer vision. In Fig. 35 it can be seen where the term wavelet comes from. The functions are small waves that vanish outside of a small window. h
g
4
0.4
2
0.2
0
0
−2
−0.2
−4 0
10
20
30
40
−0.4 0
5
rh
rg
0.4
4
0.3
2
0.2
0
0.1
−2
0 0
10
5
10
−4 0
10
20
30
40
Figure 36: Spline 16/8 lters In the last series of picture (Fig. 36 to Fig. 38) an example of a symmetrical basis is shown. They are called spline wavelets and belong to the category of bi-orthogonal |H|[dB]
|G|[dB]
100
100 0
0
−100 −100 −200 −200 −300 0
−300 1
2
3
4
−400 0
1
|RH|[dB]
2
3
4
3
4
|RG|[dB]
100
100 0
0
−100 −100 −200 −200 −300 0
−300 1
2
3
4
−400 0
1
2
Figure 37: Frequency responses of spline 16/8 lter wavelets (two orthogonal basis that are rotated against each other with an inner
product across them of 1). This property is re�ected by special mathematical relationships among the lter coe cients. These lters are often seen in computer vision, where they are usually called Mexican hat lters because of their shape. For this type of basis the lters have di erent sizes: h and rg have a length of 39, whereas g and rh have a length of only 9. In addition, all lters are di erent in shape and there is no simple operation such as mirroring to transform one lter into the other. The attenuation depicted in Fig. 37 is of approximately the same intensity as for the Daubechies 16 wavelet but, in addition, the frequency response reveals that h and rg dispose rst of an amplifying region, thus it weights the input signal di erently again. Therefore, with di erent lters one can detect di erent properties of the input signal. The scale function as well as the wavelet function are symmetric with respect to their vertical middle-axis. The scale function resembles a Gaussian Scale function 0.4 0.3 0.2 0.1 0 0
100
200
300
400
500
600
Wavelet function 1.5 1 0.5 0 −0.5 −1 0
500
1000
1500
Figure 38: Wavelet and scale function of the spline lters (bell-shaped) curve, and the wavelet itself looks like a scaled version of the eigth derivative. The most striking di erence between Fourier and wavelet transformation is that the wavelet functions are localized in space and frequency. Sines and cosines do not have both of these properties. Because they are periodic nonvanishing functions, they are localized only in frequency. This twofold localization very often generates a sparse spectrum of coe cients, a property that is desirable in many applications such as image compression or noise removal in time-series. To illustrate the twofold localization for the Haar wavelet, the following Fig. 39 example with 8 samples is given. On the rst scale the coe cients c1 to c4 are generated. Then on the second scale c5 and c6 are generated. The underbracing indicates the localization of the calculated coe cient. This region is given by the down-sampling operation that contracts the data in each iteration by a factor of 2. Compared to the Fourier transformation the coe cients belong to a certain part of the input signal. In most implementations the coe cients are put in one vector one scale after the other, the last coe cient being the nal residual of the low-pass ltering. The total number of coe cients is therefore equal to the input sample size.
input measuremnts scale 1 scale 2 scale 3 & residual
2 ` 6 ` 7 ` 1 ` 3 ` 4 ` 5 ` 8 ` 1 `
2 `
3 `
5 `
4 ` 6 `
wavelet coefficients
`
Call Admission Controler (CAC) 8 7
`
Figure 39: Wavelet hierarchy The two localization criteria are achieved using shifted and dilated versions of the mother wavelet. These modi ed versions constitute the basis. Mathematically the translations and dilation can be expressed �(s d)(x) = p1 s �( 21s x ; d): 2 The two variables s and d are integers and stand for the scaling and dilation. The position of the wavelet is given by d and the width is related to s. Because of the scaling and dilation the wavelets are self-similar to each other. The size is doubled in each iteration. In order to span the data domain at di erent resolutions, the mother wavelet is used in a scaling equation
W (x) =
NX ;2 k=;1
(;1)k ck+1 �(2x + k)�
where the ck are the lter coe cients and W (x) is the scaling function for the analyzing wavelet �. In order to have certain properties such as orthogonality, the coe cients have to ful ll special mathematical relationships, e.g. the inner product of the basis functions has to yield the Kronecker � function. In the case of the FWT algorithm the lters remain unchanged during the transformation. The scaling and dilating comes into the process implicitly by the iterative process and the down-sampling. Instead of doubling the lters, the data is downsampled in each iteration to half of the previous data size.
5.3 General Architecture of the WAAN CAC Figure 40 depicts the building blocks of the method. In order to simplify the description it is assumed that only one instance of the method is present. In general, multiple instances that control groups or individual connections can be present. The
method is a hop-by-hop architecture, which has to be applied to every leg of the path. Some connections can be excluded from the method. For instance, a conOne instance
`
Link buffer
Sampler
Link
Queue Manager Inc/ Dec(R,m)
Sampler
Resource
DSP
Manager Yes/No
Call Admission Controler (CAC)
Figure 40: General architecture nection with a burst generation rate larger than the window size simple peak rate allocation can be made. The burst generation rate can be calculated from the tra c parameters m and b according to burst rate = b=m. It is the minimum time between two maximum bursts of an on/o source. As the description given here is valid for an ATM network, all tra c parameters are given in cells per second. In the case of variable-sized packets, the method can still be used by expressing the parameters in bits per second. In addition, the description is given only for a wavelet transformation, in general a Fourier transformation or Multi-Resolution Analysis (MRA) could be used to separate the signal from the noise. Because of the weighted lters and dual localization in time and frequencies the wavelets are a more appropriate tool for signal/noise separation than a Fourier transformation is. With wavelets the noise can be detected faster and only at spots where noise really occurs. MRA is even broader than wavelet transformation because it involves any kind of analyses on di erent scales. MRA is often used to nd appropriate lter basis for a certain application. Cells arriving from the switch are put into the link bu er. The sampler generates periodic tra c measurements. The measurements consist of cell counts divided by %t. The measurements are thus in the interval �0� max cell rate]. In an e cient product implementation the cell counts can be used directly because the division is a linear scaling, which can also be applied afterwards! The sampling frequency depends on the link speed and the bu er size. The sampler feeds its output into the bu er of the Digital Signal Processor (DSP). In periodic intervals the DSP analyzes the samples and calculates the e ective capacity, which it sends to the resource
manager. The detailed algorithm will be given below. The queue manager checks the queue length. If the queue length exceeds a certain threshold or if cell losses occur, this is signaled to the resource manager. The queue manager also signals to the resource manager if a certain period of time passes without cell losses. Call arrivals and departures as well as increments or decrements are presented to the resource manager by the signaling protocol, e.g. Q.293b. The resource manager either accepts or rejects arrivals and increases. Departures and decreases are always granted. It also adjusts the out rate of the bu er.
5.4 Synthetic Model The general operation of the algorithm is rst given in synthetic form. Then the individual components are described in more detail. For the synthetic model the following parameters are necessary:
A(t)� t = 0� 1� 2� : : :: n = 0� 1� 2� : : :: Ln (t): Hn (t): Cn(t): Cn0 (t): w = 2m : c = 2k : j = 0� 1� 2� : : : � m X: �: A(w + nc): A(nc):
Equidistant tra c measurements (cell counts), Window number, Low-frequencies in window n, High-frequencies in window n, Wavelet coe cients (window n), Modi ed wavelet coe cients (window n), Window size, Calculation rate, Iteration level, Bu er size (in cells), Allowed bu er utilization, Right border of window n, Left border of window n.
The original tra c measurement curve of a window is split into the two components L and H according to
A(s) = Ln (s) + Hn j (s)� nc � s < w + nc where
�X s
max H (i) nc�s