Trace Clustering based on Conserved Patterns: Towards Achieving Better Process Models R.P. Jagadeesh Chandra Bose1,2 and Wil M.P. van der Aalst1 1
Department of Mathematics and Computer Science, University of Technology, Eindhoven, The Netherlands
[email protected],
[email protected] 2 Philips Healthcare, Veenpluis 5-6, Best, The Netherlands Abstract. Process mining refers to the extraction of process models from event logs. Real-life processes tend to be less structured and more flexible. Traditional process mining algorithms have problems dealing with such unstructured processes and generate “spaghetti-like” process models that are hard to comprehend. An approach to overcome this is to cluster process instances such that each of the resulting clusters correspond to coherent sets of process instances that can each be adequately represented by a process model. In this paper, we present multiple feature sets based on conserved patterns and show that the proposed feature sets have a better performance than contemporary approaches. We evaluate the goodness of the formed clusters using established fitness and comprehensibility metrics defined in the context of process mining. The proposed approach is able to generate clusters such that the process models mined from the clustered traces show a high degree of fitness and comprehensibility. Further, the proposed feature sets can be easily discovered in linear time making it amenable to real-time analysis of large data sets. Key words: Clustering, fitness, process mining, process discovery, case similarity
1 Introduction Process mining refers to the extraction of process models from event logs [1]. An event log corresponds to a set of process instances following a particular business process. A process instance is manifested as a trace (a trace is defined as an ordered list of activities invoked by a process instance from the beginning of its execution to the end). Process mining techniques can deliver valuable, factual insights into how processes are being executed in real life. These insights are obtained by analyzing event logs. Real-life processes tend to be less structured than what the stakeholders typically expect. Healthcare, product development, customer support etc. are some of the examples of such flexible environments. In such environments, discovering the actual process which is being executed/followed is of significant importance. These insights help organizations to improve the understanding of current situation, and is a prerequisite
2
R.P.J.C.Bose and Wil van der Aalst
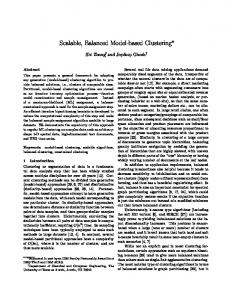
for any process improvement or quality control effort. However, traditional process mining algorithms have problems dealing with such unstructured processes and generate “spaghetti-like” process models that are hard to comprehend. This is caused by the inherent complexity of processes; all possible behaviors are shown in a single diagram. Considering the set of traces in the event log all at once might lead to ambiguities for the mining algorithms which often result in spaghetti-like models. An approach to overcome this is to cluster the traces such that each of the resulting clusters correspond to coherent sets of cases that can each be adequately represented by a process model. The application of process mining techniques to traces from such clusters should generate models that have a (i) high degree of fitness and (ii) low degree of structural complexity (less “spaghetti like”). Fitness quantifies how much of the observed behavior is captured in the model. Figure 1 illustrates the significance of trace clustering in process mining. The process model on the top of Figure 1 is a process model mined from the entire event log (of a real-life case study described as in Section 4). The model is quite complex to comprehend. The bottom rectangle of Figure 1 depicts the process models mined from clustered traces. It is evident that clustering enables the comprehension of process models by reducing the spaghetti-ness.
Fig. 1. Significance of trace clustering in Process Mining
Traditional approaches (to trace clustering) in the literature can be classified into two categories: 1. Techniques where the traces are transformed into a vector space model whose features are defined by the activities (bag-of-activities), transitions and kgrams (subsequence of k-activities) [2], [3], [4]. Clustering can then be done
Trace Clustering based on Conserved Patterns
3
using a variety of techniques (such as Agglomerative hierarchical clustering and k-means clustering) with different distance metrics in the vector space (Euclidean distance, Jaccard distance etc). 2. Syntactic techniques which operate on the whole sequence “as-is” by applying string distance metrics such as Levenshtein distance and generic edit distance in conjunction with standard clustering techniques [4]. The k-gram and generic edit distance approaches incorporate certain context information. In [4] we showed that techniques that incorporate context perform better than those that do not. The Generic edit distance based approach is sensitive to the cost function (of edit operations). Therefore, we [4] have proposed an automated approach to derive the cost function and showed that the generic edit distance based technique outperforms other contemporary approaches to trace clustering. In this paper, we present robust context-aware feature sets based on conserved patterns for the vector space model and show that the proposed feature sets have a better performance than contemporary approaches. Further, the proposed technique is simple to implement and has a linear time complexity whereas the traditional approach based on generic edit distance has a quadratic time complexity. We evaluate the goodness of the clusters from a process mining perspective as mentioned above on a real-life log of Philips Healthcare. The remainder of the paper is organized as follows. In Section 2, we define the feature sets based on conserved patterns, and explain the means to discover the feature sets. Section 3 presents the clustering approach and introduces the metrics used to evaluate the goodness of clusters. In Section 4, we present and discuss the experimental results. Related work is presented in Section 5. Finally, Section 6 concludes with remarks on future directions.
2 Context-Aware Feature Sets Based on Conserved Patterns In this section, we propose new feature sets that are context-aware for the vectorspace model. The basic idea is to consider sub-sequences of activities that are conserved across multiple traces. Unlike the k-gram approach where we consider sub-sequences of k-activities (for a fixed k), these feature sets are based on subsequences of different lengths. Finding similar regions (sequence of activities) common within a trace and/or across a set of traces in an event log signifies some set of common functionality accessed by the process. In other words, a region of high similarity shared within a process instance or between two or more process instances might be evidence of common functionality (often abstracted as a sub-process). Using these conserved sub-sequences as features will enable the clustering of traces in such a way that two traces having a lot of conserved regions common between them are put in the same cluster. We now formally describe the definition of these sub-sequences and the feature sets. – Maximal Pair: A maximal pair in a sequence, T, is a pair of identical subsequences α and β such that the symbol to the immediate left (right) of α is
4
R.P.J.C.Bose and Wil van der Aalst
different from the symbol to the immediate left (right) of β. In other words, extending α and β on either side would destroy the equality of the two strings. A maximal pair is denoted by the triple hi, j, αi where i and j corresponds to the starting position of α and β respectively in T with i 6= j. – Maximal Repeat: A maximal repeat in a sequence, T, is defined as a subsequence α that occurs in a maximal pair in T . – Super Maximal Repeat: A super maximal repeat in a sequence is defined as a maximal repeat that never occurs as a substring of any other maximal repeat. – Near Super Maximal Repeat: A maximal repeat α is said to be a near super maximal repeat if and only if there exist at least one instance of α at some location in the sequence where it is not contained in another maximal repeat. Consider the event log, L = {aabcdbbcda, dabcdabcbb, bbbcdbbbccaa, aaadabb ccc, aaacdcdcbedbccbadbdebdc} over the alphabet A = {a, b, c, d, e}. Table 1 depicts the maximal, super maximal and near super maximal repeats present in each trace of the event log. For trace T1 , the set of maximal repeats is {a, b, bcd}. Since maximal repeat b is subsumed in maximal repeat bcd, b does not qualify to be a super maximal repeat. The occurrence of maximal repeat b at position 6 in T1 does not overlap with any other maximal repeat. Hence b qualifies to be a near super maximal repeat. In trace T3 all occurrences of maximal repeats b and bb coincide with the maximal repeat bbbc. Hence both b and bb does not qualify to be near super maximal repeat. The occurrence of maximal repeat c at position 10 in T3 does not coincide with any other maximal repeat. Hence, c qualifies to be a near super maximal repeat. Table 1. Maximal, Super Maximal and Near Super Maximal Repeats in each trace in the Event Log L Id Trace T1 T2 T3 T4 T5
aabcdbbcda dabcdabcbb bbbcdbbbccaa aaadabbccc aaacdcdcbedbccbadbdebdc
Maximal Repeat Set Super Maximal Repeat Set {a, b, bcd} {a, bcd} {b, dabc} {dabc} {a, b, c, bb, bbbc} {a, bbbc} {a, b, c, aa, cc} {b, aa, cc} {a, b, c,d, e, aa, bd, {e, aa, bd, cb, db, cb, db, dc, cdc} cdc}
Near Super Maximal Repeat Set {a, b, bcd} {b, dabc} {a, c, bbbc} {a, b, aa, cc} {a, c, e, aa, bd, cb, db, dc, cdc}
Let us denote the set of maximal repeats, super maximal repeats and near super maximal repeats by M , SM and N SM respectively. The following relation holds between the three. SM ⊆ N SM ⊆ M Near super maximal repeats are a hybrid between maximal repeats and super maximal repeats in that it contains all super maximal repeats and those maximal repeats that can occur in isolation in the sequence without being part of any other maximal repeat. Near super maximal repeats can assist in identifying choice constructs in the process model. The set N SM \ SM (the set difference) depicts all maximal repeats that occur both in isolation and are also subsumed
Trace Clustering based on Conserved Patterns
5
in some other maximal repeat. For any repeat r ∈ N SM \ SM , a super maximal repeat rs which contains (subsumes) r can be either of the form αr or rβ or αrβ (where α and β are subsequences of activities). This indicates that r can be a common functionality which might occur in conjunction with α and/or β. In other words, it indicates that α and β can potentially be optional (sequence of) activities in the context of r. In order to find the commonalities across the traces in the entire event log, we first construct a single sequence which is obtained by the concatenation of traces in the event log with a distinct delimiter between the traces and apply the repeat definitions on the concatenated sequence. Table 2 depicts the maximal/super maximal/near super maximal repeats present in the entire event log, L. These are the repeats in the sequence obtained by concatenation of all traces in the event log. Table 2. Maximal, Super Maximal and Near Super Maximal Repeats in the Event Log L M SM NSM
{a, b, c, d, e, aa, ab, ad, bb, bc, bd, cb, cc, cd, da, db, dc, aaa, abc, bbc, bcc, bcd, cdc, dab, abcd, bbbc, bbcc, bbcd, bcda, dabc, bcdbb} {e, ad, bd, cb, aaa, cdc, abcd, bbbc, bbcc, bbcd, bcda, dabc, bcdbb} {e, aa, ad, bb, bd, cb, cc, db, dc, aaa, bcc, cdc, dab, abcd, bbbc, bbcc, bbcd, bcda, dabc, bcdbb}
We consider a maximal repeat, super maximal repeat or near super maximal repeat as a repeat henceforth (and distinguish between them where necessary). Repeats signify some common functionality (sub-process) present across traces. For a repeat, r, let repeat alphabet Γ (r), denote the set of symbols/activities that appear in the repeat. For example, for the repeats abba, abdgh, and adgbh, the repeat alphabets correspond to {a, b}, {a, b, d, g, h}, and {a, b, d, g, h} respectively. 2.1 Equivalence class of repeats under a repeat alphabet Different repeats can share a common repeat alphabet. In the above example, the repeats abdgh and adgbh share the same repeat alphabet {a, b, d, g, h}. We can define equivalence classes on repeat alphabet. [X] = {r | r is a repeat and Γ (r) = X} For the above example, [{a, b, d, g, h}] = {abdgh, adgbh}. Furthermore, the equivalence class under repeat alphabet will capture any variations in the manifestation of a process execution due to parallelism. 2.2 Feature Sets Based on the above definitions of maximal repeat, super maximal repeat, near super maximal repeat and repeat alphabet, we define multiple feature sets.
6
R.P.J.C.Bose and Wil van der Aalst
1. Maximal Repeat Feature Set (MR): In this feature set, the features are based on the maximal repeats in the entire log. This can be discovered by concatenating all the traces in the event log (with a distinguishing delimiter between the traces) and identifying the maximal repeats in this concatenated sequence. From these maximal repeats, we filter those repeats that are activities themselves. The presence of repeats that are activities generates the scenario of the bag-of-activities approach and its pitfalls are discussed in [4]. In other words, MR = {r | r is a maximal repeat ∧ |r| > 1} 2. Super Maximal Repeat Feature Set (SMR): In this feature set, the features are based on the super maximal repeats present in the concatenated sequence of all traces in the event log. Similar to MR, super maximal repeats that are activities themselves are filtered out. SMR = {r | r is a super maximal repeat ∧ |r| > 1} 3. Near Super Maximal Repeat Feature Set (NSMR): In this feature set, the features are based on the near super maximal repeats present in the concatenated sequence of all traces in the event log. Similar to MR, near super maximal repeats that are activities themselves are filtered out. NSMR = {r | r is a near super maximal repeat ∧ |r| > 1} 4. Maximal Repeat Alphabet Feature Set (MRA): This is a feature set derived from MR. The features of this set correspond to the repeat alphabets of the event log where the repeats are the filtered maximal repeats in the entire event log (as in MR). MRA = {Γ (r) | r ∈ MR} 5. Super Maximal Repeat Alphabet Feature Set (SMRA): This is a feature set derived from SMR. The features correspond to the repeat alphabets of the event log where the repeats are the filtered super maximal repeats in the entire event log (as in SMR). SMRA = {Γ (r) | r ∈ SMR} 6. Near Super Maximal Repeat Alphabet Feature Set (NSMRA): This is a feature set derived from NSMR. The features correspond to the repeat alphabets of the event log where the repeats are the filtered near super maximal repeats in the entire event log (as in NSMR). NSMRA = {Γ (r) | r ∈ NSMR} For feature sets MR, SMR, NSMR, each trace is transformed into a vector whose values correspond to the number of occurrences of each feature in that trace. For feature sets MRA, SMRA, NSMRA, each trace is transformed into a vector whose values correspond to the sum of occurrences of all repeats that are under the equivalence class of the repeat alphabet.
Trace Clustering based on Conserved Patterns
7
2.3 Reducing the Number of Features Large data sets and data sets with a large alphabet might contain many repeats. But not all of them might be significant. For example, there might be repeats which occurs only in a small fraction of traces. One way to tackle this is to filter the repeats. One can retain only those repeats that are contained in a large fraction of traces in the event log, i.e., repeats that have a high support in the event log. 2.4 Approaches for Discovering The Feature Sets Maximal, super maximal and near super maximal repeats can be efficiently discovered in linear time using suffix trees for strings [5], [6]. Repeats that exist across the traces in the event log can be determined by applying the repeat identification algorithms on the sequence obtained by concatenating the traces in the event log with a delimiter not present in the alphabet A. Such a concatenation of traces might yield a very long sequence. One can adopt efficient suffix-tree construction techniques such as [7] to handle very long sequences. We have adopted Ukkonen’s algorithm [8] for the construction of suffix-trees in linear-time.
3 Evaluating the Significance of Clusters: A Process Mining Perspective Statistical metrics such as the average cluster density, silhouette width etc., have been proposed in the literature to evaluate the goodness of the clusters [9]. The underlying motive for all these metrics is to prefer clusters that are compact. Compact clusters have a lot of significance in pattern classification where the objective is to enable the discovery of decision boundaries. The objective for clustering event logs is to ease the discovery of process models by grouping together traces that conform to similar execution patterns/behavior. To evaluate the significance of the clusters formed, one can compare the process models that are discovered from the traces within each cluster. In this paper, we propose two hypotheses to evaluate the goodness of clusters from a process mining point of view. A good cluster tends to cluster traces such that: 1. the discovered process model has a high fitness 2. the process model mined is less complex The rationale behind these evaluation criteria is that if the clusters formed are meaningful (all traces belonging to related cases are in the same cluster and traces that are unrelated are not), then the process model resulting from the traces in a particular cluster should be less complex (more comprehensible and less spaghetti like). Algorithm 1 depicts the evaluation approach. Algorithm 1 is run over various clustering criteria/techniques and choice of cluster size. For the experiments in this paper, we have generated the process models with
8
R.P.J.C.Bose and Wil van der Aalst
Algorithm 1 Evaluating the significance of clusters Require: Given an event log L consisting of M traces, and a clustering algorithm C Ensure: Partition the M traces into N -clusters (for some N ≥ 2) using C 1: Discover the process model Pi for each cluster, Ci , 1 ≤ i ≤ N 2: Evaluate the fitness of the process models Pi 3: Evaluate the complexity of the process models. The number of control-flows, and/xor joins/splits and the size of the model defined in terms of the nodes, transitions and arcs signify the complexity of a process model.
the Heuristics miner [10] plug-in in ProM1 and used the following metrics for comparison: – The average number of event classes per cluster: The intuition is that clustering should enable the partitioning of traces based on functionality and that the resulting clusters should have event classes pertaining only to those events that constitute the functionality. Good clusters tend to form clusters such that the number of event classes is minimal per cluster. – Weighted Average Improved Continuous Semantics: Improved continuous semantics metric (ICS) is a measure of fitness and is proposed in [10]. Let icsk denote the ICS of the process model mined from traces in cluster k and let nk denote the number of traces in cluster k. Then, weighted average improved N N X X continuous semantics metric can be defined as wicsavg = (nk ∗ icsk )/ nk k=1
k=1
where N is the number of clusters. – Average Number of Arcs: This metric is a measure of spaghetti-ness of the process model and measures the average number of arcs per cluster. – Average Number of Arcs Per Node: This metric is a measure of spaghetti-ness of the process model and is defined as the average of the number of arcs per N X node over all the clusters. In other words, apnavg = apnk /N where apnk is the number of arcs per node in cluster k.
k=1
We evaluated different clustering strategies. We applied the Euclidean distance metric on the following feature sets in the vector space model: bag-of-activities (BOA), MR, SMR, NSMR, MRA, SMRA and NSMRA. In the syntactic domain, we studied the Levenshtein distance (LED) and generic edit distance (GED). In all the above strategies, we have used the Agglomerative Hierarchical Clustering technique with minimum variance criteria [11] as the clustering algorithm. 1
ProM is an extensible framework that provides a comprehensive set of tools/plugins for the discovery and analysis of process models from event logs. See www. processmining.org for more information and to download ProM.
Trace Clustering based on Conserved Patterns
9
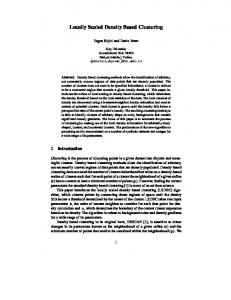
4 Experimental Results and Discussion Description of the Data Set: We used a real-life case study of Philips Healthcare logs. Philips Healthcare collates logs from their medical systems across the globe. These logs contain information about user actions, system events etc. Medical systems are huge machines with thousands of (sub-)parts and with many things happening in parallel. This compounded by the fact that the logging of events from these parts is distributed in nature makes the logs very complex for analysis. The specific log that we analyzed contains the commands (pertaining to beam limitation, fluroscopy/exposure procedures, table movement, image processing, etc.) that were executed on the system during an examination. The sequence of commands that were executed on an X-ray system during a patient examination on a particular day constitute a trace. We randomly picked 331 traces for our analysis. The traces vary between 100 and 200 in length and there were a total of 46716 events and 155 event classes (|A| = 155) in the log. It is important to note that the log is rather complex and that there is a large activity set. Let us call this log as the original log. As the log contains information about commands that were executed on an X-ray system, there are instances where a functionality is repeatedly invoked (signifying loop constructs). We have considered a variant of the original log wherein we have replaced all loop manifestations with just a single iteration over the loop. Let us call this log as filtered log. For example, consider the trace abcdbcdbcde; there exists three iterations of the loop over bcd in the trace. This trace would be replaced as abcde in the filtered log. In the filtered log, there were a total of 26865 events and 155 event classes. For the results reported in this section, we have partitioned the logs into four clusters. The goodness of the process models mined from Heuristics miner plugin is dependent on a few parameters (such as the number of positive observations, dependency threshold, relative to best threshold etc). Choosing an ideal set of parameter values is non-trivial and should depend on the characteristics of the dataset. A constant or a default value does not always work. Further when the event log is clustered, the resulting clusters can have different characteristics (the number of traces/events in each cluster can be different). We have experimented with both default/constant parameter settings as well as with parameter settings that are based on the characteristics of the dataset. This particular dataset is quite complex in that there are a few commands or a sequence of commands that can be repeatedly invoked and that there is less strict ordering on the commands pertaining to an abstract functionality. As a heuristic, we have used the following settings: number of positive observations equal to 3*number of process instances, relative-to-best threshold = 0.05, dependency threshold = 0.9, lengthone/length-two loop threshold = 0.9 and long-distance threshold = 0.9. Figure 2(a) depicts the weighted average improved continuous semantics value of the mined process models over different cluster strategies on the original log. It can be seen that the proposed feature sets perform better than the others. The value for the super maximal repeats is low because as per the definition, super
10
R.P.J.C.Bose and Wil van der Aalst
maximal repeats capture only the maximum functionality. This log has a lot of loop constructs and the super maximal repeat will capture only the loop manifestation with maximum iterations as a feature ignoring other manifestations of the loop. For example, if there is a loop over ab and if there are ababab and abab as two manifestations of the loop in the log and if ababab occurs in more than one trace, then only the sequence ababab is considered as a feature. Figure 2(b) depicts the average number of event classes per cluster for both the original and filtered log. It can be seen that the pattern based features perform better than the other approaches. Even within the pattern based features, the super maximal repeat based feature sets perform better because they capture the maximal functionalities and traces sharing the maximal functionality are put in the same cluster. Figure 3(a) depicts the average number of arcs per cluster for the different cluster strategies while Figure 3(b) depicts the average number of arcs per node. Again it can be noted that the the pattern based feature sets are able to cluster traces such that the overall spaghetti-ness of the process models is less compared to BOA, GED and LED approaches. The peak in Figure 3(b) for the SMR feature set can be attributed to the relatively low number of event classes per cluster for this cluster strategy. To summarize, the pattern-based feature sets are able to partition the traces better such that the process models mined from the clustered traces show a high degree of fitness at a relatively less structural complexity thereby enhancing the comprehensibility of process models. Figure 1 depicts the process models mined on the entire original log and from traces in three of the clusters of the original log. 105
Original
100
0.56
95
Avg. No. Event Classes
Weighted Average ICS
0.6 0.58
0.54 0.52 0.5
Original
Filtered
90 85 80 75
0.48 70 0.46 BOA
LED
GED
MR
MRA
SMR
SMRA
Cluster Strategy
(a) Weighted Avg. ICS
NSMR
NSMRA
65 BOA
LED
GED
MR
MRA
SMR
SMRA
NSMR
NSMRA
Cluster Strategy
(b) Average No. Event Classes
Fig. 2. Weighted average improved continuous semantics and average number of event classes of the process models mined from the clustered traces
5 Related Work Data clustering is one of the most important fields of data mining and a lot of techniques exist in the literature [12]. There is a growing interest in process mining and many case studies have been performed to show the applicability of process mining e.g., [13]. The significance of trace clustering to process mining has been discussed in [14], [15]. Greco et al. [14] used trace clustering to partition the event log and this way discovered more simple process models. They used
Trace Clustering based on Conserved Patterns 450
Original
5
Filtered
Filtered
4.5
Avg. No. Arcs Per Node
400
Avg. Number of Arcs
Original
11
350
300
4
3.5
3
250 2.5 200 BOA
LED
GED
MR
MRA
SMR
SMRA
Cluster Strategy
(a) Average number of arcs
NSMR
NSMRA
2 BOA
LED
GED
MR
MRA
SMR
SMRA
NSMR
NSMRA
Cluster Strategy
(b) Average number of arcs per node
Fig. 3. Average number of arcs and average number of arcs per node of the process models mined from the clustered traces
the vector space model over the activities and their transitions to make clusters. More specifically, Greco et al. [14] considered significant k-grams (subsequences of activities whose frequency is above a threshold) of different lengths for clustering. Transitions can be considered as a specific case of the k-gram model where the value of k is 2. On similar lines, Song et al. [2] have proposed the idea of clustering traces by considering a combination of different perspectives of the traces (such as activities, transitions, data, performance etc.) as the feature vector. For the activities and transition perspectives, this approach can be thought of as a combination of the bag-of-activities and the k-gram approach (with k = 2). Though this combined approach might yield better results than either of the approaches in isolation, it still suffers from the pitfalls highlighted as in [4]. We have proposed a generic edit distance based approach to trace clustering in [4]. Distances on other perspectives (such as data, performance etc) can be seamlessly combined with the feature sets proposed in this paper just like in [2]. This helps in further boosting the results of process mining algorithms by leveraging the superior performance of the pattern-based features. A comprehensive list of metrics that influence the comprehensibility of process models was reported in [16].
6 Conclusions In this paper, we have proposed multiple feature sets for trace clustering. The goal of clustering is to be able to generate several simpler models each explaining a coherent group of process instances. This way one can avoid spaghetti-like processes that mix very difference instances. The feature sets used are all based on conserved patterns. The proposed feature sets show good promise in identifying coherent cases. It was shown over a real-life log that the proposed clustering approach outperforms contemporary approaches to trace clustering in process mining. We have used the heuristics miner algorithm to evaluate the goodness of clusters. However, there is a bias associated with a mining algorithm over the class of process models that it can generate and thereby the evaluation metrics. Further, the parameters on which a mining algorithm depends on influence the end result. So far, little research has been done in this area. As future work,
12
R.P.J.C.Bose and Wil van der Aalst
we would like to investigate the influence (bias) of a mining algorithm on the evaluation criteria. Acknowledgments: The authors are grateful to Philips Healthcare for funding the research in process mining.
References 1. van der Aalst, W.M.P., and Weijters, A.J.M.M., and Maruster, L.: Workflow Mining: Discovering Process Models from Event Logs. IEEE Trans. Knowl. Data Eng. 16(9), 1128–1142 (2004) 2. Song, M., and Gunther, C.W., and van der Aalst, W.M.P.: Trace Clustering in Process Mining, BPM Workshops. (2008) (to appear in LNBIP) 3. Song, M., and Gunther, C.W., and van der Aalst, W.M.P.: Improving Process Mining with Trace Clustering. J. Korean Inst of Industrial Engineers. 34(4) 460–469 (2008) 4. Jagadeesh Chandra Bose, R.P., and van der Aalst, W.M.P.: Context Aware Trace Clustering: Towards Improving Process Mining Results. Proceedings of the SIAM International Conference on Data Mining, SDM. 401–412 (2009) 5. Gusfield, D: Algorithms on Strings, Trees, and Sequences: Computer Science and Computational Biology. (1997) 6. Kolpakov., and Kucherov: Finding Maximal Repetitions in a Word in Linear Time. FOCS: IEEE Symposium on Foundations of Computer Science (FOCS). (1999) 7. Cheung, C.F., and Yu, J.X., and Lu, H.: Constructing Suffix Tree for Gigabyte Sequences with Megabyte Memory. IEEE Trans. Knowl. Data Eng. 17(1), 90–105 (2005) 8. Ukkonen, E.: On-Line Construction of Suffix Trees. Algorithmica. 14(3) 249–260 (1995) 9. Rao, S., and Rodriguez, A., and Benson, G.: Evaluating distance functions for clustering tandem repeats. Genome Informatics. 16(1), 3–12 (2005) 10. Weijters, A.J.M.M., and van der Aalst, W.M.P.: Rediscovering workflow models from event-based data using Little Thumb. Integrated Computer-Aided Engineering. 10(2) 151–162 (2003) 11. Ward, J.H.: Hierarchical Grouping to Optimize an Objective Function. J. Amer. Stat. Assoc. 58, 236–244 (1963) 12. Jain, A. K., and Dubes, R.C.: Algorithms for Clustering Data. Prentice-Hall Inc. (1988) 13. van der Aalst, W.M.P., and Reijers, H.A., and Weijters, A.J.M.M., and van Dongen, B.F., and de Medeiros, A.K.A., and Song, M., and Verbeek, H.M.W.: Business Process Mining: An Industrial Application. Info. Sys. 32(5) 713–732 (2007) 14. Greco, G., and Guzzo, A., and Pontieri, L., and Sacca, D.: Discovering Expressive Process Models by Clustering Log Traces. IEEE Trans. Knowl. Data Eng. 1010–1027 (2006) 15. de Medeiros, A.K.A., and Guzzo, A., and Greco, G., and van der Aalst, W.M.P., and Weijters, A.J.M.M., and van Dongen, B.F., and Sacca, D.: Process Mining Based on Clustering: A Quest for Precision. BPM Workshops 17–29 (2007) 16. Mendling, J., and Strembeck, M.: Influence Factors of Understanding Business Process Models. BIS. 142–153 (2008) 17. Mendling, J., and Neumann, G., and van der Aalst, W.M.P.: Understanding the Occurrence of Errors in Process Models Based on Metrics. OTM Conferences 1 113–130 (2007)