Sep 23, 2007 - it comes to legacy code because they are often harder to understand. Third, coding the reverse queries/functions en- tails non-trivial efforts, ...
Tracing Lineage Beyond Relational Operators Mingwu Zhang† Xiangyu Zhang† Xiang Zhang‡ Sunil Prabhakar† †Department
of Computer Sciences ‡Bindley Bioscience Center Purdue University Purdue University West Lafayette, Indiana, USA West Lafayette, Indiana, USA {mzhang2, xyzhang, sunil}@cs.purdue.edu {zhang100}@purdue.edu ABSTRACT Tracing the lineage of data is an important requirement for establishing the quality and validity of data. Recently, the problem of data provenance has been increasingly addressed in database research. Earlier work has been limited to the lineage of data as it is manipulated using relational operations within an RDBMS. While this captures a very important aspect of scientific data processing, the existing work is incapable of handling the equally important, and prevalent, cases where the data is processed by non-relational operations. This is particularly common in scientific data where sophisticated processing is achieved by programs that are not part of a DBMS. The problem of tracking lineage when non-relational operators are used to process the data is particularly challenging since there is potentially no constraint on the nature of the processing. In this paper we propose a novel technique that overcomes this significant barrier and enables the tracing of lineage of data generated by an arbitrary function. Our technique works directly with the executable code of the function and does not require any high-level description of the function or even the source code. We establish the feasibility of our approach on a typical application and demonstrate that the technique is able to discern the correct lineage. Furthermore, it is shown that the method can help identify limitations in the function itself.
1.
INTRODUCTION
With the advance of high-throughput experimental technology, scientists are tackling large scale experiments and producing enormous amounts of data. Web technology allows scientists to collaborate and share data – further increasing the amount of available data. To increase the usability of this data, it is essential to know the provenance of the data – how was it generated, using what tools, what parameters were used, etc. This information is often termed Provenance or Lineage of the data. Lineage information can be used to estimate the quality, reliability, and appliPermission to copy without fee all or part of this material is granted provided that the copies are not made or distributed for direct commercial advantage, the VLDB copyright notice and the title of the publication and its date appear, and notice is given that copying is by permission of the Very Large Data Base Endowment. To copy otherwise, or to republish, to post on servers or to redistribute to lists, requires a fee and/or special permission from the publisher, ACM. VLDB ‘07, September 23-28, 2007, Vienna, Austria. Copyright 2007 VLDB Endowment, ACM 978-1-59593-649-3/07/09.
cability of data to a given task. An important aspect of data provenance is Relationship [24], which has been defined as “Information on how one data item in a process relates to another.” Despite the importance of these relationships between input and output data, acquiring them remains a challenge which has not been addressed by the existing work [18, 24]. Lineage can be categorized into coarse-grained lineage and fine-grained lineage. Coarse-grained lineage records the procedures used to transform the data, the parameters used, the general description of the input and output data. Coarse grained lineage is also referred to as work-flow in literature. To improve scientific collaboration, Workflow Management System(WMSF) and Grid computation are used to simplify access to computational resources and experimental results over distributed systems[16, 15, 25, 12]. Many prototype systems such as Chimera[12], M y Grid[25], and Geo-Opera [8] have been developed. There is a subtle difference between workflow and lineage. Workflow defines a plan for desired processing before it actually happens. Lineage, on the other hand, describes the relationship between data products and data transformations after processing has occurred. Coarsegrained lineage is useful in many applications. However, applications such as the scientific computations in [26, 22] require fine-grained lineage. Coarse-grained lineage is insufficient since detailed information of how individual output elements are derived from a certain subset of input elements is desired. Fine-grained lineage, which records the individual data items in the input used to produce a data item in the output, provides the necessary details. Lineage tracing in the context of database systems has been extensively studied [13, 11, 14]. These algorithms can only trace fine-grained lineage when the data is produced by relational operators within a DBMS. Consequently, they cannot be applied to tracing data lineage when nonrelational operators are employed as is often the case with scientific applications. For example, a workflow may involve programs maintained and distributed at different research groups, but shared within the grid. The program could be an executable or a web service implementing an arbitrary function that the user knows little about. Even though the data may be stored in a database, the program used to derive the data usually resides outside the database, or at best as a stored procedure. To the best of our knowledge, there is currently no technique that enables lineage tracing for these “black box” functions. A similar challenge is also seen in data mining and data cleansing applications. For many applications, data clean-
ing is an important first step. It has been reported that the data cleaning procedure takes more than half the total time in the construction of a data warehouse. Extensive research has been conducted on how to resolve inconsistencies and missing values in the data. However, after the data is cleaned and stored in the database, the information of how the data is cleaned is not stored in the database and is lost forever. For example, the missing value could be replaced by a most likely value or derived from a model, but once the data has made it to the database, this data is treated as if it is the real data. In many cases, the data used to replace the missing value may be incorrect. It is important to maintain this information if one has doubts about the data. Since the data cleaning procedures are usually performed by a program without relational semantics, it is difficult to obtain this information. Despite the importance of the problem, there has been very limited work that has addressed the problem of tracing lineage when arbitrary functions are used – this is largely due to the difficulty of the problem. In [26], Wooddruff and Stonebraker use reverse functions to compute the mappings from output to input. A reverse function returns the set of input data that is used to generate a given output data item. When a reverse function is not available, a weak reverse function is used to compute a set of input that is a superset or subset of the data used to compute the output. A verification function is also used to refine the set. Marathe [22] apply rewrite rules to AML (Array Manipulation Language) expression in order to trace fine-grained lineage for array data. This lineage, however, may contain false positives. These solutions have been shown to be effective in certain scenarios. However, they have their inherent limitations. First, reversibility is not a universal characteristic of data processing queries/functions. Even when a weak reverse function can be found, it will not be very useful if the exact data items can not be identified. Second, in order to design reverse queries/functions, a comprehensive understanding of the data processing procedures is a pre-requisite, which makes the solutions application-specific and hard to automate. The situation becomes worse when it comes to legacy code because they are often harder to understand. Third, coding the reverse queries/functions entails non-trivial efforts, which thwart the application of these techniques. To the best of our knowledge, there is no existing work that is able to automatically infer the connections between input and output for arbitrary functions. In this paper, we propose the first such technique. The key idea of our technique is the observation that the program binary that implements the function is a valuable source of information that connects the input and output. Therefore, tracing program executions reveals how output is derived from input. While this is a very promising direction, the design and implementation is non-trivial. In this paper, we take advantage of recent advances in dynamic program analysis and propose fine grained lineage tracing through dynamic program slicing. Dynamic program slicing is a technique originally designed to debug program errors. Given an executable, dynamic program slicing is able to trace the set of statements that have been involved in computing a specific value at a particular execution point, thus helping the programmer to find the bug. Using dynamic program slicing to trace fine-grained lineage has many immediate advan-
tages: it is a completely automated general solution and does not require any user input or domain expertise on the data processing functions; it can simply work on compiled binaries without access to the source code, and the traced fine grained lineage is accurate. The only barrier to realizing this intuitive idea is the cost. Fortunately, recent progress in program tracing, especially in dynamic program slicing, enables tracing fine grained lineage with reasonable cost. It is worth pointing out that part of the overhead of our system stems from the underlying dynamic program analysis engine which is based on a single-core machine and not highly optimized. As a result, it is usually several times slower than an industry-strength engine. Even in the absence of support from a more efficient engine, the contribution of this paper is significant since it provides a new functionality that is currently not available. For most applications that require lineage information – the availability of the information is more crucial than the runtime cost of computing it. At the same time, it is a simple matter to support rapid query processing without lineage tracing while at the same time having a separate, slower computation that generates the lineage information in the background. In this fashion, query results are available immediately while the lineage information is generated a little later. We show in this paper, that even though lineage tracing is slower than query processing, it remains at acceptable levels for all the applications that we have considered – we are certain that this is a price that these applications are willing to pay for obtaining valuable lineage information that has not been available earlier. This is strongly supported by our experiments. Overall, this paper makes the following contributions: • We develop the first fine-grained lineage tracing algorithm that can be applied to any arbitrary function without human input or access to source code. We describe how the ideas of dynamic slicing for debugging programs are adapted to provide fine-grained lineage. • We implement the system and apply it to real applications. Our experiments show that the overhead is acceptable. Our case study demonstrates that the traced fine grained lineage information is highly effective and greatly benefits a biologist in analyzing and understanding the results.
2. RELATED WORK Provenance, or lineage, has been extensively studied in the context of scientific computation such as datasets on the grid. One form of provenance is workflow or coarsegrained provenance. For some applications, coarse-grained (i.e., table or file level) lineage is sufficient because typically all elements in the same file or table have undergone the same computational process. Also, the lineage is used to trace the source of abnormality in the data or for data dissemination (i.e., a description of the derivation process is disseminated along with the base data). [12] surveys the use of workflows in scientific computation. In scientific databases, for example biological databases, coarse-grained lineage is insufficient since not all data values are processed similarly. Although there is a strong need for tracing fine-grained lineage, it remains an unsolved problem. Recently, there has been increasing interest in this area. Cui et al. [14] propose fine-grained tracing in the context
MOTIVATION
of data warehousing where all data is produced using relational database queries. The notion of reverse queries that are automatically generated is presented in order to produce all tuples that participated in the computation of a given query. Woodruff and Stonebaker [26] support fine-grained lineage using inverse or weak inverse functions. That is, the dependence of a given result on base data is captured using a mathematical function. They adopt a lazy approach to compute fine-grained lineage upon request from the user. It is not clear if such functions can be identified for a given application. The identification task is highly non-trivial and makes the approach impractical. Similarly, the work on lineage tracing for array data [22] is only applicable in a very limited scenario where the high-level operations are written in Array Manipulation Language (AML). Buneman et al. [13] classified lineage into why lineage, which specifies why the data is derived, and where lineage, which specifies where the data is copied from. Bhagwat et al.[11] proposed three schemes to propagate annotations attached to attributes in relational data. Recently lineage information for relational operations has been used to correctly compute results for uncertain probabilistic databases [9]. This work does not identify new lineage tracing methods, but instead uses relation-operator lineage to correctly infer probabilistic data dependencies. Dynamic slicing [21] is a debugging technique that captures the executed statements that are involved in computation of a wrong value. Recent research has shown that dynamic slicing is quite effective in locating runtime software errors [29] and dynamic slices can be efficiently computed [28]. The data lineage tracing technique in this paper is based upon the concepts from dynamic slicing such as data/control dependences. Certain implementation techniques such as roBDD are also reused. The distinction between dynamic slicing and data lineage tracing lies in the information that is traced. In dynamic slicing, a set of executed statements are traced in order to assist programmers in debugging. In contrast, lineage computation traces the set of input that is relevant to a particular output value. A lineage set is usually much smaller than a dynamic slice, which leads to a much more efficient implementation. Furthermore, while control dependence is very crucial in dynamic slicing, it is less important in lineage tracing because data dependence is dominant. Overall we see that while tracing of fine-grained lineage with non-relational operations is critical for many applications, current solutions fall short of these requirements. To the best of our knowledge, ours is the first work to propose such a system and the only one that can support the types of queries discussed in Section 7 which are of direct relevance to scientists.
3.
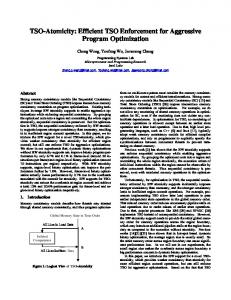
In this section we describe a motivating data processing application of non-relational data processing for which lineage tracing is both important and challenging. Liquid Chromatography Mass Spectrometry (LC-MS) is an effective technique used in protein biomarker discovery in cancer research [31, 30]. Figure 1 shows the various steps involved in LC-MS. A biomarker is a protein which undergoes changes in structure or concentration in diseased samples. Identified biomarkers can be used in diagnoses and drug design. To detect these biomarkers, proteins from cancer
!
Figure 1: An overview of the LC-MS process. patients and normal people are digested into smaller pieces called peptides. These two samples of peptides are “labeled” by attaching chemicals to them. The normal and diseased groups are distinguished by having different isotopes (same chemical structure but different molecular mass) in their labels. The labeled cancer and normal samples are then mixed in equal parts. An ionization process is used to attach charges to the peptides. Due to the nature of this process, different molecules of the same peptide can end up with different charges, thereby producing different m/z ratios. This mixture is then subjected to the LC-MS process. This process is only able to measure the ratio of molecular mass to the charge of the peptide. In an ideal situation, each peptide would produce two peaks – one corresponding to the normal peptide marked with a light label and a second corresponding to the cancer sample marked with a heavy label. These peaks would differ in mass by the difference in the label weights and are called a doublet. Unfortunately, the data from the spectrometer is not so clean. There are two main reasons (in addition to the difficulty of wet-bench experimentation) for this: charges and naturally occurring isotopes. The charge that gets attached to a given peptide is not fixed. Thus a peptide with mass m0 may show up at a m/z ratio of m0 , m0 /2, m0 /3, etc. depending upon its charge in the experiment. Furthermore, due to naturally occurring isotopes, different molecules of the same peptide may have different molecular mass and thereby results in a cluster of peaks, called isotopic peaks. 1 The mass difference between two adjacent isotopic peaks equals to 1Dalton. Assuming that isotopes 1 For example, Carbon atoms usually have an atomic weight of 12. However, there is usually a small fraction of Carbon atoms with weight 13 (and even fewer with weight 14). Depending upon the number of C 13 atoms in a given molecule, the overall molecular weight of that molecule may differ. Similarly Nitrogen, which is commonly found as N 14 , also has a less frequent isotope: N 15 . Thus depending upon the number and type of isotopes that make up a given molecule, we get multiple molecular weights for the same peptide. Note however, that the typical ratio of the occurrence of these isotopes is usually known.
'%$%#�# '%#%#�# &�$%#�# ) *-
=
+.
+,
)*
&�#%#�#
>@? 9
$�#%# #
ACB
:100) then OUTPUT=INPUT[1] print (OUTPUT)
The nature of this type of dependence is very close to that of control dependence and thus it is minor in lineage tracing. This is also confirmed by our experiments, in which we did not encounter any observable problems caused by missing this type of dependences. Finally, we want to point out that there exist expensive and conservative techniques to compute these invisible dependences [19].
5. IMPLEMENTATION We have implemented the lineage tracing prototype on the tool called Valgrind[2] which was originally designed for debugging memory errors in x86 binaries. The kernel of valgrind is a dynamic instrumentation engine which is capable of adding user specified code into the original binary. Therefore, when the original code is executed, the corresponding
Table 1: Computation of data lineage. si
tj
def
use0
40 50 60
40 40
T
M [0] P T
φ 50
M [0]
φ
70
60
P
P
φ
M [0]
φ
41 51 61
41 41
T
M [1] P T
φ 51
M [1]
φ
100
61
P
P
70
T
51
P
100
42 140
DEF (use0 )
use1
DEF (use1 )
| m }�h v�w%xzy f g�i�p q
J�K�L M(NPO QSRUT�V N QWV�L
f g lb{�o
f g�n�o pP{ ~zh`g%o h�} | m }�h h�4h`g%o
m�{�o lb{�o
eSf g�h`i4j"h kbh lbm n`f o m�p q
X Y%Z [ \ ]�^1_�Y [ _`\
ab]%Y [ c ^d_
y }�}
\ r�sbtut
f g�h�i4j"h
Figure 5: Slicing Infrastructure. added code, which is also called instrumented code, is executed as well. While previously the instrumentation had the goal of debugging, the valgrind tool can be easily extended by replacing the instrumenter. Figure 5 illustrates the architecture of our prototype. The valgrind engine takes a x86 binary and executes it with the provided input. The engine calls our instrumenter when it is about to execute a piece of code. Our instrumenter adds our own code and returns a new piece of instrumented code, to the engine to execute. The execution of the instrumented code will result in calling functions provided in the runtime component, which perform certain operations based on the semantic of the original code in order to propagate and update the lineage information. The roBDD component computes and stores lineage sets. More details about this component are discussed below. Eventually, the system produces both the regular output and the corresponding lineage information. Note that we chose to use valgrind because it is robust and open-source. However, an inherent limitation of valgrind is its speed. Simply executing a program on valgrind without any instrumentation may incur a 10x slowdown. There are industry tools such as dbt from Intel and valcun from Microsoft, with much lower overhead (as low as 50 percent). Unfortunately, those tools are not publicly available at present. Next, we discuss two implementation challenges. The Set Representation. From the earlier discussion, it is clear that lineage computation involves storing a large number of sets and performing set operations at each step of the execution. Therefore, the set representation is critical to performance. A naive link-list based implementation may end up traversing a large set, which may contain thousands of elements, for the execution of a single instruction. Fortunately, recent research on dynamic slicing [28] reveals that reduced ordered Binary Decision Diagram (roBDD) [1] can be used to achieve both space and time efficiency in
DL(def @si )/DL(si ) DL(40 ) = φ DL(T @50 ) = DL(P @50 ) ∪ DL(40 ) = {P } DL(60 ) = DL(T @50 ) ∪ DL(M [0]@60 ) ∪ DL(40 ) = {P, M [0]} DL(P @70 ) = DL(P @70 ) ∪ DL(M [0]@70 ) ∪DL(60 ) = {P, M [0]} DL(41 ) = φ DL(T @51 ) = DL(P @51 ) ∪ DL(41 ) = {P } DL(61 ) = DL(T @51 ) ∪ DL(M [1]@61 ) ∪ DL(41 ) = {P, M [1]} DL(P @100 ) = DL(P @70 ) ∪ DL(T @51 ) ∪DL(61 ) = {P, M [0], M [1]} DL(42 ) = φ DL(140 ) = DL(P @100 ) = {P, M [0], M [1]}
representing sets. RoBDD benefits us in the following respects. Each unique lineage set is represented by a unique integer, which can be considered as an index to the universal roBDD which stores all lineage sets. In other words, two sets are represented by the same integer number if and only if they are identical. The use of roBDD achieves space efficiency because it is tailored for set operations characteristic of lineage data such as duplicate removal, and handling overlapping and clustered sets. Set operations can be performed efficiently using roBDDs. More specifically, equivalence tests can be performed in O(1) time [23]. Other binary operations (e.g., union) on two sets whose roBDD representations contain n and m roBDD nodes can be performed in time O(n × m) [23]. Note that the number of roBDD nodes is often much smaller than the number of elements in the represented set. Binary Instrumentation. In order to trace lineage, we have to instrument the binary of the program such that lineage information is updated during program execution. According to Equation 1, we need to update the DL set of the left hand side variable at every step of the execution and store it somewhere. In our system, we use shadow space to store lineage sets. More specifically, if the variable is stored at a specific stack/heap location, a corresponding shadow memory (SM) is allocated and used to store the set associated with the variable. Similarly, we use a shadow register file (SRF) to store the sets for variables in registers. Both shadow memory and shadow registers are implemented by software. 1. 2. ... 10. 11.
register int sum; A = (int*) malloc (100); SM(A) = malloc in shadow(100); sum = sum + A[i]; SRF(sum) = SRF(sum) ∪ SM(A)[i]; ...
Figure 6: An Example of Instrumentation. Figure 6 shows an example of instrumentation, the instrumented code is in bold. We can see that an original memory allocation is instrumented with a corresponding memory allocation in the shadow space. An original operation in the program is instrumented with a set operation on the corresponding sets which are stored in the shadow space. Even though the example is at source code level, the real instrumentation is performed at binary level – without the need to access source code.
6.
STORING FINE-GRAINED LINEAGE
Through the use of our lineage tracing utility, it is now possible to automatically instrument any x86 binary so that it generates fine-grained lineage information for its output. This lineage information can be stored as part of the database in order to make it available for querying. To record fine-grained lineage, the individual data items must be uniquely identified. If the input is in a flat file, the data items in the file can be identified by the offset in the file and their data length. If the file is in a semi-structured format such as XML, then the scheme proposed in [13] can be used. If the data is in a DBMS, the data item can be identify based on its granularity. The granularity of lineage could be at table, tuple or attribute level. Table level lineage is equivalent to coarse-grained lineage, tuple- and attributelevel lineage are examples of fine-grained lineage. Our lineage tracing utility provides lineage at attribute level. Tuple level lineage information can be directly computed from the attribute level lineage. The lineage information can itself be stored in a table called Lineage. Table 2 shows an example of how the lineage information can be stored in a database. id
pid
level
from id
to id
Program id
1
318
1
(3,-,-)
(5,-,-)
De-Isotope
2
2122
1
(1,-,-)
(3,-,-)
Data cleaning
3
2122
2
(3,1,-)
(1,101,-)
-
4
318
3
(5,1,5)
(3,5,6)
-
5
318
3
(5,1,5)
(3,15,6)
-
Table 2: Lineage Table The id attribute is the primary key of the lineage table. The pid attribute is the identifier of the process that generated the data. The level attribute describes the level of the lineage, 1 is table level, 2 is tuple level and 3 is attribute level. From id and to id are two ids that describes that from id depends on to id. The program id attribute stores the id of the program used to generate the derived data. If the input data is in a database, the from id and to id are represented as a triplet (table id, tuple id, attribute id), the first number is the identifier of the table, the second number is the identifier of the tuple in the table and the third number identifies the attribute inside a table. For example, (3,-,-) means Table 3. (5,1,5) means Table 5, Tuple 1, Attribute 5. If the database provides the internal table and tuple identifiers, we could use these as the tuple id. In PostgreSQL, oid and tableoid columns are created when the table is created. The oid uniquely identifies the tuple in a table and tableoid identifies the table to which the tuple belongs. The order of attributes in the table can be used as the attribute id. If a key is defined on the table, the key can be used in place of the oid. For databases that do not provide the internal tuple identifier, extra tables can be implemented to manage the internal tuple identifier. Further details on how fine-grained lineage can be managed in a RDBMS are discussed in our technical report [27].
7.
EXPERIMENTAL RESULTS
In this section, we present an experimental evaluation of the proposed approach using several real applications. Two sets of experiments are presented. To demonstrate
the validity of our approach and highlight the importance of fine-grained lineage, we consider the LC-MS application discussed earlier. The second set of experiments is conducted on a range of applications including data mining, data cleansing, and image processing. These experiments are used to study the performance of our technique. The LC-MS application uses real data from a cancer study and was conducted in collaboration with domain experts. This application is highly sensitive to incorrect (even approximate) lineage and obtaining accurate lineage information is not possible with existing techniques. The experiments below establish the feasibility of our approach and also demonstrate that although there is a distinct slowdown due to lineage tracing, it is not crippling. It should be noted, as mentioned earlier, that for many applications the availability of correct lineage information is far more important than rapid query execution. Even when rapid query processing is necessary, it is possible to compute answers quickly without tracing lineage and later provide lineage information by repeating the query with lineage tracing. In fact, our experiments lead to the improvement of the de-isotoping results and identification of limitations of the current algorithm. These results in themselves were very exciting for our collaborators, which further corroborates the value of having fine-grained lineage (even if it is a little slow to compute). We use actual mass spectrometer output from a real experiment as input data for our tests. The biological samples were acquired from normal mice and mice bearing breast cancer. The mass difference between normal and cancer labels is 3Da. The code used to process the LC-MS data was obtained from [30]. The experiments are conducted on a machine with 2.40GHz Pentium 4 CPU and 1GB memory running GNU Linux.
7.1 De-isotope Results As discussed in Section 3 the key goal of biomarker discovery is to identify peptides that show a marked difference in cancer specimens as opposed to normal specimens. Due to the nature of the application, false positives are often produced. These can lead to expensive and fruitless followup research and thus should be eliminated if possible. A key requirement in establishing the validity of a potential biomarker is being able to trace back from the result to the peaks that contribute to this final result. Currently, since fine-grained lineage information is not maintained, this is often done manually and approximately. In the following experiments we show how our technique is able to provide the correct fine-grained lineage in order to rule out false positives from a real experiment. Also, we show that the availability of fine-grained lineage can help identify limitations of the de-isotope algorithm.
7.1.1
Doublet Quantification
Figure 7 (a) shows a portion of a MS spectrum from a real experiment. The de-isotope step identifies 4 peaks, each with charge 4 as shown in Figure 7(b). The peaks in Figure 7(a) are broken up to show their contribution to the final computed peaks in Figure 7(b). These can form two doublets: (P σ , P υ ) and (P τ , P ϕ ). However, it turns out that this result is surprising since it implies an unusually large peptide2 . The availability of fine-grained lineage generated 2
Since the charges for these peaks are 4, the peptide that
»P·¶
¢ ¥
¡
¢ ¡¤£
ºP¶¶
``
¹P·¶
°±
¹P¶¶
P
P
P
¨ª©¬«
¾ ©W«
¸ ¶¶
P
¿ ©¬«
¸ ·¶
P
²° µ ² ±´³
¦
ºP·¶
À�©W«
»P¶¶
§
·P¶
P
¶
PP
¸ »P·¶
¸ »P·�¸
¸ »P·P¹
¸ »·Pº
S
(a) × ÔÒ
ÖÒ
Þß
ÕÒ
à áßâ
× ÔPØÒ
Â
È Â�É Â�Ê
× ÔØ�×
× ÔPØÓ
× ÔPØÙ
ùP÷ö
ðñ
ùPöö
ø û÷P÷
ø û÷Pü
ø ûP÷ý
ê%ç7è¬é
ø ÷ö Ñ Â å
× ÔPØPÔ
ðò õ ò óñô Ð Â
Ç Â
ä Â
ÓÒ
Ï Â
ËSÂ
ë ç�è¬é
úPöö
Å Â
ÁWÂ
¸ »P·½
úP÷ö Î(Â
Æ�Â
ÔÒ
Ò
Ì Â�Í
Ä� à Â
¸ »·P¼
æbç�è¬é
ûPöö Â
× ÓÒ
Þà ã
¸ »·P·
(b) ûP÷ö
× ÒÒ
¸ »P·P» "® ¯
× ÔPØØ
ì ç�è¬é
ø öö Â
÷Pö
× ÔPØ Õ
ö
× ÔPØ Ú
ø ûP÷ö
ø ûP÷�ø
ø ûP÷Pù
ø û÷Pú
Û7Ü Ý
ø ûP÷Pû í"î ï
(c)
(d)
Figure 7: Example showing doublet quantification it turns out that the domain experts were satisfied with the lineage. The new lineage information is shown below. In 0 particular, the likelihood that P σ is correct is high since all six isotopic peaks have been identified.
by our method makes it possible to explore this further. The lineage for these peaks is as follows: DL(P σ ) ={P α , P β } DL(P τ ) ={P α , P γ , P δ , P ε , P ζ , P η , P θ , P ι } υ
κ
λ
µ
ν
DL(P ) ={P , P , P , P }
ϕ
0
0
0
0
0
0
0
ϕ0
ι0
0
0
0
0
0
0
0
λ0
µ0
ν0
0
0
DL(P σ0 ) ={P β , P γ , P δ , P ε , P ζ , P η , P θ } κ
ξ
o
π
ρ
ς
DL(P ) = {P , P , P , P , P , P }
From this information, we discover that the m/z difference between the isotopic peaks is approximately 0.33. This implies that the charge should be 3 instead of 4. Obviously there is something wrong. After investigation, we found out that the scientists had inadvertently used an incorrect parameter for the mass accuracy when running the de-isotope function. With the help of the fine-grained lineage we were able to correct this value and set it to a more appropriate value. We ran the function again with the new value. The new results are shown in Figure 7 (c) and 7 (d), this time the program correctly assigned 4 peaks with charge 3. There are two doublets :(P σ0 , P υ0 ) and (P τ 0 , P ϕ0 ). The intensity ratio between P σ0 , P υ0 is 1.45:1, while the intensity ratio between P τ 0 , P ϕ0 is 1.57:1. These results are promising since the normal ratio is 1:1. Thus, these doublets could potentially be biomarkers of interest. However, before investing more money and effort in investigating these potential biomarkers, it is important to have high confidence that the ratio is correct. The lineage information can once again help establish the confidence in these ratios. In this case, produces the doublet (P σ , P υ ) has to contain 3 occurrences of the amino acid Lysine(K) and the peptide that produces the doublet (P τ , P ϕ ) should contain 4 occurrences of Lysine(K). While the occurrence of 3 or 4 Lysine(K) is possible, it is very unlikely.
DL(P τ ) ={P ι , P κ } DL(P υ ) ={P ι , P λ , P o , P π , P ρ } DL(P
) ={P
,P
,P
,P
,P
ξ0
}
7.1.2 Identifying False Positives The availability of fine-grained lineage can help improve the quality of the results generated by the de-isotope procedure. Figure 8 shows the results from an experiment that provides an example of this aspect. Figure 8 (a) shows a relatively clean raw spectrum. Figure 8 (b) shows the output of the de-isotope function on this input data. The program detects 4 peaks, which form two doublets (P θ , P κ ) and (P ι , P λ ). The intensity ratio of doublet (P θ , P κ ) is 0.78 and that of doublet (P ι , P λ ) is 1.45. The intensity ratio of doublet (P θ , P κ ) may be within experiment variation, while doublet (P ι , P λ ) could be a potential biomarker. The fine-grained lineage reveals that it is very likely that doublet (P ι , P λ ) is a false positive. This is indicated by the fact that peak P λ is not an independent peak, but just a vestige of another peak (P κ ) that was produced as a result of the limitations of the de-isotope procedure. This determination is not possible unless we are able to determine the fine-grained lineage. The following is the fine grained lineage of the two doublets in Figure 8 (b).
�� � � �� ��
�
�SÿW7þSþ
% !��
�SþW7þSþ
% ��
�¬ÿW7þSþ
$�!��
�¬þW7þSþ �
(ÿW 7þSþ
1 032
/0 �
�
(þW 7þSþ
4
5
$��� "#!�� "#��
� �
SþS ÿ¬ 7þ þ
/1 �
�
�
!��
�
� ������
�� ��
��� � �
�
���W7ÿ
�����
&�'(&
�)* &� �"
& )�% +-, .
(a)
&�)�!
&�)�)
(b)
Figure 8: Spectra showing an example of false positive identification.
DL(P θ ) ={P α } κ
α
β
δ
ζ
η
DL(P ) ={P , P , P , P , P } P
λ
Pυ = Pα + Pβ + Pγ
DL(P ι ) ={P α , P β }
ε
δ
=P − c0 · (P −
c01
λ
α
β
δ
ε
DL(P ) ={P , P , P , P } · (P
β
−
c00 0
α
· P ))
The main peak P ε in the lineage set of P λ , which is identified by having the same m/z value as P λ , has a much higher intensity than P λ , which is highly unlikely. Our further inspection shows that the comparison at the line 6 of algorithm 1 decides that the computation of P κ takes the else branch such that a major portion of intensity is subtracted from P ε , and the remaining intensity constructs the peak of P λ . However, the T value at line 6 is not necessarily accurate depending on the constant H[P.M W, i], which is calculated by sampling a large database of proteins. The error of the sampling procedure is 5%. This particular peptide very likely falls into this 5%. If we add P ι to P θ and P λ to P κ , then the intensity ratio between P θ to P λ becomes 0.83 which is close enough to the normal ratio of 1:1 to be insignificant. This result itself was very exciting for our colleagues working on biomarker discovery. Figure 9 shows a more complicated situation where the program was not able to compute the correct answer which was discovered with the help of our fine-grained lineage. Figure 9 (b) is the result of de-isotope. P ψ and P ω are both charge 1 and we infer that P ψ and P ω are a doublet based on their m/z difference. P ψ is the light peptide from normal sample and P ω is the heavy peptide that came from a diseased mouse. After examining the fine-grained lineage information, ψ
η
ι
λ
ω
DL(P ) ={P , P , P }
DL(P ) =
η
o
ρ
σ
{P , P , P , P }
we are confident that P ψ and P ω are correct and they are indeed a doublet. On the other hand, P υ is suspicious because the program determines its charge to be 2. If we can pair P ϕ with P υ , they will form a doublet but P ϕ is charge 1. Note that the value is in m/z, if P υ is charge 2, its molecular weight would have to be 2101 which is far more than 1053.5 that P ϕ has, therefore P υ and P ϕ can not be a doublet. We turn to fine-grained lineage for help. υ
α
β
χ
θ
κ
γ
DL(P ) = {P , P , P } DL(P ) = {P , P }
ϕ
η
ψ
η
ν
DL(P ) = {P , P } DL(P ) = {P , P ι , P λ }
P υ is determined to be charge 2 because program included P β in its lineage. In fact, the charge of the P υ could be 1 or 2. If the charge of P υ is 1, as shown in Figure 9 (c), P Ω will be assigned charge 1 and appear in the result. P υ and P ψ could pair up and P Ω and P χ could pair up. We will have three doublets. On the other hand, if the charge of P υ is 2, as shown in Figure 9 (d), P υ and P χ pair up. Then we will have two doublets. The program uses heuristics to handle the situation when peptides and their isotopic peaks overlap. In this case, the heuristics fail to produce the correct result. By checking the lineage, we discover the limitations of the heuristics and two alternative interpretations of the raw MS data which are shown in Figures 9 (c) and (d).
7.2 Performance benchmark
original (sec.)
valgrind (sec.)
tracing (sec.)
tracing/ valgrind
auto-class
0.104
2.92
93.6
32.0
image processing
0.8
5.15
166.3
32.3
lemur
0.85
12.1
302.8
25.0
rainbow
2.22
19.6
286.6
14.6 12.4
apriori
2.06
20.7
257.4
deisotope
9.2
85.8
646.6
7.5
cluto
1.67
42
1670
39.7
Table 3: Running times for benchmark applications. We selected seven benchmark programs to evaluate the time and space overhead of the lineage tracing technique. Auto-class [4] is an unsupervised Bayesian classification system that seeks a maximum posterior probability classification. It takes a database of attribute vectors (cases) as input and produces a set of classes and the partial class memberships as output. The image processing program takes a cryo-EM image in tiff format and applies Fourier transformation [17] to the image. The low frequency noise is removed and then another Fourier transformation is performed to covert the image back to a visible form. We used a 512x512 tiff image as input. Lemur [5] is a toolkit designed to facilitate research in language modeling and information
hj m j ilk hi
S_R`R ^XR ]XR \XR [VR ZXR YVR WXR UVR STR R
S_Rc[bS
|_{`{ c{ c{ c{ `{ c{ `{ n o�q p ~c{ }`{ |a{ { |a{XV|
_cb
·a¶X¶ ¿X¶ ¾X¶ ½X¶ ¼V¶ »X¶ ºV¶ ®�¯ ¹X¶ ¸V¶ ·T¶ ¶ ·T¶c»b·
J
C @BA E
687:9 SaRXZbS
S_R`Z`W
STR`Z`Z
K
F8GIH dfe g
L
STRcZX\
STRXZc^
MONQP
(a)
¨¦ « ¨ ©§ª ¦§
aX ¡X X X V X V t X ¬ t V T Tcb _``
w �t
ÅÃ È Å ÄÇÆ
t zt
TcX
ÃÄ
¢¤£ ¥
_``
TcX¡
(c)
yzots r-ots u ots vwoxs
|T{cX~
|T{cX
*
|_{``
|T{cX
|T{T
|
(b) µw®t´ ° ®±¯ ²³®´
·_¶`»`¹
·T¶c»X»
ÀfÁ Â
·T¶c»X½
·_¶`»`¿
·T¶T¼
·
(d)
Figure 9: Example spectra highlighting de-isotope function limitations. retrieval (IR), where IR is broadly interpreted as ad hoc and distributed retrieval, structured queries, cross-language IR, summarization, filtering, categorization, and so on. We selected the program RelEval from the toolkit to conduct the experiment. This program makes use of the toolkit library and performs 32 feedback queries with pre-constructed index files. Rainbow[3] is a program that performs statistical text classification. It takes documents as input and produces a model containing statistics which can be used to classify documents. The input we used contains 1000 files, each with the size of a few Kbytes. Apriori [7] is a data mining tool which is able to mine association rules. We used a 4 Mbytes input file. De-isotope [30] is the program introduced in Section 3. Cluto [20] is a software package for clustering low- and high-dimensional datasets and for analyzing the characteristics of the various clusters. In the first experiment, we studied the runtime overhead of the technique. The results are presented in Table 3. The original execution times are given in the second column. The column labeled with valgrind presents the overhead of the valgrind instrument engine. In other words, we ran the programs on the engine without tracing and collected the execution times. The column with label tracing shows the times with lineage tracing on. The last column presents the slow down factor between runs with tracing and without tracing. We chose to compare the execution times between valgrind and tracing instead of between tracing and original because valgrind itself often entails x10 slowdown, which undesirably skews the real slow down incurred by the lineage tracing technique. From the results in the table, we make the following ob-
servations. • The slow down factors range between 7.5-39.8, which we consider as being acceptable in our application domain. The overhead can be easily paid off by the highly valuable lineage information we gain as demonstrated in our case studies. • The overhead is closely related to the characteristics of a program. For example, in classification type of programs such as cluto and auto-clsss, individual output values are usually related to a large set of input values, resulting in slow set operations that are involved in lineage computation. Deisotope demonstrates the other extreme, in which small lineage sets result in low runtime overhead. • Part of the runtime overhead is caused by the valgrind engine. As mentioned earlier, replacing valgrind with a more efficient industry-strength instrumentation engine will greatly reduce the overall runtime overhead. Table 4 presents the memory overhead. The original memory usage is presented in the column with label orig. The memory overhead stems from two components: the bdd component which stores sets and the tracing component which propagates lineage sets. The memory consumed by the bdd component is mainly decided by the characteristics of the lineage sets. If the sets are repetitive, highly overlapped, or sparse such as in apriori, they can be efficiently represented by roBDDs, resulting in less memory consumption. The tracing part is mainly decided by the memory footprint of the original execution. As we can observe from Table 4,
benchmark
orig.(MB)
bdd (MB)
tracing (MB) 2.2
auto-class
1.8
1.9
image processing
16.1
198
16
lemur
14
38.4
9.7
rainbow
6.8
50.8
15.3
apriori
4.1
0.19
3.6
deisotope
125
66.2
17.4
cluto
3
5.2
2.2
Table 4: Memory the memory usages are mostly comparable, which suggests that memory overhead is not the dominant factor compared to runtime overhead.
8.
CONCLUSIONS
Fine-grained lineage is extremely valuable for many scientific and database applications. Several efforts have been focussed on computing fine-grained lineage when relational operators are used to transform data. However this work is not applicable to the important and common case for many applications that employ non-relational operators for processing data. The current work for arbitrary operators is very limited and cannot be applied automatically without specific domain knowledge. In this paper, we presented the first technique that can trace fine-grained lineage across arbitrary operators. Our method is motivated by the technique of dynamic slicing used for debugging. We have shown how this technique can be modified for tracing fine-grained lineage. The new technique was shown to be accurate and highly effective using a real application for scientific data. The technique has the significant advantage that it does not require any domain knowledge, access to source code, or human intervention. The results from our method were shown to help improve the accuracy and reliability of the de-isotope function. In addition, we showed that although the tracing method does introduce a significant slow down, it is still an extremely valuable tool. This is especially true for scientific applications for which the availability of finegrained lineage is a major obstacle. Thus making this data available is far more important than the extra time needed to compute it. Moreover, since this represents the first step in developing such a system, we expect that future work will help improve the runtime cost of the tracing. We tested the method on a wide variety of applications and showed that tracing is easily achieved in each case. The new technique is useful for any application that uses complex processing and requires lineage tracing such as drill through operations in data warehouses and data cleansing.
9.
REFERENCES
[1] Buddy, a binary decision diagram package. Department of Information Technology, Technical University of Denmark. [2] http://valgrind.org. [3] http://www.cs.cmu.edu/ mccallum/bow. [4] http://www.cs.purdue.edu/homes/mgelfeky/dq/. [5] http://www.lemurproject.org/. [6] H. Agrawal and J. R. Horgan. Dynamic program slicing. In PLDI, 1990. [7] R. Agrawal, T. Imielinski, and A. Swami. Mining association rules between sets of items in large databases. In SIGMOD, pages 207–216, 1993.
[8] G. Alonso and C. Hagen. Geo-opera: Workflow concepts for spatial processes. In Symposium on Large Spatial Databases, pages 238–258, 1997. [9] O. Benjelloun, A. D. Sarma, A. H., and J. Widom. Uldbs: databases with uncertainty and lineage. In VLDB, 2006. [10] A. Beszedes, T. Gergely, Z. M. Szabo, J. C., and T. Gyimothy. Dynamic slicing method for maintenance of large c programs. In CSMR, 2001. [11] D. Bhagwat, L. Chiticariu, W. C. Tan, and G. Vijayvargiya. An annotation management system for relational databases. In VLDB, pages 900–911, 2004. [12] R. Bose and J. Frew. Lineage retrieval for scientific data processing: a survey. ACM Comput. Surv., 37(1):1–28, 2005. [13] P. Buneman, S. Khanna, and W. C. Tan. Why and where: A characterization of data provenance. In ICDT, pages 316–330, 2001. [14] Y. Cui and J. Widom. Lineage tracing in a data warehousing system. In ICDE, pages 683–684, 2000. [15] I. Foster, J. Vockler, M. Wilde, and Y. Zhao. The virtual data grid: A new model and architecture for data-intensive collaboration. In CIDR, 2003. [16] I. T. Foster, J. S. V¨ ockler, M. Wilde, and Y. Zhao. Chimera: A virtual data system for representing, querying, and automating data derivation. In SSDBM, 2002. [17] M. Frigo and S. G. Johnson. The design and implementation of FFTW3. Proceedings of the IEEE, 93(2):216–231, 2005. [18] P. Groth, S. Miles, W. Fang, S. C. Wong, K. P. Zauner, and L. Moreau. Recording and using provenance in a protein compressibility experiment. In HPDC’05, July 2005. [19] T. Gyimothy, A. Beszedes, and I. Forgacs. An efficient relevant slicing method for debugging. In ESEC/FSE-7, pages 303–321, 1999. [20] George Karypis. Cluto - a clustering toolkit. Technical Report 02-017, Computer Science and Engineering, University of Minnesota, April 2002. [21] B. Korel and J. Laski. Dynamic program slicing. Information Processing Letters, 29(3):155–163, 1988. [22] A. P. Marathe. Tracing lineage of array data. J. Intell. Inf. Syst., 17(2-3):193–214, 2001. [23] C. Meinel and T. Theobald. Algorithms and data structures in vlsi design, 1998. Springer. [24] S. Miles, P. Groth, M. Branco, and L. Moreau. The requirements of recording and using provenance in e-science experiments. Journal of Grid Computing, 2006. [25] R. D. Stevens, A. J. Robinson, and C. A. Goble. mygrid: personalised bioinformatics on the information grid. Bioinformatics, 19(Suppl 1):i302–i304, 2003. [26] A. Woodruff and M. Stonebraker. Supporting fine-grained data lineage in a database visualization environment. In ICDE, pages 91–102, 1997. [27] M. Zhang, D. Kihara, and S. Prabhakar. Tracing lineage in multi-version scientific databases. Technical Report CSD TR 06-013, Computer Sciences, Purdue University, July 2006. [28] X. Zhang, R. Gupta, and Y. Zhang. Efficient forward computation of dynamic slices using reduced ordered binary decision diagrams. In ICSE, 2004. [29] X. Zhang, H. He, N. Gupta, and R. Gupta. Experimental evaluation of using dynamic slices for fault location. In AADEBUG, 2005. [30] X. Zhang, W. Hines, J. Adamec, J. Asara, S. Naylor, and F. E. Regnier. An automated method for the analysis of stable isotope labeling data for proteomics. J. Am. Soc. Mass Spectrom, 16:1181–1191, 2005. [31] W. Zhu, X. Wang, Y. Ma, M. Rao, and J. S. Glimm, J.and Kovach. Detection of cancer-specific markers amid massive mass spectral data. Proc Natl Acad Sci U S A, 100:14666–14671, 2003.