4029
Tracking of Cerebral Arterial Segment by Particle Filtering in CT Angiography H. Shim1, D. Kwon1, I.D. Yun2 and S.U. Lee1 1
Automation and Systems Research Institute (ASRI), School of Electrical Eng., Seoul Nat’l Univ., Seoul, Korea 2 School of Electronics and Information Eng., Hankuk Univ. of Foreighn Studies, Yongin, Korea
Abstract—In this paper a method to extract a segment of cerebral arteries from CT angiography (CTA) is proposed. Since the CTA shows both bone and vessels, the examination of vessels is a challenging task. It is also very difficult to separate out an arterial segment not corrupted by vein contamination. Since a vessel segment is considered as an ellipse travelling in three dimensional (3-D) space, its extraction is taken as tracking of the ellipse in spatial sequence and is solved by the application of a particle filter. The proposed tracking method is equipped with adaptive properties to both bone contact and vein contamination, leading to less user intervention. The experimental results on actual clinical data showed its improved robustness compared to the conventional vessel tracking methods and confirmed its feasibility. Keywords— segmentation, vessel tracking, CTA, particle filter, cerebral arteries
method-inconsistency in the whole volume and the problem of global thresholds in the upper sub-volume. The proposed work employs a particle filter (PF) as the main framework, and defines the system model and the measurement model adaptively to the case of cerebral arteries. Especially in the update stage, the border points on the normal cross-section are considered as the observations z k and the weight associated with each particle is updated by the exponential sum of distances of the points in z k and the 3-D ellipse determined by each particle. In this way, the proposed tracking revises the normal vector at every discrete time and lowers the possibility to get astray or to make a turnover. II. METHODS
I. INTRODUCTION For well-timed prognosis of a subarachnoid hemorrhage (SAH), periodical screening by medical images is efficacious and cerebral arteries essentially need to be delineated not hindered by bone nor disrupted by vein contamination. There have been a number of literatures on vessel segmentation as surveyed in [1]. Segmentation of cerebral arteries in CTA is very challenging mainly due to two facts, i.e. the overlapping Hounsfield unit (HU) value distributions of bone and vessels and the close contact between them. To deal with these problems, the proposed work uses some anatomic knowledge such that arteries are smoothly varying structures with elliptical cross-sections. Smooth variation along the central axis leads to tracking-based segmentation. Wink et al. [2] extracted the abdominal aorta based on tracking of the center line. The abdominal aorta is thick and mostly straight, therefore it is much simpler to extract. However, if being applied to cerebral arteries in the CTA, their work has limitations, especially when the boundaries are obscured by vein contamination. Shim et al. [3] have partitioned a CTA volume into two sub-volumes and applied a separate algorithm to each sub-volume, i.e. adaptive tracking method to the lower one and thresholding-based region growing to the upper one. As a consequence, it has
First of all, some basic notions on particle filtering are briefly reviewed. The detailed description is available in [4]. The PF is a sequential Monte Carlo method to solve the non-linear Bayesian state estimation problem, which can be expressed in terms of the system model and the measurement model of the following:
x k =f k (x k −1 , v k −1 ),
(1)
z k =h k (x k , w k ) ,
(2)
where x k and z k represent the state vector and the measurement vector, respectively. Both of the system noise v k −1 and the measurement noise w k are i.i.d. sequences of zero means. The objective of the PF is to estimate the current state x k from the measurements z1:k = {z i , i = 1,..., k} , i.e. to construct the probability density function (pdf) p(x k | z 1:k ) . For simplicity, with the assumption of the 1st-order Markov random process, the particle filter produces at each discrete time k, a set of N s particles
{x ik , i = 1,..., N s } {q ki , i
with
a
set
of
associated
weights
= 1,..., N s } which closely approximate the posterior pdf, p(x k | z k ) ,expressed as
4030 Ns
p(x k | z k ) ≈ ∑ q ki δ (x k − x ik ) .
(3)
i =1
Using the principle of importance sampling [5] and resampling at every k [4], the proposed method employs the SIR (sampling importance resampling) PF [6] by applying the prediction stage and the update stage to each particle and its associated weight, and the resampling stage to the whole set of the particles. This is summarized as a pseudo code in Algorithm 1. - FOR i = 1 : N s . Prediction : Draw x ik ~ p (x k | x ik −1 ) w ik
. Update : ∝ - END FOR - Estimation :
w ik −1 p(z k
|
splitting the system noise v k into v ck , v nk , and v ek ,independently. The transitions for c k and e k of (6) and (8) are straightforward. All the six components of the noises, v ck = [vc x vc y vc z ]T and v ek = [ve x ve y ve z ]T , are k
k
k
k
k
k
assumed to be independent of each other and also independent of the time k. Then, each of them is modelled as a Gaussian distribution with the zero mean and a constant standard deviation such that denoted by σ c x , σ c y , σ c z , σ ea , σ eb , and σ eβ , respectively. However, for the transition of the normal vector n k corrupted by the noise v n k , more sophisticated consideration
x ik )
is needed. Using the polar angle vφ and the azimuth vθ , Ns
xˆ k = mean(∑ i =1
v n k near the north pole (0,0,1) is represented as
q ki δ (x − x ik ))
(4)
v n = [cosvθ sinvφ sinvθ sinvφ cosvφ ]T . k
- Resampling : the same was as Algorithm 2 in [4]
The rotational randomness of vθ is uniform through
Agorithm 1. The SIR PF at the discrete time k
[0,2π ) and the samples become sparser as they are farther away from the north pole, meaning
A. The system model of the proposed method At the current time k, the elliptical cross-section of a vessel segment can be represented by a 9x1 state vector which is divided into three 3x1 vectors as x k = [c xk c yk c zk n xk n yk n zk a k bk β k ]T = [c Tk n Tk e Tk ]T . (5) T
(9)
T
c k = [c xk c yk c zk ] and n k = [n xk n yk n zk ] represent the ellipse center and the unit normal vector at the cross-section, respectively. e k = [a k bk β k ]T specifies the ellipse shape by the two lengths of the semi-axes, and the rotation angle in the normal plane determined by n k . If the elliptical cross-section marches with a constant unit velocity, then the state transition can be modelled as the addition of the unit normal vector to the center of the previous state, while maintaining the normal vector and the elliptical shape unchanged. Not to mention, the transition is corrupted by the system noise v k . To model the randomness of v k reasonably, the system transition of (1) is also represented by three 3x1 vector equations as c k = c k −1 + n k −1 + v ck ,
(6)
n k = f nk (n k −1 , v nk ) ,
(7)
e k = e k −1 + v ek ,
(8)
vθ ~ U [0,2π ), vφ = N (0, σ φ2 ) .
(10)
The normal unit vector n k of (7) is randomized according to (10) around the previous normal vector n k −1 whose
polar angle and azimuth are φk −1 and θ k −1 . n k can be obtained by rotating the random unit vector v n k of (9) around the y-axis by φk −1 and then rotating around the z-axis by
θ k −1 . If these two rotations are represented by R z ,θk −1 and R y ,φk −1 , n k = R z ,θ k −1 R y ,φk −1 v n k .
(11)
B. The measurement model of the proposed method
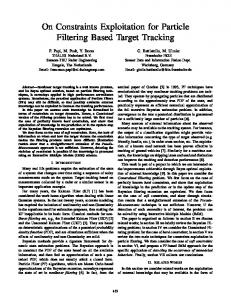
In this paper the measurement is set as the border points detected on the cross-section perpendicular to the central axis. This normal plane is not related to the normal vector n k but is determined directly from the CT volume data by minimizing the cross-sectional area over all the sampled pairs of the polar angle and the azimuth (θ , φ ) . To detect the border points as the measurement, rays are cast along the directions equally sampled around the candidate center as in Fig. 1. Since arteries are usually surrounded by darker soft tissues, the border point along the
4031
ray is detected as the first negative extremum below some negative threshold t − , and is illustrated as the solid line with ‘+’ in Fig. 1 (c). However, in the case of bone contact in Fig. 1 (a), the radial component of the gradient shows large positive value. Thus, the first positive extremum above a positive threshold t + is detected as the border point, i.e. the dashed line with ‘ ∗ ’ in Fig. 1 (c). The vein contamination in Fig. 1 (b) results in smooth change of intensity values along a ray. The magnitude of t − is lowered to a new threshold which is used again to detect the border point. This case is displayed in Fig. 1 (c) as the dotted line with ‘o’. As seen in Fig. 1 (a) and (b), although some border points are detected as outliers denoted by ‘ ◊ ’, the modified thresholds t and t ′ generally produce proper border +
−
points. These outliers should be removed in the computation of the distance between each particle and the actual measurement. Let N , N , and e ′ be the number of the rays, the z
(a)
(b)
150 Surrounded by normal tissue Surrounded by bone Adjacent to veins 100
border t + = 50
Radial gradient 0 border t−’ = −30 t− =−50
k −1
o
border
number of the outliers, and the translation of the previous ellipse e k −1 by the normal vector n k −1 , respectively. A
−100
0
2
4
6
8 Radius
10
12
14
16
border point is removed as outlier if it is one of the N o points which are the most distant from e ′ .
(c) Fig. 1 Arterial cross-sections and the detection of borderpoints by the radial components of the gradients with, N z = 16 , N o = 2 : (a) Surrounded
Then, the measurement z k is a set of ( N z − N o ) 3-D
by bone structure, (b) Adjacentto vein contamination, (c) The plots of the radial components ofthe gradients along rays for the cases of being surrounded bynormal tissues, (a), and (b).
k −1
points on the normal plane as {p ki , i = 1,..., ( N z − N o )} and indicates the actual vessel boundary. The aim of z k is to weight more heavily the particle x ik whose ellipse eik is more similar to the measurement. The distance between z k and x ik is defined as
d (z k , x ik ) =
1 Nz − Ns
Nz − N s
∑
~ d (p kj , e ik ) ,
(12)
j =1
~ where d (p, e) denotes the 3-D distance between a point p and the boundary of an ellipse e . Then the updated weight is represented as
exp(− Kd (z k , x ik ))
III. EXPERIMENTAL RESULTS AND DISCUSSION The proposed segmentation method has been tested with actual clinical data. The aim is to track two vessel segments in a CT volume with two initial seeds located in the left and right internal carotid artery (ICA), respectively. The dataset is composed of 15 studies from different patients i.e. totally 30 vessel segments. Fig. 2 (a) shows one vessel segment comprising of the left ICA and the left middle cerebral artery (MCA) tracked by the proposed method with 495 steps, displaying only every tenth steps. Empirically σ c x = σ c y = σ c z = σ ea =
(13)
σ eb = 1.0 and σ e β = σ φ = π / 8 . Each step consists of
where K is a normalizing constant depending on the relative range of the distance. After the weights are updated, the particles are resampled according to Algorithm 1.
several ellipses, one of which is enlarged in Fig. 2 (b). The ellipse of blue dashed line indicates the prior state mean( p(x k | x k −1 )) and the ones of cyan dotted lines represent the three particles having the three largest weights. Since N s = 500 , there are 497 hidden ellipses of cyan dotted lines. Each particle is weighted according to the exponential sum of distances using (12) and (13). The black tiny
q ki ∝ q ki −1
Ns
∑ exp(− Kd (z k , x mk ))
m =1
4032
squares represent the 14 3-D points composing the actual observation z k and the two crosses are the outliers, i.e. N z = 16 and N o = 2 . As the weighted mean of all the N s particles of (4), the ellipse of red solid line is the updated state x k at time k. Fig. 2 (a) illustrates that the proposed method tracks the vessel segment acceptably not getting astray nor making turnovers. Next, the comparison with the work of Shim et al. [3] is performed using the 30 vessel segments. Tracking is judged as a success, when the whole ICA is extracted and tracking continues flowing into main branches of the ICA, mostly the MCA. The work of [3] has recorded 23 successes among 30 vessel segments. The proposed method added three successes giving the success rate of 86.7%. For these three cases, the failure of [3] results from the shot noise in the computation of normal vector and the sharp bending of the axis near vein contamination. On the contrary, the proposed method makes use of the accumulated statistics of the particles and is less affected by the unexpected normal vector, obscure boundaries, or abrupt curvature change, whose results are shown in Fig. 3 (c) and (d). IV.
(a)
(b)
(c) (d) Fig. 2 Experimental results : (a) A vessel segment tracked by the PF through 495 steps, (b) Enlargement of the box in (a), (c, d) The two cases where the work of [3] failed and the proposed method succeeded.
CONCLUSIONS
In this paper a method to extract a segment of cerebral arteries from CTA was proposed. It tracked the centerline using an SIR (sampling importance resampling) particle filter. The measurement model of the proposed method defines the border points on the normal plane as the observation. They are detected using the radial component of the gradient and the thresholds for detection are adaptively modified to deal with bone contact and vein contamination. The distance is measured as the exponential sum of distances of the border points except the outliers from the ellipse defined by each particle. Totally 30 vessel segments were provided for the comparison of the proposed method to the work of Shim et al. [3] which also has the acceptable tracking performance. The proposed method improved the success rate by virtue of the collective statistics of a number of particles, even in the cases of abrupt change in curvature or inaccurate normal vector computation.
ACKNOWLEDGMENT This work was supported by the Korea Research Foundation Grant funded by the Korean Government(MOEHRD) (KRF-2005-400-20050165).
REFERENCES 1.
2.
3.
4.
5.
6.
Kirbas C, Quek F, (2003) Vessel extraction techniques and algorithms: a survey. Third IEEE Symposium on Bioinformatics and Bioengineering:174-181 Wink O, Niessen W, Viergever M, (2000) Fast delineation and visualization of vessels in 3-D angiographic images. IEEE Trans. on Medical Imaging 19:337-346 Shim H, Yun I, Lee K, Lee S, (2005) Partition-based extraction of cerebral arteries from CT angiography with emphasis on adaptive tracking, 19th Inter. Conf. on Information Processing in Medical Imaging (IPMI) :357-368 Arulampalam M, Maskel S, Gordon N, Clapp T, (2000) A tutorial on particle filters for online nonliear/non-Gaussian Bayesian tracking, IEEE Trans. on Signal Processing 50:174-188 Doucet A, Godsill S, Andrieu C, (2000) On sequential Monte Carlo sampling methods for Bayesian filtering, Statistics and Computing 10:197-208 Gordon N, Slamond D, Smith A, (1993) Novel approach to nonlinear and non-Gaussian Bayesian state estimation, IEE ProceedingsF: 107-113 Address of the corresponding author: Author: Prof. Il Dong Yun Institute: Hankuk University of Foreign Studies Street: San 89, Wangsan-Ri City: Yongin-Si Country: KOREA Email:
[email protected]