ABSTRACT As asynchronous transfer mode (ATM) networks move from the design phase to the deployment phase, several theoretical assumptions and hypotheses made in the research literature can be evaluated. Experimental validation and verification is an essential component in the overall development of any novel technology. In this article the authors report the results of several controlled experiments measuring the transport of traffic in a wide area ATM network: the very high-speed Backbone Network Service (vBNS). We illustrate how the characteristics of a tagged traffic stream change as the traffic traverses the network. Also, IP applications traffic is characterized at the ATM level. Lastly, we comment on the validity of theoretical assumptions often made in the research literature.
Traffic Experiments on the vBNS Wide Area ATM Network Sujata Banerjee, David Tipper, and B. H. Martin Weiss, University of Pittsburgh Anis Khalil, MCI Telecom
A
synchronous transfer mode (ATM) technology holds the promise of providing various multimedia applications with quality of service (QoS) guarantees in a high-speed network. ATM is a fast switching and multiplexing technique that employs fixed-size packets called cells, and uses sophisticated traffic control algorithms to provide QoS guarantees to individual applications. Several high-speed wide area ATMbased networks are now deployed and in operation, providing an opportunity to experimentally characterize the performance and evaluate results obtained by mathematical analysis and computer simulation. This kind of experimentation will provide valuable insight into practical network management issues as well as enable the fine tuning of network controls to obtain the most efficient operation in the next generation of broadband networks. In this article, we describe an ongoing experimental study of various traffic engineering issues in a wide area ATM network. The major issue that we have concentrated on in the first phase of this multiphase research project is to determine accurate models of network traffic and the quantitative changes in traffic as it traverses the network. Such characterization of ATM traffic is important since it allows the development of accurate call admission and congestion control mechanisms at internal switching nodes where the characteristics of the traffic from an application may be significantly different from that generated at the source. For instance, if the peak rate requirement of a traffic stream increases as it traverses the network due to interference with other traffic, downstream switching nodes may have to reserve more bandwidth for this stream than upstream nodes. Related work on ATM traffic characterization uses stochastic process analyses, simulation, and, more recently, measurements from operational networks (primarily ATM LANs) [1–5]. A significant difference between our work and most other measurementbased projects is that our measurements were conducted in a This work was supported in part by a grant from MCI Corporation and an equipment grant from Hewlett-Packard Corporation.
126
0163-6804/97/$10.00 © 1997 IEEE
wide area environment with emphasis on the ATM cell level traffic characteristics. The traffic measurement experiments described in this article are of two types. The first kind of experiment is tailored to study a traffic stream with known characteristics, after it has traveled through multiple switches, subject to varying background traffic rates. The objective of this type of experiment is to quantify the statistical changes in the tagged traffic stream as it traverses the network. Various cell level QoS parameters of interest, such as the end-to-end cell delay, cell loss, and cell delay jitter for the tagged traffic stream, were measured and statistically analyzed in order to quantitatively characterize the effects of the network on the tagged stream. The second type of experiment involves the measurement and analysis of traffic generated by IP applications on the network and is aimed at characterizing application traffic at points deep in the network, far from the source. The statistics of the interarrival pattern of ATM cells were determined. Specifically, the mean and peak rates of the connection, along with the distributions of the burst interarrival time, gap length, and burst length were studied.
THE EXPERIMENTAL SETUP The basic experiment consisted of utilizing a high-speed ATM hardware measurement device to gather data from the very high-speed Backbone Network Service (vBNS) ATM network. Here we mention only the salient features of the vBNS that are relevant to our experiments, for additional vBNS information see [6] and the vBNS Web page at http://www.vbns.net. The vBNS is a wide area ATM network, operating at OC-3 rates (155 Mb/s). It is funded by the United States government through the National Science Foundation (NSF), and operated by the MCI corporation. The vBNS spans the continental United States, interconnecting the five NSF funded Supercomputing Centers (SCC): Cornell Theory Center, National Center for Atmospheric Research, National Center of Supercomputer Applications, Pittsburgh Supercomputer Center, and San Diego Supercomputer Center. The vBNS also provides connectivity to four network access points
IEEE Communications Magazine • August 1997
Node/NAP
(NAPs) located at New York (Sprint), Chicago (Ameritech), San Francisco (Pac Bell) and Washington, DC (MFS). A list of the vBNS nodes and network access points (NAPs) is provided in Table 1. The vBNS was originally intended to provide a means for remote users to access the SCCs and to provide high bandwidth in support of distributed processing for a “supercomputing meta-center.” The role of the vBNS was later expanded so that networking researchers can use the vBNS as a resource for scheduled network and application experiments with a stated focus on “high bandwidth meritorious applications.” A logical map of the vBNS is given in Fig. 1. At the time the measurements reported here were conducted the vBNS consisted of 15 OC-3 links and 20 switching nodes (11 Cisco Lightstream 2020 and 9 GDC APEX switches) with MCI as the service provider.1 Part of the vBNS shares physical links with MCI’s commercial ATM network (connected by the GDC switches). In the shared backbone portion of the physical network, the vBNS is allocated a variable bit rate virtual path with a peak rate of 155 Mb/s and a sustained rate which is a fraction of the peak rate. The configuration of the vBNS during the data collection period (9/95–8/96) did not implement priority traffic classes, traffic policing, or shaping and all switch queues implement a FCFS discipline. The various network nodes listed in Table are logically interconnected by a full mesh of ATM permanent virtual channels (PVCs). Each SCC node on the vBNS is identically equipped offering network access via routed FDDI, routed HIPPI, and ATM UNI (OC-3). Figure 2 shows the equipment configuration at each SCC node. Direct native mode ATM is supported by the Lightstream switch, IP over FDDI is supported by both the Netstar Gigarouter and the Cisco 7000 router, and IP over HIPPI is provided by the Netstar. Depending on the SCC node connectivity to the wide area ATM network is provided by one or two OC-3 lines from the Lightstream. The Hewlett-Packard Broadband Tester (BBT) utilized in collecting measurements is a modular test platform intended for high-speed protocol testing. The BBT used here was equipped with a Cell Protocol Processor (CPP) hardware module, a 155 Mb/s SONET Optical Line Interface, and software that implements the ATM Adaptation Layers and has segmentation and reassembly (SAR) capabilities. The CPP can both generate and capture cell-based traffic at rates from 0 to 155 Mb/s. The CPP can generate multiple ATM cell
C N
Abbreviation
Cornell Theory Centry, Ithaca
CTC
Pittsburgh Supercomputing Center, Pittsburgh
PSC
National Center for Applications, Urbana
NCSA
National Center for Atmospheric Research, Denver NCAR San Diego Supercomputing Center, San Diego
SDSC
Downer’s Grove, Chicago
DNG
Hayward, San Francisco
HAY
Washington, DC
MFS
North Royalton, Cleveland
NOR
Pennsauken, NJ
PNJ
Perryman, MD
PYM
Denver Junction
DNJ
Houston Junction
HSJ
■ Table 1. Notation for vBNS nodes and NAPs.
streams at constant and variable bit rates. The generated cells can be given any user-supplied values including the virtual path identifier (VPI), the virtual channel identifier (VCI), the cell loss priority (CLP), and the generic flow control (GFC). In addition, the BBT can insert the time of a cell’s creation into the payload of the generated cell. For cell capture, the CPP is equipped with an 8 MB cell capture buffer, which can hold 131,073 ATM cells. The desired cells can be filtered by VPI, VCI, CLP, or any other value both before capture in the CPP buffer. Functional and value triggers can be set to both initiate and end cell capture-based on external events such as Unix timers or values occurring in the cell header or payload. The BBT 155 Mb/s SONET Optical Line Interface (OLI) has cell generation and capture facilities similar to those of the CPP. The OLI can be configured to repeat SONET/SDH mapped signals from its optical input to its optical output, while copying the frame to the CPP. Thus the BBT can be placed inline between two switches and repeat/monitor traffic. This enables monitoring and capture of ATM cells from an ATM-based SONET signal traveling between switches without disturbing the operation of the network. In the experiments described below the The National Science Foundation vBNS broadband tester was used in two ways, Logical Network Map namely: •As a source and sink of a traffic stream •As an inline monitor of traffic on a link N C Also, for all experiments, the broadCornell Theory Center BIPP Chicago Cleveland N band tester was attached to the psc.edu C National Center for Atmospheric Research C C N LAN, and we were able to modify paramBaltimore Pittsburgh C C Denver N eters via the Internet and start/stop experSuperNational Center for C San Francisco computer C Supercomputing iments remotely from our university lab. Center Applications Frame There are many pragmatic hurdles in C relay C Cary conducting a controlled measurementSan Diego Supercomputer Center based study, especially in a wide area netN work where very fine control over all C network components may not be possible due Table to technical limitations and administrative Houston T1 concerns. Further, due to the high-speed T3 OC-3C N NetStar IP router C Cisco IP router Lightstream ATM switch Network access point
■ Figure 1. Logical map of the vBNS, see http://www.vbns.net.
IEEE Communications Magazine • August 1997
1
The vBNS is currently being upgraded to OC-12 rates and the Lightstreams replaced by FORE ASX-1000 switches.
127
Wide area ATM network
A minor limitation of the BBT was that while generating multiple streams of traffic simultaneously, there would be slight differences in the rate of the traffic generated. Thus, some of the traffic rates are at unconventional values.
OC-3
EXPERIMENTS CONDUCTED s noted above, two classes of experiments were conducted. The first set of experiments were tailored to study the A impact of traversing multiple switches on the transport of a
LIghtstream ATM switch OC-3
OC-3
Netstar gigarouter
FDDI
HIPPI crossbar switch
ATM
HIPPI
Digital alpha monitor/mgmt probe
Cisco 7000 router
FDDI
SCC attachments
FDDI
■ Figure 2. vBNS supercomputing center node equipment. nature of the network, fast and accurate measurement equipment is required, which has technical and cost implications. The main limitations of our experimental setup were: • The limited size of the capture buffer on the HP BBT • The inability to completely control all traffic on the vBNS • The sustained cell rate limit placed on vBNS traffic on the communication links that the vBNS shares with MCI’s commercial ATM network (connected by GDC ATM switches) We were able in part to overcome these limitations as follows. As mentioned earlier, the maximum number of cells that the CPP module of the HP tester can capture at one time is 131,073 ATM cells. Thus the duration of our experiments were limited by the capture buffer size and the rate at which traffic was generated/captured from a VC. In order to determine reasonably valid statistical estimates of the traffic behavior each experiment was replicated many times (from 15–50 times). Since the network was not entirely dedicated to our experiment, it was impossible to minutely control the background traffic on the vBNS. However, using the vBNS SNMP statistics (collected on the Lightstream switches — available on the vBNS Web page) which show the average link utilizations over roughly 10 min intervals, we attempted to schedule our experiments when background loading in the network on the portions used by us was negligible. Experimental results were discarded when the background loading checked after the experiment showed significant loading not generated by our experiments. In order to cope with the sustained cell rate limit placed on vBNS traffic which crosses the MCI commercial ATM backbone, the aggregate bit rate of background and tagged traffic streams was kept low in experiments using the shared portion of the network. Additionally several sets of experiments were designed to have only a portion of the traffic of interest (e.g., the tagged stream) traverse the shared backbone, while other traffic streams generated traveled on those parts of the vBNS where the full OC-3c rate is available.
128
tagged traffic stream with known characteristics. For this set of experiments, the BBT was attached to its own vBNS Lightstream ATM Switch single mode OC-3 interface at the Pittsburgh Supercomputer Center (PSC) (Fig. 2). Our experiments consisted of setting up a (permanent) virtual channel (VC) between the BBT at PSC and one of several vBNS nodes (NOR, DNG, HSJ, NCAR, or SDSC nodes) and looping the VC back to the HP BBT at PSC. For example, the virtual channel between PSC and NOR was looped back to the BBT at PSC to create a three-switch hop VC (PSC-NOR-PSC). The BBT was used to generate a traffic stream of a specified rate (referred to as the tagged traffic stream) which was transmitted through the network over the dedicated VC and captured upon its return to the BBT. The objective of our experiment was to quantify the variations in end-to-end cell delay, cell delay jitter, and the cell interarrival times (as observed by the BBT after the cells had traversed the VC) of the tagged traffic stream. To study these effects under the conditions of various network loads, a background traffic stream was generated that contended with the tagged traffic stream at one or more switching nodes. Hence, the experiments can be viewed as a tandem series of queues (1 per hop) with the tagged traffic traveling through all queues and background traffic interfering at the various queues. The experimental parameters varied were the rate and distribution of the background traffic, the rate and distribution of the tagged traffic and the number of hops traversed. More than 70 different traffic scenarios have been studied; for the sake of brevity a subset of the results are presented. Here we report results for the case of a constant bit rate (CBR) tagged traffic stream. This is a logical starting point for our experiments since deviation from CBR characteristics is relatively easy to measure and interpret. Further, several simulation and analytical studies investigating the performance of CBR traffic transport in ATM networks have recently appeared in the literature, and we are able to compare our results with these studies. CBR traffic can arise from many traffic sources, such as fixed rate coded voice and video, emulation of T1, T3, or other rate connections for virtual private networks, and the transport of traffic from existing circuit switched networks. CBR traffic is expected to impose end-toend delay, delay jitter, and cell loss requirements on ATM networks. The delay jitter is essentially a measure of the change in the interarrival times of the cells of a connection. The delay jitter is of particular importance as it affects the sizing of playout buffers for CBR applications and the synchronization of end points in the transport of circuit switched traffic. Note that the vBNS switches were not configured in circuit emulation mode for the transport of circuit switched CBR traffic. Thus we are observing the behavior of a periodic traffic source stream on a VC that may be more appropriate for a variable bit rate connection. Another way to interpret the results on the shared portions would be that the distortion in the CBR stream caused by the network is a best case distortion for a VBR connection. Experiments were conducted for four different CBR tagged stream rates: 64 kb/s, 256 kb/s, 1031 kb/s, and 4125
IEEE Communications Magazine • August 1997
VC Path
# Switch Hops
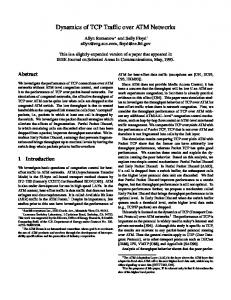
PSC-NOR-PSC 3 contrast, large positive delay jitters will kb/s. The number of switch hops for the induce distortion noticeable to the end various VCs used in our experiments are PSC-PYM-PSC 4 user and are difficult to compensate for. given in Table 2. 2 Contending backPSC-DNG-PSC 9 However, negative delay jitters can be ground loading generated by the BBT used to smooth out the positive delay jitwas at the following three levels, which, PSC-HSJ-PSC 15 ter values seen by the end user — as for ease of identification, have been long as the negative delay jitter has not labeled Series 1, 2, and 3, respectively, PSC-NCAR-PSC 17 caused an exceeding of the channel’s in the rest of the article: Series 1 — no PSC-SDSC-PSC 21 peak rate that has triggered policing of background traffic; Series 2 — two CBR the channel. All of the performance metbackground streams with aggregate bit ■ Table 2. Number of switch hops. rics above can be expressed in ATM cell rate of 40.832 Mb/s; Series 3 — two slots by dividing their observed values by CBR background streams with aggregate the transmission time for an ATM cell. bit rate of 130.688 Mb/s. For Series 2 (2.72 µs at OC-3 rates). and 3, the background traffic generated was routed in a manner such that it contended with the tagged traffic stream at In the second set of experiments, we captured applications only one switching node and the background traffic did not traffic on the vBNS. The design of these experiments was more traverse the MCI commercial ATM backbone. challenging due to the following reasons. Firstly, at the time of In performing these experiments we computed the tagged the measurements there were relatively few applications using traffic send-to-receive cell delay times, consecutive cell interthe vBNS, and we had to coordinate closely with the vBNS arrival times, and the cell delay jitter by placing timestamps in technical staff to learn about any scheduled applications. Furthe tagged VC cells. Specifically, each tagged VC ATM cell ther, in spite of our best efforts, we were unable to determine generated by the tester was timestamped with a departure what specific applications generated the traffic, other than the time placed in the cell’s payload. Similarly, each cell on its fact they were IP applications. Since the BBT was physically return to the tester after traversing the VC, was timestamped located at the PSC, we were able to capture only the traffic with its arrival time. If we let the departure and arrival timesto/from PSC. And finally, since we had only a single measuretamps of the kth cell at the monitoring point be denoted by tkd ment equipment, we were able to obtain measurements at one point only, i.e., unlike the first set of experiments, we do not and tka, respectively, then the end-to-end delay for the kth cell, have end-to-end measurements. Thus the main focus of these dk is simply the difference between the arrival and the deparmeasurements was to statistically characterize the captured ture timestamps, i.e., traffic. We do not claim that the characteristics of the IP applia d (1) dk = tk – tk , k ≥ 1. cations captured by us are that of typical applications. However, the significance of these experiments lies the fact in that The interarrival time between the kth and the (k + 1)th cell, modeling real applications traffic is absolutely essential in denoted by IAk is then given by designing ATM traffic control algorithms, and there are relaa a (2) IAk = tk + 1 – tk , k ≥ 1. tively few studies on real applications traffic in ATM networks. For these experiments, the BBT was connected inline on Similarly, the inter-departure time between the kth and the (k the SONET link between NOR and PSC at the Lightstream + 1)th cell, denoted by IDk can be defined as switch at PSC. The captured traffic discussed here was gener(3) IDk = tkd+ 1 – tkd, k ≥ 1. ated by IP applications during the 1995 Supercomputing Conference (SC ’95) held in San Diego and were the result of Note that for CBR traffic, ID k is equal to a constant, that various demonstrations. Because the cells carried by the monidepends on the rate of the traffic. tored VC did not originate with the BBT, only the cell’s The cell delay jitter is essentially a measure of the change arrival timestamp (tka, k ≥ 1) is available. From inspection of in the time between consecutive cells of a connection (i.e., the change in the interarrival times). Thus the cell delay jitter DJk the captured timestamps, we determined that the monitored VC carried variable-bit rate (VBR) traffic. induced by the network is defined by the sequence Following Jain and Routhier [7], we characterize the appli(4) DJk = IAk – IDk for k ≥ 1. cations traffic as a sequence of bursts of consecutive cells separated by gaps of idle time between the bursts. Specifically, we It can be seen that DJk measures the amount of distortion in define a group of back-to-back cells at the peak rate of the VC the captured traffic’s interarrival time, IAk. If no distortion of under study as a burst and the time elapsed between the initiathe cell’s interarrival times occurred in the network, the delay tion of bursts is termed the gap. Figure 3 illustrates the VBR jitter, DJk should be zero. It should be noted that delay jitter traffic characterization definitions for burst l and l + 1. For the as defined here can take on both positive and negative values. applications monitored, statistics on the peak rate, mean rate, Positive values correspond to cell spreading where cells k and burst length, gap length, and the burst interarrival times were (k + 1) are captured with IA k larger than the cell spacing determined in ATM cell time units using data gathered over when generated, whereas negative delay jitter values indicate several measurement periods of the same application. cell clustering with the cells k and (k + 1) captured with smaller IAk than the generated cell spacing. In general, endto-end negative delay jitters can be compensated for by EXPERIMENTAL RESULTS buffering the cells at the exit from the network. However, negative delay jitter in the interior of the network can result n this section, the results from our various experiments are in the VC temporarily exceeding its declared peak rate. In presented. Only representative and significant results are presented for the sake of brevity. In the first set of experiments, the parameters of interest 2 The number of hops for all paths other than the PSC-NOR-PSC VC is are the end-to-end delay, delay jitter, and the changes in the cell interarrival statistics of a CBR tagged stream, as a funclarger in Table 2 than can be inferred from Fig. 1. This is due to the mantion of the number of hops traversed as well as the backner in which the vBNS virtual path is routed over the GDC switches of the ground loading conditions (Series 1–3). For each case, the commercial network.
I
IEEE Communications Magazine • August 1997
129
Burst length k–3 k–2 k–1
k
Gap length
k+1 k+2 k+3
Burst interarrival time Burst l
Burst l + 1
■ Figure 3. VBR traffic characterization. histograms of the end-to-end delay, delay jitter, and interarrival parameters in units of cell transmission units were computed. Figures 4 and 5 contain the histograms of the end-to-end delay and delay jitter values (in cell slots) for the tagged CBR stream at a rate of 4125 kb/s, traversing the 3hop path (PSC-NOR-PSC) for no background loading (Series 1). The histograms show relative frequency values rather than actual cell counts and were based on the data gathered in all the calls, representing approximately 4 million ATM cells. We computed the histograms of single calls as well as all calls together. In general, it was found that the statistical parameters for a single call are not very different for all calls together, except for the range values. The values of the range (minimum and maximum) may only reflect the effect of a sudden impulse of background traffic not under our control in one call. The mean and the standard deviation may be better
1128 cell time units 0.6 Mean: Std. dev.: 0.7436 cell time units
Relative probability
Min.:
0.5 Max.:
1125 cell time units 1244 cell time units
0.4 0.3 0.2 0.1 0 1122
1124 1126 1128 1130 1132 End to end delay (in ATM cell time units)
■ Figure 4. PSC-NOR Series 1: histogram of end-to-end delay for all calls at 4125 kb/s.
0.6
Relative probability
0.5
Mean: -0.2707 cell time units Std. dev.: 1.185 cell time units Min.: -36.98 cell time units Max.: 36.31 cell time units
0.4 0.3 0.2 0.1 0 -10 -8 -6 -4 -2 0 2 4 6 8 10 End to end delay jitter (in ATM cell time units)
■ Figure 5. PSC-NOR Series 1: histogram of end-to-end delay jitter for all calls at 4125 kb/s.
130
indications of performance observed. Still, the values of the range variables are indicative of the actual performance that will be seen by applications on a live network. By examining histograms similar to Figs. 4 and 5 for a variety of cases, several interesting trends can be determined and theoretical assumptions evaluated. For example, the distribution of the end-to-end delay and delay jitter are of interest. We attempted to fit both continuous (Normal, Exponential, Gamma, and Weibull) and discrete (Binomial and Poisson) distributions to the end-to-end delay and the delay jitter data. For each data set, the approximate shape of the distribution and the coefficient of variation (or index of dispersion for discrete distributions) were used to select appropriate standard distributions to test against. Standard statistical procedures for fitting a probability distribution to data were followed for each data set and each candidate distribution function. Specifically, the following procedure was followed. The estimated parameters for each distribution was calculated using maximum likelihood estimators (MLEs). Then the probability plot (P-P plot) and quantile plot (Q-Q plot) were used to assess the fit of the distribution. Finally, a chi-square test was conducted for a statistical goodness of fit test. For each distribution, a suitable number of histogram bin sizes were tried so as to obtain the best fit. Although the observed values of the parameters of interest were not discrete, there was considerable clustering around integer values. By grouping the measured values of the parameters into the closest integers, a discrete distribution was obtained. In doing so, the mean value of the parameters do not change. Attempts at fitting several standard discrete distributions to the discrete histograms were then made, using a similar procedure as for the continuous distributions. At this time, none of the measured data (as determined by the ChSquare tests) fits any of the standard continuous or discrete distributions tried. In contrast to our results, the ATM Forum has proposed a uniform distribution for the cell delay variation (CDV) which seems conservative compared to the data observed in our experiments. Also, in [5] it was shown that the 1-point CDV and the end-to-end delay distribution could be fitted accurately to a Gamma distribution over a wide range of network parameters. As noted above, the Gamma distribution did not fit our observed data. Another quantity of interest is the queuing delay incurred which can be determined from the end-to-end delay by subtracting the known propagation delay, BBT delay and the switch latencies. In [5], using simulation, it was shown that the end-to-end cell queuing delay never exceeded the range [0, 60] cells or [0, 164.1 µs] at even very heavy loads. This article concluded that the 1 ms limit on the range of the cell delay variation placed by the ATM Forum and ITU-T seemed to be rather high. However, from our measurements, we observe the same parameter of the order of 500 µs in a relatively lightly loaded network, suggesting that the 1 ms limit may be realistic. Additional observations can be made concerning the statistical changes in the mean cell delay and the cell delay variation as the number of switch hops changes. It was found that the mean queuing delay was basically a linear function of the number of hops for the Series 1 case. A simple linear regression model fit the measured data and the rate of the CBR source had no effect on the mean delay. The normalized autocorrelation function of the end-to-end delay of cells i and i + k, i.e., at a lag of k, is useful in determining the dependency between cells at lag k. If di and d(i + k) represent the delay experienced by cells at lag k, with n reference cells, and mean delay d and standard deviation σd, the normalized autocorrelation function ρ(k) at lag k is given by the following equation.
IEEE Communications Magazine • August 1997
1 0.8
0.6
0.6
0.4
0.4
0.2
0.2 rho(j)
rho(j)
1 0.8
0 -0.2 -0.4
-0.4
-0.6
-0.6
-0.8 -1 0
-0.8 5
10 15
-1 0
20 25 30 35 40 45 50
■ Figure 6. PSC-NOR Series 1: autocorrelation of end-to-end delay for a single call at 4125 kb/s. 1 n−k ∑ i =1 (di − d )(di + k − d ) n − k ρ( k ) = σ 2d
(5)
The value of ρ(k) is between –1 and +1. ρ(k) = 0, for k > 0 implies that the end-to-end delay is uncorrelated. Figures 6 and 7 contain end-to-end delay autocorrelation plots for the 4125 kb/s tagged stream under different number of hops. Figure 6 contains the autocorrelation plot for a single call for Series 1 and the 3-hop path. Figure 7 contains the correlation plots for the 21 hop path, again for the Series 1 case. Obviously, the correlation plots vary significantly with the number of hops. In general it was observed that the delay becomes more positively correlated as the path length increases, which is contradictory to the observations made in the simulation study in [5]. Even though the tagged traffic as generated by the BBT is CBR, variable network delays cause changes in the interarrival times of the cells on their return to the BBT. When cells arrive faster than the nominal arrival rate, the VC experiences an increase in the peak rate used by the channel. In a few infrequent cases, queuing delays encountered cause cells to arrive at the tester with almost a 100 percent increase in peak rate. However, the typical increases in the peak rate were below 10 percent and one metric of the peak rate increase is the fraction of traffic that experienced a given peak rate increase. Figure 8 shows the fraction of traffic that experienced a specific peak rate increase versus the percentage increase, for various path lengths, with no background traffic, keeping the tagged CBR rate at 4125 kb/s. Notice that as the path length increases, the
0.3 0.25
: : : : :
PSC-NOR PSC-SDSC PSC-DNG PSC-HSJ PSC-NCAR
0.2 0.15 0.1 0.05 0 0
5 10 % peak rate increase
15
■ Figure 8. Series 1: percentage increase in the peak rate of the tagged CBR stream at 4125 kb/s.
IEEE Communications Magazine • August 1997
5
10 15
20 25 30
35
40
45 50
■ Figure 7. PSC-SDSC Series 1: autocorrelation of end-to-end delay for a single call at 4125 kb/s. fraction of traffic suffering a large increase in peak rate, also increases. Figure 9 contains the fraction of traffic versus the percentage increase in peak rate for various bit rates, with no background traffic, and a fixed number of hops of 17. It can be seen that the peak rate increase is less than 4 percent for bit rates less than 4125 kb/s. Over this path, the peak rate increase is normally less than 10 percent. Observe that as the CBR rate increases the percentage increase in the peak rate increases as well. As shown in Figs. 8 and 9 the increase in percentage peak rate is typically less than 10 percent, but a significant fraction (more than 10 percent in many cases) of the traffic can experience a peak rate increase on the order of 5 percent. Note that the percentage peak increase could have been inferred from the delay jitter histograms as well. Peak rate increases are important to study since it has bandwidth allocation implications. For instance, if the peak rate increases with the number of hops (as in the cases discussed above), more bandwidth needs to be allocated to the downstream switching nodes to maintain the quality of service. Alternately, peak rate policing schemes could be employed at switches to ensure that the peak rate remains constant. To characterize the changes in the CBR traffic characteristics as a function of the rate of the CBR stream and the number of hops traversed by the tagged CBR stream, the coefficient of variation (COV) for its interarrival time after traversing a specific number of hops is examined. A pure CBR stream has a COV value of 0. Thus the farther the COV value from 0, the bigger is the distortion from its CBR characteristics. Figure 10 shows the COV increases for the tagged VC stream versus the number of hops traversed for different
Fraction of measured traffic
Fraction of measured traffic
0 -0.2
: : : :
0.3 0.25
64 kb/s 256 kb/s 1031 kb/s 4125 kb/s
0.2 0.15 0.1 0.05 0 0
1
2
3 4 5 6 7 % peak rate increase
8
9
10
■ Figure 9. PSC-NCAR Series 1: percentage increase in the peak rate of the tagged CBR stream.
131
For 64kb/s For 256kb/s For 1031kb/s For 4125kb/s
0.06 0.05 0.04 0.03 0.03 0.01 0 2
4
6
8
2.5 Standard deviation of end to end delay (in ATM cell time units)
C.O.V. of interarrival time
0.07
1
0.5
0.5
1 1.5 2 2.5 3 3.5 4 Square root number of hops
4.5 5
■ Figure 11. Series 1: validation of the square root rule at 4125 kb/s.
0 Mean: Std. dev.: Min.: Max.:
0.01649 cell time units 1.287 cell time units -6.162 cell time units 6.235 cell time units
0.7 0.6 0.5 0.4 0.3
0.9 0.8 Relative probability
Relative probability
0.8
1.5
0 0
1 0.9
2
10 12 14 16 18 20 22 Number of hops
■ Figure 10. Coefficient of variation for the cell interarrival times for Series 1.
Regression Square root rule 90% CI.
0.7 0.6 0.5 0.4 0.3
0.2
0.2
0.1
0.1
0 -6 -4 -2 0 2 4 6 End to end delay jitter (in ATM cell time units)
Mean: 0.01682 cell time units Std. dev.: 1.676 cell time units Min.: -9.463 cell time units Max.: 34.33 cell time units
0
-5 0 5 10 15 20 25 30 End to end delay jitter (in ATM cell time units)
■ Figure 12. PSC-PYM Series 1: histogram of the end-to-end delay jitter for all calls at 4125 k/bs.
■ Figure 13. PSC-PYM Series 3: histogram of the end-to-end delay jitter for all calls at 4125 k/bs.
CBR rates. Observe that the COV increases with an increase in the number of hops, as well as the rate of the tagged stream. This was also observed in the study done in [3]. The standard deviation of the end-to-end cell delay over an N-hop path has been approximated by the cell delay variation across a single switch times the square root of the number of — switching nodes (√N) in the path. This is the basis for a law called the square root rule, developed by the ATM Forum BICI specification [8]. This approximation assumes that the delay introduced by a single switch is normally distributed, and does not make any assumptions about the switch loading or the distribution of the traffic stream of interest. The standard deviation (σ) of the end-to-end delay versus the square root of the number of switch hops for the 4125 Kbs traffic is plotted in Fig. 11. The σ per switch is estimated from the 3hop path data. The solid line in this figure is a regression model for the square root rule; the dashed lines above and below the regression line represent the regression model’s 90 percent confidence interval. The standard deviation as predicted by the square root rule is also shown. This figure shows that the rule seems to hold at lower number of hops. However, the 90 confidence intervals of the measured end-to-end delay standard deviations do not include the value suggested by the square-root rule for larger number of hops. For all cases measured, the square-root rule overestimated the standard deviation at larger number of hops. The effect of the background traffic rate on the end-to-end delay jitter parameter is illustrated in Figs. 12 and 13, which
contain the histograms of the delay jitter for Series 1 and 3, respectively. As expected, the standard deviation of the delay jitter increases with the background load. The histogram plot of Fig. 13 shows that the distribution spreads out over a wider range with the increase in the background load. The effect of background interfering traffic on the percentage peak rate increase is identical, with an increase in contending background traffic resulting in an increase in the percentage peak rate. For the second type of experiments, application traffic on the vBNS was captured. In this article one set of application traffic is presented. Only the interarrival statistics can be computed, owing to the availability of only a single point of measurement. The histograms of the burst interarrival times and the burst length for this application are presented in Figs. 14 and 15, respectively. The peak rate of the application traffic was found to be the OC-3 line rate of 155.51 Mb/s, with an average burst size of 5.729 cells, and an average rate of 1.889 Mb/s. The burst interarrival and the interburst gap times had relatively large standard deviations. The maximum burst length observed was relatively small (23 cells), but this can be attributed to the relatively high peak rate assigned to the connection. The burstiness of the traffic measured by the ratio of the peak rate to the average rate is 82.32, indicating that the traffic is very bursty. For the burst gap, and the burst interarrival time, we attempted to fit the exponential distribution to the data following standard statistical procedures as discussed above. However, none of the distributions tested for any of the data sets passed a Chi-square goodness of fit test. We also
132
IEEE Communications Magazine • August 1997
8 7
Mean: 471.6 cell time units Std. dev.: 2231 cell time units Min.: 1.981 cell time units Max.: 9.403e+04 cell time units Median: 8.4 cell time units SIQR1: 5.795 cell time units
6 5 4 3 2
0.5
Mean: Std. dev.: Min.: Max.:
5.729 cell time units 3.156 cell time units 1 cell time units 23 cell time units
0.4 0.3 0.2 0.1
1 0
0.6 Relative probability
Relative frequency (log)
9
0 1 2 3 4 5 6 7 8 9 Burst interarrival time (in ATM cell time units)
2
4 6 8 10 12 14 16 18 20 22 Burst length (in ATM cell time units)
■ Figure 14. Histogram of burst interarrivals for sample application.
■ Figure 15. Histogram of burst lengths for sample application.
checked for self-similarity, but found that the Hurst parameter was small, indicating the data is not self similar.
[3] R. Landry and I. Stavrakakis, “Traffic Shaping of a Tagged Stream in an ATM Network: Approximate End-to-End Analysis,” Proc. of IEEE INFOCOM ’95, April 1995, pp. 162–169. [4] M. Grossglauser and S. Keshav, “On CBR Service,” Proc. of IEEE INFOCOM ’96, March 1996, pp. 129–137. [5] H. Naser and A. Leon-Garcia, “A Simulation Study of Delay and Delay Variation in ATM Networks, Part I: CBR Traffic,” Proc. of IEEE INFOCOM ’96, March 1996, pp. 393–400. [6] J. Jamison and R. Wilder,” vBNS: The Internet Fast Lane for Research and Education,’’ IEEE Commun. Mag., Jan. 1997, pp. 60–63. [7] R. Jain and S. A. Routhier, “Packet Trains — Measurements and a New Model for Computer Network Traffic,” IEEE JSAC, vol. SAC-4, no. 6, Sept. 1986, pp. 986–995. [8] D. E. McDysan and D. L. Spohn, “ATM: Theory and Applications,” Computer Communications, McGraw Hill, 1994.
SUMMARY AND CONCLUSIONS n this article, we have presented results from an ongoing traffic measurement and modeling research project on the IvBNS ATM network. One of the primary goals of this project is the empirical verification and validation of the theories developed in previous research. The main emphasis of the experiments reported here was to examine performance trends of CBR traffic with increases in the number of hops traversed and background traffic. It was found that standard probability distributions did not fit measures such as cell delay, delay jitter, and cell interarrival time. From our analysis, the square root rule is fairly accurate in estimating the cell delay variation suffered by a traffic stream traversing several switch hops. Further, the peak rate of a connection consistently increases with the number of hops traversed. The higher the rate of the CBR stream, the larger is the percentage increase. These experiments with CBR traffic provide a benchmark to understand the phenomena that effects cell level traffic characteristics in operational ATM networks. We also presented measurement results of ATM cell level behavior of IP application traffic. These results illustrate the difficulty in determining a simple model for IP traffic at the ATM cell level for use in ATM performance studies. One possible model would be to draw samples from empirically determined histograms similar to the ones provided in the article.
ACKNOWLEDGMENTS Several students of the Telecommunications Program at the University of Pittsburgh have contributed to this project. We acknowledge the help of our current students Anotai Srikitja, Mark Stover, and Tong Zhang, as well as former students Eugene Zhong, Pål Dyvik, Fuchun Jiang, and Xu Shen. We would like to gratefully acknowledge the help of John Jamison and Laura Cunningham of MCI, Steve Cunningham of PSC, and Kim Claffy of SDSC, and the vTCC in setting up the experiments, and many helpful discussions. Discussions with several other MCI researchers: David McDysan, Tim Dwight, Rick Wilder, and Chuck Song have also contributed significantly to the work presented so far.
REFERENCES [1] L. Dron, G. Ramamurthy, and B. Sengupta, “Delay Analysis of Continuous Bit Rate Traffic over an ATM Network,” IEEE JSAC, vol. 9, no. 3, 1991, pp. 402–407. [2] W. Matragi, K. Sohraby, and C. Bisdikian, “Jitter Calculus in ATM Networks: Multiple Node Case,” Proc. of IEEE INFOCOM ’94, June 1994.
IEEE Communications Magazine • August 1997
BIOGRAPHIES SUJATA BANERJEE [S ’84] (
[email protected]) is an assistant professor of telecommunications at the University of Pittsburgh. She received a Ph.D. in electrical engineering from the University of Southern California in 1993. She also holds B.Tech. (1987) and M.Tech. (1988) degrees in electrical engineering from the Indian Institute of Technology, Bombay. Her primary research interests include high-speed computer communication networks: protocols and performance, and distributed database systems. She has also worked on reliability issues in distributed systems and shape recognition in image processing systems. She has served on the technical program committee of INFOCOM ‘96 and INFOCOM ‘97 conferences and is an associate editor for the IEEE Transactions on Reliability. DAVID TIPPER (
[email protected]) is an associate professor of telecommunications in the Department of Information Science and Telecommunications at the University of Pittsburgh. Prior to joining Pitt in the Fall of 1994, he was an associate professor in the Electrical and Computer Engineering Department at Clemson University. Professor Tipper is a graduate of the University of Arizona (Ph.D. E.E. 1988, M.S.S.E. 1984) and Virginia Tech (B.S.E.E. 1980). He is a member of INFORMS, Sigma Xi, and Senior member of IEEE. M ARTIN B. H. W EISS (
[email protected]) is an associate professor of Telecommunications and is co-director of the Telecommunications Program at the University of Pittsburgh. He holds a Ph.D. in engineering and Public Policy from Carnegie Mellon University (1988) where he studied the standards development process under Professor Marvin A. Sirbu. He also holds an M.S.E. in computer, control, and information engineering from the University of Michigan (1979) and a B.S.E. in electrical engineering from Northeastern University (1978). His industrial experience includes technical and professional work at several R&D and consulting firms in the United States. From 1978–1981, he was a Member of the Technical Staff at Bell Laboratories; from 1983–1985, he was a Member of the Technical Staff at the MITRE Corp; and from 1985–1987 he was a senior consultant with Deloitte, Haskins, and Sells. ANIS KHALIL is an executive staff member, Network Technology and Planning group. Responsible for Architecture and Technology analysis and assessments. Held positions of Advisory Engineer and Senior Manager. Was responsible for the introduction of TCAP, international C7 signaling, dynamic routing, credit card validation, and other technologies in the MCI Network. Currently involved in the analysis and assessments of ATM, Core Transmission Technologies, Restoration and DBS. He holds a Ph.D. in telecommunications from the Ruhr Universitaet in Bochum, Germany. He joined MCI in 1990 and held positions at BNR and Hughes Network Systems.
133