Networks. As new communications services evolve, professionals must create better models to predict system performance. Victor S. Frost and Benjamin ...
Traffic Modeling For Telecommunications Networks As new communications services evolve, professionals must create better models to predict system performance. Victor S. Frost and Benjamin Melamed
VICTOR S. FROST is director of the Telecommunicationsand Information Sciences Laboratory at the Universiry of Kansas. BENJAMIN MELAMED is head of the Performance Anaiysvsis Depa flment, C&C Research Laboratories, NEC USA Inc.
70
he efficient flow of information is a key element in today’s technology and business environments. This flow is supported by a complex computer and communications infrastructurethat, if properly designed and operated, is invisibleto end users. High-speednetwork transport mechanisms, such as ATM, serve as enabling technologiesfor new classes of communicationsservices, such as multimedia andvideo on demand, that are typically grouped under the heading of B-ISDN. As these new communications services evolve and the needs of users change, the enterprise must respond by modifying existingcommunications systems or by implementing entirely new ones. To this end, telecommunicationsprofessionals are being called upon t o design and manage these systems in the face of fast-moving technology and a climate of increasing customer expectations. Design and management decisions require predictions of network performance; decisions based on poor predictionsmay adversely affectnetwork customers’ perception of the new technology. Analytical techniques, computer simulation, projections from existing experience, and experimentation are methods that are used to evaluate and compare network designs and protocols. Independent of the prediction methodology,however,designand management decisions often must be made with incomplete knowledge of impending user demands and how the system will evolve. The goal of this article is to provide an overview of computer simulation modeling for communications networks, as well as some important related modeling issues. This article is intended to be neither a detailed tutorial on computer simulation of communications networks, nor a monograph for experts in discrete-event simulation, nor a review of specific simulation tools (refer to [11in this issue); severalexcellent textsprovide comprehensive treatments of various aspects of simulation [2-lo]. Rather, we give a brief overview of discrete-event simulation and single out two
0163-6804/94/$04.00 0 1994 IEEE
important modeling issues that are germane to extant and emerging networks: traffic modeling and rare-event estimation. Monte Carlo computer simulation is a flexible performance prediction tool used widely in science and engineering. Its flexibility stems from the fact that it consists of a computer program that “behaves” like the system under study. Unlike analytical models, which often require many assumptions and are too restrictive for most real-world systems,simulationmodelingplaces fewrestrictionson the classesofsystemsunderstudy. For communications networks, developing a simulation program requires: Modeling random user demands for network resources. Characterizingnetwork resourcesneeded for processing those demands. Estimating system performance based on output data generated by the simulation. The operation of communications networks can be conveniently described by simulation programs. The stochastic nature of demands for network resources is modeled using pseudo-random number generators. The execution of a computer simulation model is comparable to conducting an in-vitro experiment on the target system. All in all, a Monte Carlo simulation program can serve as a flexible testbed for conducting system experimentation without disturbing production networks or constructingsoftwarehardware prototypes. Severalfactors contribute to the difficulty of successfully applying simulation technology to performance evaluation. To begin with, the nature of user demands for network resources may be incompletelyknown or poorly understood. Further, networks are in a perpetual state of flux, because user services and networkingtechnologiesconstantly alter usage patterns. Thus, any model of user traffic would necessarily be approximate or even speculative, especially when new services a r e under consideration. Traffic models are reviewed subsequently in this article.
IEEE Communications Magazine
March 1994
ing broadband networks. Using simulation to estimate theprobabilityofrare events and their effect on performance is problematic, because vast computational resources may be required to generate a sufficient number of events from which statistical estimates may be formed with adequate statistical confidence. Simulation techniques to estimate rare-event probabilities in communications networks are addressed in a following section. The rest of this article provides an overview of simulation, with a slant toward telecommunications networks, and discussions of two modeling issues of special significance to today’s networks: traffic models appropriate for high-speed networks and importance sampling as a tool for estimating rare-event probabilities in broadband networks.
Discrete-Event Simulation rom a high-level perspective, telecommunicaF tions networks can be seen as users who generate demands for network resources, and protocols
W Figure 1.DESflow design.
Simulation programs can be used to closelymodel the processing of user demands for network services. Such models can contain tremendous detail, especially for large networks. However, the execution of detailed models may require prohibitive amounts ofcomputationalresources. It isnot uncommon for network simulations to require days of processing time on a modern workstation. The analyst must be aware of the trade-off between model detail and simulation execution time. Frugal modeling is often called for, i.e., modeling that includes only those network functions that have an appreciable impact on the desired performance metrics. The simulation of a large and complex network is treated in a companion paper [Ill. Because executing a simulation is analogous to conducting an experiment involving randomness, simulation outputsmust be treated as random observations. In a similar vein, because a model is viewed as a faithful representation of the target system, instrumentation is required in order to collect statistics and formulate performance predictions. The successof a simulation study hinges on identifying appropriate performance metrics and then devising a strategy for exploring the ensuing performance response surface. A system response surface is rarely one-dimensional; more often, the desired response of the system is a function of aparametervector.For example,the cell-loss rate in an ATM network is a function of a set of congestion-control parameters. Correlation in the measured observations must be taken into account when forming statistical performance estimates. For example, positive autocorrelation in a sequence of delay times would manifest itself as bursts of long (short) delays: i.e., if message k has experienced a long (short) delay, then it is likely that message k + l will also experience a long (short) delay. The autocorrelated nature of samples obtained from simulation (or measurement records from operational systems) complicates the task of forming performance predictions. Methods such as replication, batch means, and regeneration are used to address sample dependence [ 2 ] .Furthermore, rare events, such as ATM cell losses, are key metrics that characterize the performance of emerg-
IEEE Communications Magazine
March 1994
(distributed algorithms) that control the allocation of network resources to satisfy those demands. The generation of user demands and their satisfaction are encapsulated in simulation events. which are ordered by their time of occurrence. The action of the protocols depends on the state of the network at the time the demand was issued. A simple routing algorithm, for instance, may send packets to the output link with the shortest buffer. This event-based processing lends itself to a method known as discrete-event simulation (DES) [12]. Most simulation tools for telecommunications networks are based on DES [I]. An important characteristic of DES models is that they keep time via simulation clocks, which change by random increments. The basic executable unit in DES models is an event (a program that is executed at discrete simulation times). In DES, the state of the simulated system is stored in a set of system state variables. Event routines cause state variables to be modified. An event list is used to control the execution sequence of these event routines; the list consists of events in increasing chronological order. Event routines can add or delete items from the event list, and pseudo-random number generators in the event routines provide the requisite randomness for modifying and scheduling of future events. From a high-level vi:wpoint, running a simulation is, in essence, the repeated execution of a loop, where at each iteration the most imminent event (the one with the earliest scheduled time) is executed in turn. A flow diagram for DES is shown in Fig. 1. Typicalevents in acommunicationsnetwork simulation include the arrival of demands for network resources. A description of network resources, which is needed to satisfy the demand, is associated with each arrival. The time between successive demand arrivals as well as the nature of the required network resources are important elements of traffic modeling to be discussed later. In communications network simulation, entities acted upon by event routines include calls, messages, packets, and cells. These entities are represented internally by data structures, which are often closely related to the messageipacket format defined by the protocol. For example, source and destination addresses as well as control infor-
-
The execution
ofa computer simulation model is comparable to conducting an in-vitro experiment on the target system.
71
-
An under-
standing of the nature of trafic in the taqet system and selection ofan appropriate random trafic model are critical to the success of the modeling enterprise.
mationand datamightbeorganizedinstandardpacket formats. A data structure representing a packet would contain these elements in addition to simulation-specific information. A packet-creation time stamp, for instance, could be used for statistics collection. The data field might contain a length indication or, in more detailed models, a pointer to another data structure that represents a network-layer packet. Such encapsulation of data structures is a common feature in communications networks and is also supported byobject-oriented programming languages. Clearly, every DES must have an initializationmechanism to establish the initial system state, statistical collection routines to obtain measurements, a post-processor to transform the collected statistics into the desired performance estimates, and a coordinating program to control the event list, post-processor, and initiation and termination of the simulation. Traffic modeling is a key element in simulating communications networks. A clear understanding of the nature of traffic in the target system and subsequent selection of an appropriate random traffic model are critical to the success of the modeling enterprise.
An Overview of Traffic Modeling n this section, we survey commonly used traffic Idamental models. Such models are employed in two funways: either aspart of an analyticalmodel, or to drive a discrete-event simulation. The most common modeling context is queueing, where traffic is offered t o a queue o r a network of queues and various performance measures are calculated. Simpletrafficconsistsof single arrivalsof discrete entities (packets, cells, etc). It can be mathematically described as a point process [13], consisting of a sequence of arrival instants T1,T2...,T,... measured from the originO;by convention, To = 0. There are two additional equivalent descriptions of point processes: counting processes and interarrival time processes. A counting process {N(t)}T& is a continuous-time, non-negative integer-valued stochastic process, where N(t)=max{n:T,< t } is the number of (traffic) arrivals in the interval (04. An interarrival time process is a non-negative random sequence {A,}T=l,where& = T, - T,-l is the length of the time interval separating the nth arrival from the previous one. The equivalence of these descriptions follows from the equality of events:
(k=l
k=l
1
since T , = E & l k . Unless otherwise stated, we assumethroughout that {A,} is a stationarysequence and that the common variance of the A , is finite. Compound traffic consists of batch arrivals; that is, arrivals may consist of more than one unit at an arrival instant T,. To fully describe compound traffic, one also needs to specify a nonwhere B, is negative random sequence {B,}y=1, the(random)numberofunitsinthebatch.Atahigh-
72
er level of abstraction, B , may represent some general attributes of the nth arrival, such as the amount of “ w o r k associated with the nth arrival or its itinerary in a network. Such compound trafficprocesses,calledmarkedpoint processes [14],are outside the scope of this article. Discrete-time traffic processescorrespond to the case when time is slotted.Mathematically,this means that the random variables A , can assume only integervalues, or equivalently,that the randomvariables N(t) are allowed to increase only at integervalued time instants T,. Traffic processes are used to drive simulations in several ways, all of which use one o r more pseudo-random number streams t o generate sequences of random variables via appropriate transformations. To emphasize this point, we shall use the term randomly generated to refer to such computer-generated random sequences. In the simplest case, a simulation only needs to randomly generate a sequence of interarrival times {A,}. The traffic-generation mechanism that would be contained in the event algorithmsis straightforward. Initially, the simulation clock is set to To=O. Next, A1 is randomly generated and an arrival event is scheduled for time TI = A l . This arrival event is placed on the chronologically-ordered event list or calendar.Eventually,that arrival eventwill become the most imminent one, the simulation clock will be set t o A l , and that arrival event will be processed. Arrival generation proceeds inductively. At simulation time T,, the nth arrival event is processed, the next interarrival time A,+ is randomly generated, and an arrival event is scheduled for simulation time T,+1 = T, .+ A,+1 and so on. For compoundtraffc, the simulationrandomly generates a batch size B, (in addition to the interarrival time A,), and implements the arrival of B , units at simulation time T,. Most models call for the sequences {A,} and {B,} to be stochastically independent. In addition to arrival times and batch sizes, it is often useful (and sometimes essential) to incorporate thenotionofworkloadintothetrafficdescription. The workload is a general concept describing the amount of work { W,} brought to a system by thenthanivingunit;itisusuallyassumedindependent of interarrival times andbatchsizes. Atypicalexample is the sequence of service time requirements of arrivals at a queueing system, although in queueing, one usually refers to the arrival process alone as traffic. On the other hand, traffic reduces to workload description when interarrival times are deterministic.Acase in point iscompressedvideo, also known as VBR (variable bit rate) video, where coded frames (arrivals) have variable and random size (bit rate), and these must be delivered deterministically every 1/30 of a second or so, for high-quality video. The workload consists of coded frame sizes (say, in bits), because frame size is roughly proportional to its transmission time (service requirement). In this article, we describe generic models that can be used to randomly generate any component of traffic description, be it { A , } , illn}, or { W,}, but we emphasize simple traffic, described by { A , } . We also point out that different traffic streams, corresponding to different telecommunications services (voice, video, file transfer, etc.)
IEEE CommunicationsMagazine March 1994
can be superposed (multiplexed) to form a realistic heterogeneous mixture of traffic.
Traffic Burstiness A recurrent theme relating to traffic in broadband networks is the traffic “burstiness” exhibited by key services such as compressed video, file transfer, etc. Burstiness is present in a traffic process if the arrival points { T , } appear to form visual clusters; that is, { A , } tends to give rise to runs of several relatively short interarrival times followed by a relatively long one. The mathematical underpinning of burstiness is more complex. Two main sources of burstiness are due to the shapes of the marginal distribution and autocorrelation function of { A , } . For example, burstiness would be facilitated by a bimodal marginal distribution of { A a } ,or by short-term autocorrelations in { A , } . Strong positive autocorrelations are a particularly major cause of burstiness. Since there seems to be no singlewidely-acceptednotion of burstiness, we shall briefly describe some of the commonly-used mathematical measures that attempt to capture it. The two simplest measures of burstiness take account only of first-order properties of traffic (they are each a function of the marginal distribution only of interarrival times). The first one is the ratio of peak rate to mean rate - a very crude measure, which also has the shortcoming of dependence on the interval length utilized for rate measurement. A more elaborate measure of burstiness is the coefficient of variation, defined as the ratio of standard deviation to mean cA=o[A,]/E[A,]of interarrival intervals. In contrast, thepeakednessmeasure [15]and the index-of-dispersion measure [ 161 do take account of temporal dependence in traffic (second-order properties). Foragiven time interval of length z, the index of dispersion for counts (IDC) is the function ZC(2)= Vur[N(z)]/E[N(z)]; i.e., the varianceto-mean ratio of the number of arrivalsin the interval [0,2]. Since the number of arrivals is related to the sum of interarrival intervals via Eq. (l),the numerator of the IDCincludes the autocorrelations of {A,}.The peakedness concept is related, but more involved. Assume that the traffic stream { A , } is offered to an infinite server group consistingof independent servers with common service time distribution F . Let S be the equilibrium number of busy servers. The peakedness is the functional zA[F‘]= Var[S]/E[S], which maps a service time distribution to a real number. A commonly used peakedness is Z ~ ~ ~ ( obtained O), as a limiting case for an exponential service distribution with service rate approaching 0. Finally, the Hurst parameter [40] can be used as a measure of burstiness via the concept of selfsimilarity. This notion is discussed in a following section. Renewal Traffic Models This section introduces renewal trafficprocesses and the important special cases of Poisson and Bernoulli processes. Renewal models have a long history, because of their relative mathematical simplicity. In a renewal traffic process, the A , are independent, identicallydistributed (IID),but their distribution is allowed to be general. Unfortunately, with few exceptions, the superposition of independent renewal processes does not yield a
IEEE Communications Magazine
March 1994
renewal process. The ones that do, however, occupy a special position in traffic theory and practice. Queueing models historically have routinely assumed a renewal-offered traffic. Renewal processes, while simple analytically, have a severe modeling drawback - the autocorrelation function of { A , } vanishes identically for all nonzero lags. The importance of capturing autocorrelations stems from the role of the autocorrelation function as a statistical proxy for temporal dependence in time series. Moreover, recall that positive autocorrelations in { A , } can explain, to a large extent, the phenomenon of traffic burstiness. Bursty traffic is expected to dominate broadband networks, and when offered to a queueing system, it gives rise to much worse performance (such asmean waiting times) ascompared to renewal traffic (which lacks temporal dependence); see [17] for a detailed discussion. Consequently, models that capture the autocorrelated nature of traffic are essential for predicting the performance of emerging broadband networks. Poisson Processes - Poisson models are the
oldest traffic models, dating back to the advent of telephony and the renowned pioneering telephone engineer A. K. Erlang. A Poisson process can be characterized as a renewal process whose interarrival times { A , } are exponentially distributed with rate parameter h: P { A , 5 t } = 1 exp (-ht) [13]. Equivalently, it is a counting process, satisfying P{N(t)=n}=exp(-hr)(ht)”/n!, and the number of arrivals in disjoint intervals is statistically independent (a property known as independent increments). Poisson processes enjoy some elegant analytical properties. First, the superposition of independent Poisson processes results in a new Poisson process whose rate is the sum of the component rates. Second, the independent increment property renders Poisson a memoryless process. This, in turn, greatly simplifies queueing problems involving Poisson arrivals. Third, Poisson processes are fairly common in traffic applications that physically comprise a large number of independent traffic streams, each of which may be quite general. The theoretical basis for this phenomenon is known as Palm’s Theorem [18]. It roughly states that under suitable but mild regularity conditions, such multiplexed streams approach a Poissonprocess as the number of streams grows,but the individualrates decrease so as to keep the aggregate rate constant. Thus, traffic streams on main communications arteries are commonly believed to follow a Poisson process, as opposed to traffic on upstream tributaries, which are less likely to be Poisson. However, traffic aggregation (multiplexing) need not always result in a Poisson stream. A counter-example is provided in the section on self-similar traffic models that follows. Time-dependent Poisson processes are defined by letting the rate parameter h depend on time. Compound Poisson processes are defined in the obvious way, by specifying the distribution of the batch size, B,, independent of the&
-
A recurrent
theme relating to trafic in broadband networks is the trafic “burstiness” exhibited by key services such as compressed video, file transfer; and so forth.
BernoulliProcesses-Bernoulli processes are the
discrete-time analog of Poisson processes (timedependent and compound Bernoulli processes are defined in the natural way). Here the probabilib
73
-
Markovmodulated models constitute an extremely important class of trafic models.
of an arrival in any time slot isp, independent of any other one. It follows that for slot k , the correspondin number of arrivals is binomial, P{Nk = n}=( 3pr1(l- p ) k -,, n between 0 and k. The time between arrivals is geometric with parameterp: P{A,=j}=p(l - p ) i , j being a nonnegative integer. Phase-type Renewalfrocesses-An important specialcase of renewal models occurswhen the interarrival times are of the so-called phase type. Phase-type interarrival times can be modeled as the time toabsorptionin acontinuous-timeMarkovprocess C={C(t)}T==, with state space { O , l , . , . , m } ; here,stateOis absorbing,allother statesare transient, and absorption is guaranteed in a finite time. To determine A,, start the process C with some initial distributionIT.When absorption occurs (i.e., when the process enters state O), stop the process. The elapsed time is& which implies that it is a probabilisticmixtureof sums of exponentials.Then, restart with the same initial distribution n and repeat the procedure independently to get A,+1. Phase-type renewal processes give rise to relatively tractable traffic models. They also enjoy the property that any inter-arrival distribution can be approximated arbitrarily closely by phase-type distributions.
Markov and Markov-Renewal Traffic Models Unlike renewal traffic models, Markov and Markov-renewal traffic models introduce dependence into the random sequence {A,} [13]. Consequently, they can potentially capture traffic burstiness, because of nonzero autocorrelations in {A,}. Consider a continuous-time Markov process M= {M(t)}T=owithadiscrete state space. In thiscase, M behaves as follows: it stays in a state i for an exponentially distributed holding time with parameter &,whichdependsoni alone; it then jumps to statej with probabilityp,., such that the matrix P=[pii]isaprobabilitymatrix(131.In asimple Markov traffic model, each jump of the Markov process is interpreted as signaling an arrival, so interarrival times are exponential, and their rate parameters depend on the state from with the jump occurred. This results in dependence among interarrival times as a consequence of the Markov property. Markovmodels in slotted time can be defined for the process {A,} in terms of a Markov transition matrixP= [Pg] [13]. Here, stateicorrespondstoiidle slotsseparating successivearrivals,andpGis the probability of aj-slot separation, given that the previous one was an i-slot separation. Arrivals may be single units, a batch of units, or a continuous quantity. Batches may themselves be described by a Markovchain, whereas continuous-state, discretetime Markov processes can model the (random) workload arriving synchronously at the system. In all cases, the Markov property introduces dependence into interarrival separation, batch sizes and successive workloads, respectively. Markov-renewal models are more general than discrete-state Markov processes, yet retain a measure of simplicity and analytical tractability. A Markov renewal process R=((M,,z,)};==, is defined by a Markov chain {M,} and its associated jump times {T,}, subject to the following con-
74
straint: the pair (M,+~,T,+,)of next state and inter-jump time depends only on the current state M,, but not on previous states nor on previous inter-jump times. Again, ifwe interpretjumps (transitions) of {M,} as signaling arrivals, we would havedependence in the arrival process. Also,unlike the Markov process case, the interarrival times can be arbitrarily distributed, and these distributions depend on both states straddling each interarrival interval [13]. The Markovian Arrival Process (MAP) is a broad andversatile subclass of Markov renewal traffic processes, enjoyinganalyticaltractability [191.Here, the interarrival times are phase-type but with a wrinkle: traffic arrivals still occur at absorption instants of the auxiliary Markov process M, but the latter is not restarted with the same initial distribution; rather, the restart state depends on the previous transient state from which absorption had just occurred. While MAP is analyticallysimple, it enjoys considerable versatility. Its formulation includes Poisson processes, phase-type renewal processes, and others as special cases [19]. It also has the appealing propertythat the superposition of independent MAP traffic streams results in a MAP traffic stream governed by a Markov process whose state space is the cross product of the component state spaces.
Mark0 v-Modulafed Traffic Models Markov-modulated models constitute an extremely important class of traffic models. The idea is to introduce anexplicit notionofstateinto thedescription of a traffic stream - an auxiliary Markov process is evolving in time and its current state controls (modulates) the probability law of the traffic mechanism. LetM= {M(t)};”=o be acontinuous-time Markov process, with state space {1,2, ..m} (more complicated state spaces are possible). Now assume that while M is in state k, the probability law of traffic arrivals is completelydetermined byk, and this holds for every 1 I k 5 m. Note that when M undergoes a transition to, say, state j , then a new probability law for arrivals takes effect for the duration of state j , and so on. Thus, the probability law for arrivals is modulated by the state of M (such systems are also called doubly stochastic, but the term “Markovmodu1ation”makes it clearer that the traffic is stochastically subordinated to M). The modulating process certainly can be more complicated than a continuous-time, discretestate Markovprocess (so the holding timesneed not be restricted to exponential random variables), but such models are far less analytically tractable. For example,Markov Renewal-modulated processes constitute a natural generalization of Markov-modulated processes with generally-distributed interarrival times, but those will not be reviewed here. Markov-Modulated Poisson Processes The most commonlyused Markov-modulated model is the Markov-Modulated Poisson Process (MMPP) model, which combines the simplicity of the modulating (Mark0v)processwith that of the modulated (Poisson) process. In this case, the modulation mechanism simply stipulates that in state k of M, arrivals occur according to a Poisson process at rate hk. As the state changes, so does the rate. MMPP models can be used in a number of ways.
IEEE Communications Magazine March 1994
Consider first a single traffic source with a variable rate. A simple traffic model would quantize the rate into a finite number of rates, and each rate would give rise to a state in some Markov modulating process. It remains to verify that exponential holding times of rates are an appropriate description, but the Markov transition matrix Q=[Qkj]of the putative M can be easily estimated from empirical data: simply quantize the empirical data, and then estimate Qk, by calculating the fraction of times that M switched from state k to statej. As asimple example,consider a two-state MMPP model, where one state is an “on” state with an associated positive Poisson rate, and the other is an “off” state with associated rate zero (such models are also known as interrupted Poisson for obvious reasons). These models have been widely used to model voice traffic sources [20];the “on” state corresponds to a talk spurt (when the speaker emits sound), and the “off” state corresponds to a silence (when the speaker pauses for a break). This basic MMPP model can be extended to aggregations of independent traffic sources, each of which is an MMPP, modulated by an individual Markov process M;, as described previously. Let J ( t ) = (Jl(t),J2(t), ... J r ( t ) ) , where J;( t ) is the number of active sources of traffic type i, and let M ( t )= ( M l ( t ) , M 2 ( t ) ,.. M r ( t ) )be the corresponding vector-valued Markov process taking values on all r-dimensional vectors with non-negative integer components. The arrival rate of class i traffic in state ( j l j 2 , ...jr) of M ( t ) is j;hi. Transition-Modulated Processes - Transition-modulated processes are a variation on the state modulation idea. Essentially, the modulating agent is a state transition rather than a state per se. A state transition, however, can be described simply by a pair of states, whose components are the one before transition and the one after it. The generalization of a transition-modulated traffic model to continuous time is straightforward (the model in discrete time is described in [21]).LetM= {M(t)}T=obe a discrete-time Markov process on the positive integers. State transitions occur on slot boundaries, and are governed by an m x m Markov transition matrix Q=[Qi,]. L e t B , d e n o t e t h e n u m b e r of a r r i v a l s i n s 1o t n , and assume that the probabilities P { B , = k (M,=i,M,+I=j} = t i j ( k ) , are independent of any past state information (the parameters t l j ( k )are assumed given). Notice that these probabilities are conditioned on transitions, (M,,M,+l), of M from state M , to state M,+, during slot n. Furthermore, the number of traffic arrivals during slot n is completely determined by the transition of the modulating chain (through the parameters trj(k)). Markov-modulated traffic models are a special case of Markovian transition-modulated ones: simply take the special case when the conditioning event is {M,=i}. That is, tl,(k)=ti(k)depends only on the state i of the modulating chain in slot n, butisindependentofitsstatejinthenextslotn+ 1. Conversely, Markovian transition-modulated processes can be thought of as Markov-modulated ones, but on a larger state space. Indeed, if {M,} is Markov, so is the process {(M,,M,+l)}
IEEE Communications Magazine
March 19Y4
of its transitions. As before, multiple transition-modulated traffic models can be defined, one for each traffic class of interest. The complete traffic model is obtained as the superposition of the individual traffic models. For queueing studies in discrete time, anotherwrinkle is the assignment of priorities to different classes, so as to order their arrivals in a buffer [21].
Fluid Traffic Models The fluid traffic paradigm dispenses with individual traffic units. Instead, it views traffic as a stream of fluid, characterized by a flow rate (such as bits per second), so that a traffic count is replaced by a traffic volume. Fluid models are appropriate to cases where individual units are numerous relative to a chosen time scale. In other words, an individual unit is by itself of little significance, just as one molecule more or less in a water pipeline has but an infinitesimal effect on the flow. In the B-ISDN context of ATM, all packets are fixed-size cells of relatively short length (53 bytes); in addition, the high transmission speeds (say, on the order of a gigabit per second) render the transmission impact of an individual cell negligible. The analogy of a cell to a fluid molecule is a plausible one. T o further highlight this analogy, contrast an ATM cell with a much bigger transmission unit, such as a coded (compressed) high-quality video frame, which may consistof a thousand cells. A traffic arrival stream of coded frames should be modeled as a discrete stream of arrivals, because such frames are typically transmitted at the rate of 30 frames per second. A fluid model, however, is appropriate for the constituent cells. Although an important advantage of fluid models is their conceptual simplicity,important benefits will also accrue to a simulation model of fluid traffic. As an example, consider again a broadband ATM scenario. If one is to distinguish among cells, then each of them would have to count as an event. The time granularity of event processing would be quite fine, and consequently, processing cell arrivals would consume vast CPU and possibly memory resources, even on simulated time scales of minutes. A statistically meaningful simulation may often be infeasible. In contrast, a fluid simulation would assume that the incoming fluid flow remains (roughly) constant over much longer time periods. Traffic fluctuations are modeled by events signaling a change of flow rate. Because these changes can be assumed to happen far less frequently than individual cell arrivals, one can realize enormous savings in computing. In fact, infeasible simulations of cell arrival models can be replaced by feasible simulations of fluid models of comparable accuracy. In a queueing context, it is easy to manipulate fluid buffers. Furthermore, the waiting time concept simply becomes the time it takes to serve (clear) the current buffer, and loss probabilities (at a finite buffer) can be calculated in terms of overflow volumes. Because fluid models assume a deterministic service rate, these statistics can be readily computed. Typically, though, larger traffic units (such as coded frames) are of greater interest than individual cells. Modeling the larger units as discrete traffic and their transport as fluid flow would give us the best of both worlds: we can measure wait-
-
The fluid trafic paradigm dispenses with individual trafic units. Instead, it views trafic as a stream of fluid, characterized by a flow rate, so that a trafic count is replaced by a trafic volume.
75
-
TES models provide another modeling approach geared toward capturing both marginals and autocorrelations of empirical records simultaneously, trafic included.
ing times and loss probabilities and enjoy savings on simulation computing resources. Typical fluid models assume that sources are bursty - of the “on-off” type [22,23]. While in the “off” state, traffic is switched off, whereas in the “on” state traffic arrives deterministically at a constant rate L.For analytical tractability, the duration of “on” and “off” periods are assumed t o be exponentially distributed and mutually independent (that is, they form an alternatingrenewa1 process). A Markov model of a set of quantized (fluid) traffic rates is presented in [24]. Fluid traffic models of these types can be analyzed as Markov-modulated constant rate traffic. The host of generalizations, described above for MMPP, carries over t o fluid models as well, including multiple sources and multiple classes of sources.
Autoregressive Traffic Models Autoregressive models define the next randomvariable in the sequence as an explicit function of previous ones within a time window stretching from the present into the past. Such models are particularly suitable for modeling VBR-codedvideo-a projected major consumer of bandwidth in emerging high-speed communicationsnetworks. The nature of video frames is such that successive frames within a video scene vary visually very little (recall that there are 30 frames per second in a highquality video). Only scene changes (and other visual discontinuities) can cause abrupt changes in frame bit rate. Thus, the sequence of bit rates (frame sizes) comprising a video scene may be modeled by an autoregressive scheme (later, we describe another modeling approach), while scene changes can be modeled by some modulating mechanism, such as a Markov chain. LinearAutoregressiveModels- The class of knear autoregressive models [25] has this form:
x, = U0 + $a,x,,
+E,
, n > 0 , (2)
path spikes due to video scene changes. More complicated models, such as MA, ARMA, andARIMAareoutside thescopeofthisarticle [25]. Autoregressive models are typically used t o fit the empirical autocorrelation function, but theycannot generallyfit the empirical marginal distribution. TES Models -Transform-expand-sample (TES) models provide a n o t h e r modeling approach geared toward capturing both marginals and autocorrelations of empirical records simultaneously [28, 291, traffic included [30]. The empirical TES methodology assumes that some stationary empirical time series (such as traffic measurements over time) is available. It aims to construct a model satisfyingthe following three fidelity requirements, simultaneously: The model’s marginal distribution should match its empirical counterpart (a histogram, in practice). The model’s leading autocorrelations should approximate their empirical counterparts up to a reasonable lag. The sample path realizations (histories) generated by simulating the model should “resemble” the empirical records. The first two are precise quantitative requirements, whereas the third is a heuristic qualitative one. Nevertheless, it is worth adopting this subjective requirement and keeping its interpretation at the intuitive level; after all, common sense tells us that if a model gives rise to time series which a r e entirely divorced in “appearance” from observed ones, then this would weaken our confidence in the model, and vice versa. TES processes come in two flavors: TES’ and TES-. T h e superscript (plus o r minus) is a mnemonic reminder of the fact that they give rise to TES processes with positive and negative lag-1 autocorrelations, respectively. TES models consist of two stochastic processes in lockstep, called background and foreground sequences,respectively. Background TES sequences have this form:
.-1
whereXo, ...,Xp-l are prescribed randomvariables, the U , a r e real constants, and the E, are zeromean, IID randomvariables, called residuals,which are independent of the X,. Eq. 2describesthesimplestformofalinearautoregression scheme, calledAR@), w h e r e p is the order of the autoregression. In a good model, the residuals ought to be of a smaller magnitude than theX,, in order to “explain” the empirical data. The recursive form in Eq. 2 makes it clear how to randomly generate the next random element in the sequence {X,};=ofrom a previous one: this simplicity makes AR schemes popular candidates formodeling autocorrelated traffic. Asimple AR(2) model has been used to modelvariablebit rate (VBR) codedvideo [26]. More elaborate modelscanbeconstructed o u t ofAR@) models combined with other schemes. For example, video bit rate traffic wasmodeledasasum,R,=X,+Y,+K,C,,where the first two termscomprise independentAR( 1)schemes and the third term is a product of a simple Markov chain and an independent normal variate from an IID normal sequence [27]. The purpose of having two autoregressive schemes was to achieve a better fit to the empirical autocorrelation function; the third term was designed to capture sample
76
Here, Uoisdistributeduniformlyon[0,1); {Vn}T=l is a sequence of IID random variables, independent of U,, called the innovationsequence, and angular brackets denote the modulo-1 (fractional part) operator (x) = x - maxiinteger n: n 5 x}. Background sequences play an auxiliary role. The real target are foreground sequences:
X i = D(U:), X,=D(U,)
,
where D is a transformation from [0,1) to the reals, called a distortion. It can be shown that all background sequences are Markovian stationary, and their marginal distribution is uniform on [0,1), regardless of the probability law of the innovations { Vn}[28]. However, the transition structure { U ; } is time invariant, while that of {U,} is time dependent. The inversion method allows us to transform any background uniform variates to foreground ones with an arbitrary marginal distribution [31]. To illustrate this idea, consider an empirical time series Y={Y,}$o, from which one computes an empirical density h y and its associated distribution
IEEE Communications Magazine * March 1994
-
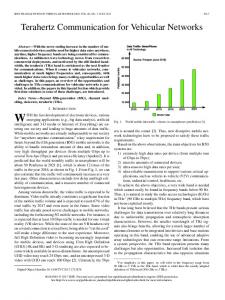
W Figure 2.A TEStool screen displaying a TES multiplex model of MPEG-compressed VBR video.
function H y . Then, the random variable X = H $ (U) has densityhy. Thus, TES foreground sequences can match any empirical distribution. The empirical TES methodology actuallyemploys a composite two-stage distortion:
whereH? is the inverse of the empirical histogram distribution based on Y , and Sg is a “smoothing” operation, called a stitching transformation, parameterized by05 E,< 1,andgivenby: %(y) =
[i1%o s a < t (1-5) ,
5