TRAFFIC SIGN RECOGNITION with Constellations of Visual Words
Toon Goedem´e De Nayer Instituut, Jan De Nayerlaan 5, 2860 Sint-Katelijne-Waver, Belgium
[email protected]
Keywords:
traffic sign recognition, local features, SURF, embedded.
Abstract:
In this paper, we present a method for fast and robust object recognition. As an example, the method is applied to traffic sign recognition from a forward-looking camera in a car. To facilitate and optimise the implementation of this algorithm on an embedded platform containing parallel hardware, we developed a voting scheme for constellations of visual words, i.e. clustered local features (SURF in this case). On top of easy implementation and robust and fast performance, even with large databases, an extra advantage is that this method can handle multiple identical visual features in one model.
1
INTRODUCTION
One of the key upcoming technologies making cars safer to drive with is automatic recognition of road signs. An on-board camera installed in the car observes the road ahead. Intelligent computer vision algorithms are being developed that enable the detection and recognition of various objects in these images: traffic lane markings, pedestrians, obstacles, . . . Here, we focus on the recognition of traffic signs. Based on recognition results, certain alerts can be sent to the driver, e.g. a warning if the current speed of the car is higher than the speed limit declared in the traffic sign. Because that the appearance of a certain traffic sign is fixed (even described by law), the detection is quite a bit easier than e.g. the detection of pedestrians. Nevertheless, in real-life experiments substantial appearance variation is measured, mainly due to different light conditions, viewpoint changes, ageing of the traffic sign, deformations and even vandalism. We can conclude that a robust method is needed. The remainder of this text is organised as follows. Section 2 gives an overview of relevant related work. In section 3, our algorithm is described. Some real life experiments are presented in section 4. The paper ends with a conclusion in section 5.
2
RELATED WORK
Real-time road sign recognition has been a research topic for many years. This problem is often addressed in a two-stage procedure involving detection and classification. In contrast, our solution is an allin-one operation which more likely leads to a faster algorithm. An other difference with related work in the field is that our solution does not rely on template matching (Rosenfeld and Kak, 1976), colour (Zhu and Liu, 2006), the detection of geometrical basis shapes (Garcia-Garrido et al., 2006), or canny edges (Sandoval et al., 2000). Moreover, our solution is not limited to certain traffic sign shapes (Ballerini et al., 2005). We use clusters of local image features (SURF) to robustly describe the appearance of the traffic sign. A few years ago, a major revolution in the object recognition field was the appearance of the idea of local image features (Tuytelaars et al., 1999; Lowe, 1999). Indeed, looking at local parts instead of the entire pattern to be recognised has the inherent advantage of robustness to partial occlusions. In both template and query image, local regions are extracted around interest points, each described by a descriptor vector for comparison. The development of robust local feature descriptors, like e.g. Mindru’s generalised colour moment based ones (Mindru et al.,
1999), added robustness to illumination and changes in viewpoint. Many researchers proposed algorithms for local region matching. The differences between approaches lie in the way in which interest points, local image regions, and descriptor vectors are extracted. An early example is the work of Schmid and Mohr (Schmid et al., 1997), where geometric invariance was still under image rotations only. Scaling was handled by using circular regions of several sizes. Lowe et al. (Lowe, 1999) extended these ideas to real scaleinvariance. More general affine invariance has been achieved in the work of Baumberg (Baumberg, 2000), that uses an iterative scheme and the combination of multiple scales, and in the more direct, constructive methods of Tuytelaars & Van Gool (Tuytelaars et al., 1999; Tuytelaars and Gool, 2000), Matas et al. (Matas et al., 2002), and Mikolajczyk & Schmid (Mikolajczyk and Schmid, 2002). Although these methods are capable to find very qualitative correspondences, most of them are too slow for use in a real-time application as the one we envision here. Moreover, none of these methods are especially suited for the implementation on an embedded computing system, where both memory and computing power must be as low as possible to ensure reliable operation at the lowest cost possible. The classic recognition scheme with local features, presented in (Lowe, 1999; Tuytelaars and Gool, 2000), and used in many applications such as in our previous work on robot navigation (Goedem´e et al., 2005; Goedem´e et al., 2006), is based on finding one-on-one matches. Between the query image and a model image of the object to be recognised, bijective matches are found. For each local feature of the one image, the most similar feature in the other is selected. This scheme contains a fundamental drawback, namely its disability to detect matches when multiple identical features are present in an image. In that case, no guarantee can be given that the most similar feature is the correct correspondence. Such pattern repetitions are quite common in the real world, though, especially in man-made environments. To reduce the number of incorrect matches due to this phenomenon, in classic matching techniques a criterion is used such as comparing the distance to the most and the second most similar feature (Lowe, 1999). Of course, this practice throws away a lot of good matches in the presence of pattern repetitions. In this paper, we present a possible solution to this problem by making use of the visual word concept. Visual words are introduced (Sivic and Zisserman, 2003; Li and Perona, 2005; Zhang et al., 2005)
in the context of object classification. Local features are grouped into a large number of clusters with those with similar descriptors assigned into the same cluster. By treating each cluster as a visual word that represents the specic local pattern shared by the keypoints in that cluster, we have a visual word vocabulary describing all kinds of such local image patterns. With its local features mapped into visual words, an image can be represented as a bag of visual words, as a vector containing the (weighted) count of each visual word in that image, which is used as feature vector in the classication task. In contrast to the in categorisation often used bag-of-words concept, in this paper we present the constellation-of-words model. The main difference is that not only the presence of a number of visual words is tested, but also their relative positions.
3
ALGORITHM
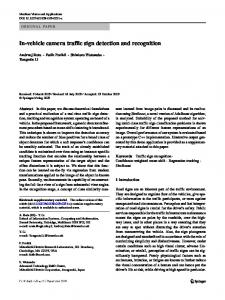
Fig. 1 gives an overview of the algorithm. It consists of two phases, namely the model construction phase (upper row) and the matching phase (bottom row). First, in a model photograph (a), local features are extracted (b). Then, a vocabulary of visual words is formed by clustering these features based on their descriptor. The corresponding visual words on the image (c) are used to form the model description. The relative location of the image centre (the anchor) is stored for each visual word instance (d). The bottom row depicts the matching procedure. In a query image, local features are extracted (e). Matching with the vocabulary yields a set of visual words ( f ). For each visual word in the model description, a vote is cast at the relative location of the anchor location (g). The location of the object can be found based on these votes as local maxima in a voting Hough space (h). Each of the following subsections describes one step of this algorithm in detail.
3.1 Local Feature Extraction We chose to use SURF as local feature detector, instead of the often used SIFT detector. SURF (Bay et al., 2006; Fasel and Gool, 2007) is developed to be substantially faster, but at least as performant as SIFT. 3.1.1 Interest Point Detector In contrast to SIFT (Lowe, 1999), which approximates Laplacian of Gaussian (LoG) with Difference
Figure 1: Overview of the algorithm. Top row (model building): (a) model photo, (b) extracted local features, (c) features expressed as visual words from the vocabulary, (d) model description with relative anchor positions for each visual word. Bottom row (matching): (e) query image with extracted features, ( f ) visual words from the vocabulary, (g) anchor position voting based on relative anchor position, (h) Hough voting space.
Figure 2: Left: two filters based on Gaussian derivatives. Right: their approximation using box filters.
of Gaussians (DoG), SURF approximates second order Gaussian derivatives with box filters, see fig. 2. Image convolutions with these box filters can be computed rapidly by using integral images as defined in (Viola and Jones, 2001). Interest points are localised in scale and image space by applying a non-maximum suppression in a 3 × 3 neighbourhood. Finally, the found maxima of the determinant of the approximated Hessian matrix are interpolated in scale and image space. 3.1.2 Descriptor In a first step, SURF constructs a circular region around the detected interest points in order to assign a unique orientation to the former and thus gain invariance to image rotations. The orientation is computed using Haar wavelet responses in both x and y direction as shown in the middle of fig. 3. The Haar wavelets can be easily computed via integral images, similar
Figure 3: Middle: Haar wavelets. Left and right: examples of extracted SURF features.
to the Gaussian second order approximated box filters. Once the Haar wavelet responses are computed, they are weighted with a Gaussian centred at the interest points. In a next step the dominant orientation is estimated by summing the horizontal and vertical wavelet responses within a rotating wedge, covering an angle of π3 in the wavelet response space. The resulting maximum is then chosen to describe the orientation of the interest point descriptor. In a second step, the SURF descriptors are constructed by extracting square regions around the interest points. These are oriented in the directions assigned in the previous step. Some example windows are shown on the right hand side of fig. 3. The windows are split up in 4 × 4 sub-regions in order to retain some spatial information. In each sub-region, Haar wavelets are extracted at regularly spaced sample points. In order
Figure 4: Illustrating the SURF descriptor.
to increase robustness to geometric deformations and localisation errors, the responses of the Haar wavelets are weighted with a Gaussian, centred at the interest point. Finally, the wavelet responses in horizontal dx and vertical directions dy are summed up over each sub-region. Furthermore, the absolute values |dx | and |dy | are summed in order to obtain information about the polarity of the image intensity changes. The resulting descriptor vector for all 4 × 4 sub-regions is of length 64. See fig. 4 for an illustration of the SURF descriptor for three different image intensity patterns. More details about SURF can be found in (Bay et al., 2006) and (Fasel and Gool, 2007). 3.1.3 Visual Words As explained before, the next step is forming a vocabulary of visual words. This is accomplished by clustering a big set of extracted SURF features. It is important to build this vocabulary using a large number of features, in order to be representative for all images to be processed. The clustering itself is easily carried out with the k-means algorithm. Distances between features are computed as the Euclidean distance between the corresponding SURF descriptors. Keep in mind that this model-building phase can be processed off-line, the real-time behaviour is only needed in the matching step. In the fictive ladybug example of fig. 1, each visual word is symbolically presented as a letter. It can be seen that the vocabulary consists of a file linking each visual word symbol with a mean descriptor vector of the corresponding cluster.
3.2 Model Construction All features found on a model image are matched with the visual word vocabulary, as shown in fig. 1 (c). In addition to the popular bag-of-words models, which consist of a set of visual words, we add the relative constellation of all visual words to the model description.
Figure 5: The position of the anchor point is stored in the model as polar coordinates relative to the visual word scale and orientation.
Each line in the model description file consists of the symbolic name of a visual word, and the relative coordinates (rrel , θrel ) to the anchor point of the model item. As anchor point, we chose for instance the centre of the model picture. These coordinates are expressed as polar coordinates, relative to the individual axis frame of the visual word. Indeed, each visual word in the model photograph has a scale and an orientation because it is extracted as a SURF feature. Fig. 5 illustrates this. The resulting model is a very compact description of the appearance of the model photo. Many of these models, based on the same visual word vocabulary, can be saved in a compact database. In our traffic sign recognition application, we build a database of all different traffic signs to be recognised.
3.3 Matching This part of the algorithm is time-critical. We are spending lots of efforts in speeding up the matching procedure, in order to be able to implement it on an embedded system. The first operation carried out on incoming images is extracting SURF features, exactly as described in section 3.1. After local feature extraction, matching is performed with the visual words in the vocabulary. We used Mount’s ANN (Approximate Nearest Neighbour) (Arya et al., 1998) algorithm for this, which is very performant. As seen in fig. 1 ( f ), some of the visual words of the object are recognised, amidst other visual words. 3.3.1 Anchor Location Voting Because each SURF feature has a certain scale and rotation, we can reconstruct the anchor pixel location by using the feature-relative polar coordinates of the object anchor. For each instance in the object model
description, this yields a vote for a certain anchor location. In fig. 1 (g), this is depicted by the black lines with a black dot at the computed anchor location. Ideally, all these locations would coincide at the correct object centre. Unfortunately, this is not the case due to mismatches and noise. Moreover, if there are two identical visual words in the model description of an object (as in the ladybug example for words A, C and D), each detected visual word of that kind in the query image will cast to different anchor location votes, of which only one can be correct. Figure 6: Some model photos from the traffic sign library.
3.3.2 Object Detection For all different models in the database, anchor location votes can be quickly computed. Next task is to decide where a certain object is detected. Because a certain object can be present more than once in the query image, it is clear that a simple average of the anchor position votes is not a sufficient technique, even if robust estimators like RANSAC are used to eliminate outliers. Therefore, we construct a Hough space, a matrix which is initiated at zero and incremented at each anchor location vote, fig. 1 (h). The local maxima of the resulting Hough matrix are computed and interpreted as detected object positions.
4
EXPERIMENTS
For preliminary experiments, we implemented this algorithm using Octave and an executable of the SURF extractor. Fig. 7 shows some typical results of different phases of the algorithm. The test images were acquired by taking 640 × 480 digital photographs at random natural road scenes. In fig. 6, a number of model photographs are shown. Each of such images, having a resolution of about 100 × 100 pixels, yielded a thourough description of the traffic sign design in a model description containing on the average 52 features, what boils down to a model file size of only 3.2 KB. Fig. 7 shows a typical output during the detection stage. In a query image, local features are extracted. These are matched with the visual word vocabulary. Then, for each traffic sign model, for the matching visual words the relative anchor position is computed. This stage is visualised in the figure. As can be noticed, in the centre of the traffic sign, many anchor votes are coinciding. The traffic signs were detected by finding local maxima in the Hough space, for this example visualised in fig. 8. We performed experiments on 35 query images and were able to detect 82% of the
trained types. Detection failures were mostly due to the fact that the signs were too far away and hence too small, and severe occlusions by other objects.
5
CONCLUSIONS AND FUTURE WORK
In this paper, we presented an algorithm for object detection based on the concept of visual word constellation voting. The preliminary experiments proved the performance of this approach. The method has the advantages that it is computing power and memory efficient and that it can handle pattern repetitions in the models. We applied this method successfully on automatic traffic sign recognition. As told before, our aim in this work is an embedded implementation of this algorithm. The Octave implementation presented here is only a first step towards that. But we believe the proposed approach has a lot of advantages. The SURF extraction phase can mostly be migrated to a parallel hardware implementation on FPGA. Visual word matching is sped up using the ANN-libraries, making use of Kd-trees. Of course a large part of the memory is used by the (mostly sparse) hough space. A better description of the voting space will lead to a great memory improvement of the algorithm.
REFERENCES Arya, S., Mount, D., Netanyahu, N., Silverman, R., , and Wu, A. (1998). An optimal algorithm for approximate nearest neighbor searching. In J. of the ACM, vol. 45, pp. 891-923. Ballerini, R., Cinque, L., Lombardi, L., and Marmo, R. (2005). Rectangular Traffic Sign Recognition. Springer Berlin / Heidelberg. Baumberg, A. (2000). Reliable feature matching across widely separated
Figure 8: Hough space for the anchor positions of the example in fig. 7
Li, F.-F. and Perona, P. (2005). A bayesian hierarchical model for learning natural scene categories. In Proc. of the 2005 IEEE Computer Society Conf. on Computer Vision and Pattern Recognition, pages 524531. Lowe, D. (1999). Object recognition from local scale-invariant features. In International Conference on Computer Vision. Matas, J., Chum, O., Urban, M., and Pajdla, T. (2002). Robust wide baseline stereo from maximally stable extremal regions. In British Machine Vision Conference, Cardiff, Wales, pp. 384-396. Mikolajczyk, K. and Schmid, C. (2002). An affine invariant interest point detector. In ECCV, vol. 1, 128–142.
Figure 7: Typical experimental results. In a query image, all matching visual words are shown for the pedestrian crossing sign (white squares). From each visual word, the anchor location is computed (black line pointing form visual word centre to anchor). The zoom on the right shows clearly the recognised sign: many anchor lines coincide.
views. In Computer Vision and Pattern Recognition, Hilton Head, South Carolina, pp. 774-781. Bay, H., Tuytelaars, T., and Gool, L. V. (2006). Speeded up robust features. In ECCV. Fasel, B. and Gool, L. V. (2007). Interactive museum guide: Accurate retrieval of object descriptions. In Adaptive Multimedia Retrieval: User, Context, and Feedback, Lecture Notes in Computer Science, Springer, volume 4398. Garcia-Garrido, M., Sotelo, M., and Martin-Gorostiza, E. (2006). Fast traffic sign detection and recognition under changing lighting conditions. In Intelligent Transportation Systems Conference 2006, pp. 811 - 816. Goedem´e, T., Tuytelaars, T., Nuttin, M., and Gool, L. V. (2006). Omnidirectional vision based topological navigation. In International Journal of Computer Vision and International Journal of Robotics Research, Special Issue: Joint Issue of IJCV and IJRR on Vision and Robotics. Goedem´e, T., Tuytelaars, T., Vanacker, G., Nuttin, M., and Gool, L. V. (2005). Feature based omnidirectional sparse visual path following. In IEEE/RSJ International Conference on Intelligent Robots and Systems, IROS 2005, Edmonton, pages 1003–1008.
Mindru, F., Moons, T., , and Gool, L. V. (1999). Recognizing color patters irrespective of viewpoint and illumination. In Computer Vision and Pattern Recognition, vol. 1, pp. 368-373. Rosenfeld, A. and Kak, A. (1976). Digital picture processing. In Computer Science and Applied Mathematics, Academic Press, New York. Sandoval, H., Hattori, T., Kitagawa, S., and Chigusa, Y. (2000). Angledependent edge detection for traffic signs recognition. In Proceedings of the IEEE Intelligent Vehicles Symposium 2000, pp. 308-313. Schmid, C., Mohr, R., and Bauckhage, C. (1997). Local grey-value invariants for image retrieval. In International Journal on Pattern Analysis an Machine Intelligence, Vol. 19, no. 5, pp. 872-877. Sivic, J. and Zisserman, A. (2003). Video google: A text retrieval approach to object matching in videos. In Proc. of 9th IEEE Intl Conf. on Computer Vision, Vol. 2. Tuytelaars, T. and Gool, L. V. (2000). Wide baseline stereo based on local, affinely invariant regions. In British Machine Vision Conference, Bristol, UK, pp. 412-422. Tuytelaars, T., Gool, L. V., D’haene, L., , and Koch, R. (1999). Matching of affinely invariant regions for visual servoing. In Intl. Conf. on Robotics and Automation, pp. 1601-1606. Viola, P. and Jones, M. (2001). Rapid object detection using a boosted cascade of simple features. In Computer Vision and Pattern Recognition. Zhang, M., Marszalek, S., Lazebnik, S., and Schmid, C. (2005). Local features and kernels for classication of texture and object categories: An in-depth study. In In Technical report, INRIA. Zhu, S. and Liu, L. (2006). Traffic sign recognition based on color standardization. In IEEE International Conference on Information Acquisition 2006, pp. 951-955, Veihai, China.