Available online at www.sciencedirect.com
Procedia Computer Science 11 (2012) 96 – 106
Proceedings of the 3rd International Conference on Computational Systems-Biology and Bioinformatics (CSBio 2012)
Transcriptomic data integration inferring the dominance of starch biosynthesis in carbon utilization of developing cassava roots Wanatsanan Siriwata, Saowalak Kalapanulakb,c, Malinee Suksangpanomrungd, Supatcharee Netrphand, Asawin Meechaic,e, Treenut Saithongb,c,* a
Bioinformatics and Systems Biology Program, School of Bioresources and Technology and School of Information Technology, King Mongkut’s University of Technology Thonburi (Bang Khun Thian campus), Bangkok 10150, Thailand b School of Bioresources and Technology, King Mongkut’s University of Technology Thonburi (Bang Khun Thian campus), Bangkok 10150, Thailand c Systems Biology and Bioinformatics Research Group, Pilot Plant Development and Training Institute, King Mongkut’s University of Technology Thonburi, Bangkok 10150, Thailand d National Center for Genetic Engineering and Biotechnology (BIOTEC), Pathumthani 12120, Thailand e Department of Chemical Engineering, King Mongkut’s University of Technology Thonburi, Bangkok 10140, Thailand
Abstract Carbon metabolism, which is an important process underlying the plant development, has been extensively studied in model plant Arabidopsis, however the understanding in this process for cassava root crop is very little. To enhance our understanding into the process, we studied carbon partitioning during cassava root development at the transcriptional level via transciptomic data integration into the metabolic pathways. The transcriptome data of three different developmental stages of cassava roots—fibrous root (FR), developing storage root (DR), and mature storage root (MR) from Yang et al. [1]—was integrated into the key carbon metabolism pathways reconstructed following the protocol of Rongsirikul et al. [2]. According to the 43 differentially expressed genes (56 proteins IDs) mapped into the pathways, we found that the genes involved in starch biosynthesis are more up-regulated, in contrast to the expression of genes in the cell wall biosynthesis and respiration. The results may imply the significance of starch biosynthesis among the carbon utilization processes in the developing cassava roots. In other words, the carbon source from α-D-glucose-1-phosphate (G1P) might be mostly used for starch biosynthesis rather than cell wall biosynthesis and respiration pathways during cassava root development. © 2012 The Authors. Published by Elsevier B.V. Selection and/or peer-review under responsibility of the Program Committee of CSBio 2012. Keywords: carbon partitioning, carbon metabolism pathway, starch biosynthesis, cassava root development, data integration * Corresponding author. Tel.: +66-2470-7714 ; fax: +66-2452-3479 . E-mail address:
[email protected].
1877-0509 © 2012 Published by Elsevier Ltd. doi:10.1016/j.procs.2012.09.011
Wanatsanan Siriwat et al. / Procedia Computer Science 11 (2012) 96 – 106
1. Introduction Cassava (Manihot esculenta Crantz) is a crop with high potential in terms of food, feed, and biofuel [3]. Cassava yields 250,000 calories of carbohydrate per hectare [4]. According to the FAO’s ranking in 2011, cassava is the third most important source of calories in the tropical area, after rice and maize [3]. Cassava roots provide high amount of calories, but low protein, fat, mineral, and vitamin content. Cassava roots contain up to 80–90 percent of carbohydrate by dry weight, and 80 percent of carbohydrate is starch [4]. In addition to high starch content, cassava has a good tolerance to drought and is able to grow in low nutrient soil. Therefore, the attractiveness of cassava is relatively increasing to other crops, not only for the food industry, but also for green energy production [3]. Carbon metabolism plays a key role in growth and development of plants, including cassava, because carbon-derived compounds are necessary in all biochemical processes [5]. Sucrose, an important carbonderived compound, is produced through photosynthesis and carbon assimilation process in leaves, then sucrose is transported through phloem to storage organs, i.e. roots, fruits, and tubers, to act as a precursor of the later carbohydrate metabolism. Despite the importance of carbon metabolism, carbon partitioning during cellular development is not yet fully clear, especially in non-model plants like cassava. At present, background knowledge of carbon partitioning in carbon metabolism is mostly inferred from the studies of model plant Arabidopsis and other few crops. In 2011, Yang et al. investigated differences in gene expression of three types of cassava roots—fibrous root (FR), developing storage root (DR), and mature storage root (MR)—in order to gain a better understanding of cassava root development at the transcriptional level. They performed 60 mer oligonucleotide microarray representing 20,840 cassava genes. They found that glycolysis/gluconeogenesis was the most important process among total 25 pathways that were observed significant changes in gene expression during root development. The gene expression data of the 13 rate-limiting enzymes from glycolysis/gluconeogenesis and sucrose/starch metabolism was mapped into KEGG pathways to illustrate the transcriptional regulation of the enzymes in the pathway during cassava root development. These enzymes were then proposed to be targets for improving starch yield in cassava [1]. To further investigate carbon partitioning during cassava root development, we performed data integration whereby the gene expression data of cassava roots from Yang et al. [1] was integrated into the metabolic pathway reconstructed in this work to imply the regulation underlying the studied metabolism. Briefly, the three cassava metabolic pathways of carbohydrate metabolism, i.e. cell wall biosynthesis, starch biosynthesis and respiration pathway, were reconstructed following the protocol of Rongsirikul et al. [2] and visualized on the VANTED platform [6]. Then, the transcriptome data from Yang et al. [1] was incorporated into the reconstructed pathways for inferring carbon partitioning among the three carbohydrate metabolisms. 2. Methods This work is divided into two main parts: the reconstruction of the relevant metabolic pathways and the integration of the transcriptome data from Yang et al. [1] into the reconstructed pathways (Fig. 1). 2.1. Data The cassava (Manihot esculenta) genome information was obtained from genome sequencing of Cassava Genome Project 2010 (Phytozome database version 7.0: Cassava version 4.1). There are 1.5 million ESTs that can be predicted to 30,666 protein-coding loci and 34,151 transcripts (http://www.phytozome.net/).
97
98
Wanatsanan Siriwat et al. / Procedia Computer Science 11 (2012) 96 – 106
The transciptome data was obtained from the 60 mer oligonucleotide microarray representing 20,840 cassava genes. The expression of genes was measured in the three different types of cassava roots: fibrous root (FR), developing storage root (DR), and mature root (MR) from Yang et al. [1]. 2.2. Pathway reconstruction The three key carbon metabolism pathways—cell wall biosynthesis, starch biosynthesis, and respiration pathway—were reconstructed following the protocol of Rongsirikul et al. [2]. In brief, the cassava metabolic pathways were reconstructed from the cassava genes annotated by comparative genomics approach (reciprocal BLASTp) with multiple plant templates. Fig. 2 outlines the scope of the metabolic pathway under investigation. The α-D-glucose-1-phosphate is the intermediate carbon metabolite that is utilized by the three pathways. VANTED tool [6] was used to visualize the reconstructed pathways which is advantage in facilitating the omics data integration into the pathways. 2.3. Integration of transcriptomic data into the reconstructed metabolic pathways The transcriptome data of cassava roots from Yang et al. [1] was matched with the gene IDs in the reconstructed pathways through BLASTn with the following criteria: E-value İ 1 e-10 and percentage of identity ı 95. After matching probe IDs of microarray with cassava gene IDs, two-fold change of expression data, DR/FR, MR/DR, and MR/FR, was employed to identify the significant genes for further analysis. Only the expression of the significant genes was integrated into the three reconstructed pathways.
Fig. 1. Overview of methodology. There are two main steps in this work: (1) pathway reconstruction following the protocol of Rongsirikul et al. [2], (2) integration of gene expression data from Yang et al. [1] into the reconstructed pathways.
Wanatsanan Siriwat et al. / Procedia Computer Science 11 (2012) 96 – 106
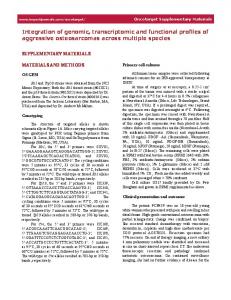
Fig. 2. Schematic of the reconstructed pathways in this work. Carbon source for sucrose is supplied by carbon fixation in the Calvin cycle. Then, sucrose is converted into α-D-glucose-1-phosphate through several steps. Next, carbon from α-D-glucose-1-phosphate is distributed to three main metabolic pathways in cassava root, i.e. cell wall biosynthesis, starch biosynthesis, and respiration pathway.
3. Results and Discussion The attractiveness of cassava over other food crops is the observed high starch content in its underground roots. Nevertheless, the manner in which that starch is produced and accumulated in cassava roots during development remains to be studied. Since carbon metabolism is believed to be the key process underlying both starch biosynthesis and root development processes, we here attempted to answer the question by investigating carbon partitioning during cassava root development. 3.1. Reconstruction of the carbon metabolism pathways in cassava root The carbon metabolism pathway, which describes the utilization of carbon fixed from the atmosphere for cellular development and other activities, was subjected to study in this work. Due to negligible content of protein and lipid in cassava root [4], the reconstructed carbon metabolism was focused only on the carbohydrate metabolism, including cell wall biosynthesis, starch biosynthesis, and respiration pathway. Thus, the carbon metabolism pathways of cassava under investigation could be conceptually schematized as demonstrated in the Fig. 2. In brief, sucrose produced from the carbon assimilation process in leaves is transported to storage roots [7] where it is converted to α-D-glucose-1-phosphate (G1P). Plants utilize G1P for three purposes: cellular structure development (cell wall biosynthesis), energy production (respiration), and macromolecule synthesis and accumulation (starch biosynthesis). Through the pathway reconstruction protocol (Rongsirikul et al. [2] and unpublished data), 448 of 34,151 protein sequences in the cassava genome (http://www.phytozome.net/) were annotated as relevant to the carbohydrate metabolism pathways (Table 1). While 395 proteins related to cell wall biosynthesis and respiration were identified in this work, 53 proteins related to starch biosynthesis were taken from Saithong et al. [8]. In summary, our carbohydrate metabolism pathway is comprised of 363 cassava genes that encode 448 proteins (52 EC numbers) functioning in 57 metabolic reactions. The reconstructed pathways were presented on the VANTED platform in order to facilitate transcriptomic data integration (Appendix A.1). In addition to the basic information of the metabolic pathway,
99
100
Wanatsanan Siriwat et al. / Procedia Computer Science 11 (2012) 96 – 106
our visualization format includes a list of proteins annotated into the pathway, as exemplified in Fig. 3. Each protein was given a12-digit ID in the same manner as Saithong et al. [8], whereby this 12-digit ID format is a combination of the 6-digit ID of the gene name and another 6-digit ID of the transcript name from the Phytozome database. Table 1. Characteristics of the reconstructed pathways in cassava describing the component comprised of the pathways: the number of cassava genes, proteins, reactions, EC numbers, and metabolites in starch biosynthesis, cell wall biosynthesis, and respiration pathway. Number of cassava Pathway names
Starch biosynthesis [8] Cell wall biosynthesis Respiration Total
genes
proteins
33 82 248 363
53 88 307 448
proteins with RNA expressed data 18 25 93 136
reactions
EC numbers
metabolites
6 6 45 57
6 6 40 52
14 17 63 87
3.2. Gene expression data integration inferring carbon partitioning during cassava root development In this section, the significantly expressed genes from Yang et al. [1] were integrated into the reconstructed carbon metabolism pathways. The resulting pathways with transcriptomic data integration was then used for further analysis. The 43 genes (56 proteins IDs) related to reconstructed carbon metabolism were found significantly expressed based on two-fold change criteria in either of the observed conditions: DR/FR, MR/DR, or MR/FR (more details in Appendix A.2). The Fig. 4 shows the classification of protein IDs encoded from these significantly expressed genes according to the conditions of identification (Fig. 4a) and the pathways of relevance (Fig. 4b). Among the three observed conditions, 42 and 51protein IDs were identified from DR/FR and MR/FR, respectively, while only eight protein IDs were identified from MR/DR (Fig. 4a). The small number of the significant genes identified from the MR/DR condition may imply the similarity in carbon metabolism behavior between MR and DR at the transcriptional level. The implication is, moreover, supported by the large intersection of the significant genes identified from DR/FR and MR/FR. In the context of metabolic pathways, the majority of the 56 protein IDs, about 55 percent (31/56), is involved in the respiration pathway, followed by 25 percent (14/56) and 20 percent (11/56) in cell wall biosynthesis and starch biosynthesis pathways, respectively (Fig. 4b). These results might indicate the significant of the respiration process during root development, as also suggested by the analysis of Yang et al. [1]. However, the 31 protein IDs belonging to the respiration pathway is only 10 percent (31/307) of the total proteins (or 33 percent (31/93) of protein expressed in microarray) in the pathway, in contrast to 16 percent (14/88; or 56 percent (14/25) of protein expressed in microarray) and 21 percent (11/53; or 61 percent (11/18) of protein expressed in microarray) for the cell wall and starch biosynthesis pathways, respectively. Therefore, it might be more sensible to conclude that the starch biosynthesis is the most dominant carbon metabolism process which genes responding in the pathway express differentially during cassava root development.
Wanatsanan Siriwat et al. / Procedia Computer Science 11 (2012) 96 – 106
Fig. 3. The VANTED visualization of cell wall biosynthesis pathway that incorporated expression data from Yang et al. [1] into the network. The bar graphs represent the expression data of cassava roots: dark gray-FR (fibrous root), gray-DR (developing storage root), and light gray-MR (mature storage root). The height of bar shows the level of gene expression.
101
102
Wanatsanan Siriwat et al. / Procedia Computer Science 11 (2012) 96 – 106
a
b
Fig. 4. The cassava protein IDs of the genes above two-fold change in developing roots: (a) classification of protein IDs according to the condition of identification; DR/FR: developing storage roots/fibrous roots, MR/DR: mature storage roots/developing storage roots, MR/FR: mature storage roots/fibrous roots; (b) classification of protein IDs according to the pathways of relevance; SB: starch biosynthesis pathway; CW: cell wall biosynthesis pathway; RES: respiration pathway
a
b
Fig. 5. The percentage of up- and down-regulated genes in the reconstructed pathways: (a) the percentage of up and down regulated genes in DR over FR (DR/FR) in the reconstructed pathways; (b) the percentage of up- and down-regulated genes in MR over DR (MR/DR) in the reconstructed pathways; FR: fibrous root; DR: developing storage root; MR: mature storage root; CW: cell wall biosynthesis pathway; RES: respiration pathway; SB: starch biosynthesis pathway; down: down-regulation; up: up-regulation
The expression profiles of the 56 protein IDs were integrated into the reconstructed carbon metabolism pathways (Appendix A.3) as exemplified by the cell wall biosynthesis pathway in Fig. 3. Gene expression data was presented as a bar chart, where the height of the bars represents the level of gene expression and the colors of the bars denote the type of cassava roots: dark gray–FR, gray–DR, and light gray–MR. Changes in carbon utilization were inferred based on the activity of the gene encoding the enzymatic protein in the pathway. Fig. 5 shows the ratio of the up- and down-regulated genes during root development from FR to DR (Fig. 5a) and from DR to MR (Fig. 5b). The up-regulation of gene expression referred to the increasing activity of genes toward the later developmental stage, and the carbohydrate metabolism pathway containing a large number of the up-regulated genes then referred to the active pathway during the developmental process. The results show that the starch biosynthesis pathway is a highly active carbohydrate metabolism process in the transition of FR to DR and also in the transition of DR to MR. All starch-biosynthesis-related genes are upregulated during FR developing towards MR, in contrast to the genes in the other two pathways that obviously shows down-regulation tendency. The concurrent trend of the gene-expression-based pathway activity of the starch biosynthesis and the rest of the carbohydrate metabolism pathways may imply a shift in carbon
Wanatsanan Siriwat et al. / Procedia Computer Science 11 (2012) 96 – 106
utilization during the root development. During FR development, carbon may be required for cell wall biosynthesis and respiration to form the cellular structure of the root, while, during DR and MR development, carbon may be used for starch production accumulation in the storage root as found in mature storage roots containing starch at levels up to 80-90 percent of dry weight [9]. Furthermore, comparing gene expression activity during the two developmental transitions, FR to DR (Fig. 5a) and DR to MR (Fig. 5b), the activity of the cell wall biosynthesis and respiration pathways are relatively higher in the DR to MR than in the FR to DR transition. This suggests that the development of cassava roots from DR to MR requires more energy and cellular structural components to expand the root. Beside the single-condition comparison, we provided the results of the two-condition comparison as shown in Fig. 6. In this analysis, the expression of genes in the two developmental transitions of cassava roots was simultaneously considered, so that its behaviour could be classified into four categories: (1) up regulated in both root developmental transitions (up-up), these genes might be required throughout cassava root development, (2) up regulated in FR to DR transition but not in DR to MR transition (up-down), these genes might be required only during FR developing to DR, (3) down regulated in FR to DR transition but not in DR to MR transition (down-up), these genes might be required only during DR developing to MR, and (4) down regulated in both root developmental transitions (down-down), these genes might be required only for FR development, but not for storage root formation (DR and MR). The result shows that genes in starch biosynthesis pathway are all required throughout the storage root development as their expression falls into the up-up category. To summarize our investigation of carbon partitioning during cassava root development, 15 expression profiles of genes encoding key enzymatic proteins were plotted along with their corresponding EC numbers as shown in Fig. 7. The result shows that G1P, which is a carbon source for all three carbohydrate metabolisms, tends to be mostly utilized in starch biosynthesis rather than cell wall biosynthesis and respiration pathways during cassava root development. This finding corresponds to the metabolic regulation scenario during root development proposed by Yang et al. [1].
Fig. 6. The expression of genes in the two developmental transitions of cassava roots—up-up: up regulated in both root developmental transitions; up-down: up regulated in FR to DR transition but not in DR to MR transition; down-up: down regulated in FR to DR transition but not in DR to MR transition; down-down: down regulated in both root developmental transitions
103
104
Wanatsanan Siriwat et al. / Procedia Computer Science 11 (2012) 96 – 106
Fig. 7. The expression profiles of genes encoding enzymatic proteins along with their corresponding EC numbers. The bar graphs represent the expression data of cassava roots: fibrous root (FR), developing storage root (DR), and mature storage root (MR). The height of each bar graph shows the level of gene expression. EC 2.4.1.12: cellulose synthase; EC 3.2.1.4: cellulase, endoglucanase; EC 3.2.1.37: xylan 1,4beta-xylosidase; EC 2.7.7.27: glucose-1-phosphate adenylyltransferase, AGPase; EC 3.2.1.68: debranching enzyme; EC 2.4.1.18: 1,4alpha-glucan branching enzyme; EC 2.7.1.2: hexokinase; EC 2.7.1.11: 6-phosphofructokinase; EC 2.7.2.3: phosphoglycerate kinase; EC 4.2.1.11: enolase, phosphopyruvatehydratase; EC 2.7.1.40: pyruvate kinase; EC 1.2.4.1: pyruvate dehydrogenase E1 component subunit alpha; EC 2.3.1.12: pyruvate dehydrogenase E2 component; EC 2.3.3.8: ATP citrate (pro-S)-lyase; EC 1.8.1.4: dihydrolipoamide dehydrogenase
However, our work has provided more advantages over the previous investigation (Yang et al. [1]) in two aspects. Firstly, our study relies on the real metabolic pathways of cassava, which were reconstructed from five template plants according to the protocol of Rongsirikul et al. [2]. The employed pathway is obviously more information-abundant and specific to cassava than the KEGG pathway used in the previous study. For example, the reconstructed pathway covers the reaction catalyzed by EC 3.2.1.37 in the cell wall biosynthesis pathway, which is missing in the pathway of Yang et al. study. Secondly, this work focused on carbon partitioning in the carbon metabolism pathway during root development, so that the relatively greater detailed results specific to this process could be obtained. For example, AGPase (EC 2.7.7.27) activity in starch biosynthesis pathway increases during cassava root development, this result is similar with cereal endosperm [10] and potato tuber [11]. 4. Conclusions Currently, the availability of omics data allows us to systematically investigate the complex metabolism of plants. This work aimed to gain more understanding into the carbon metabolism in the developing roots of cassava through the transcriptomic data integration into the metabolic network. Here, three carbon utilization pathways of cassava were reconstructed using the protocol of Rongsirikul et al. [2]: cell wall biosynthesis, respiration, and starch biosynthesis pathway. Then, the trancriptomic data of the developing roots of cassava
Wanatsanan Siriwat et al. / Procedia Computer Science 11 (2012) 96 – 106
form Yang et al. [1], which are the expression of the 43 differentially expressed genes (56 proteins IDs) were integrated with the reconstructed pathways. The results suggest that carbon partitioning at α-D-glucose-1phosphate (G1P) tends to supply the starch biosynthesis process rather than cell wall biosynthesis and respiration pathways during cassava root development. These significantly expressed genes that, involve in carbon partitioning during cassava root development are suggested to be interesting target genes for metabolic engineering. To reinforce our finding the data at protein level is required in order to fulfil the gap between the transcription and metabolic regulation. Also, co-expression genes analysis of the three stages of cassava root development, which is beyond the scope of this work, might give more deep information behind the regulation of carbon assimilation.
Acknowledgements We also thank the National Center for Genetic Engineering and Biotechnology (BIOTEC) for Siriwat W’s scholarship. We thank Toechamroen C, Vongthaiwan H, and Swangmaneecharern P for their help implement the pathways on VANTED platform.
References [1] Yang J, An D, Zhang P. Expression profiling of cassava storage roots reveals an active process of glycolysis/ gluconeogenesis. J Integr Plant Biol 2011;53(3):193-211. [2] Rongsirikul O, Saithong T, Kalapanulak S, Asawin M, Supapon, Supatcharee N, Malinee S. Reconstruction of starch biosynthesis pathway in cassava using comparative genomic approach. Communications in Computer and Information Science 2010;115(3):118129. [3] Ayling S, Ferguson M, Rounsley S, Kulakow P. Information resources for cassava research and breeding. Tropical Plant Biology 2012;5(1):140-151. [4] Montagnac JA, Davis CR, Tanumihardjo SA. Nutritional value of cassava for use as a staple food and recent advances for improvement. Food science and food safety 2009;8:181-194. [5] Börnke F, Sonnewald S. Biosynthesis and metabolism of starch and sugars. In: Ashihara H, Crozier A, Komamine A, editors. Plant metabolism and biotechnology, Chichester, UK: John Wiley & Sons, Ltd; 2011, p.1–25. [6] Junker BH, Klukas C, Schreiber F. VANTED: A system for advanced data analysis and visualization in the context of biological networks. BMC Bioinformatics 2006;7:109. [7] Ruan Y. Signaling role of sucrose metabolism in development. Mol. Plant 2012;5(4):763-5. [8] Saithong T, Rongsirikula O, Kalapanulak S, Netrphan S, Suksangpanomrung M., 2011 “High-quality pathway of cassava starch biosynthesis in non-photosynthetic tissues inferred by multiple plant templates,” 23rd Annual Meeting of the Thai Society for Biotechnology “Systems Biotechnology: Quality & Success” (TSB2011). Bangkok, Thailand. [9] Baguma Y, Sun C, Borén M, Olsson H, Rosenqvist S, Mutisya J et al. Sugar-mediated semidian oscillation of gene expression in the cassava storage root regulates starch synthesis. Plant Signaling & Behavior 2008;3(7):439–445. [10] Emes MJ, Bowsher CG, Hedley C, Burrell MM, Scrase-Field ESF, Tetlow IJ. Starch synthesis and carbon partitioning in developing endosperm. J. Exp. Bot 2003;54(382):569-575. [11] Hawker JS, Marschner H, Krauss A. Starch synthesis in developing potato tubers. Physiologia Plantarum 1979;46:25–30.
Appendix A. Supporting information Supplementary data involving in this work can be downloaded from the online version or http://sbi.pdti.kmutt.ac.th/?page_id=15 A.1. All combined reconstructed pathways in GML file This combined metabolic pathway can be used as a template to facilitate the omics data integration into the
105
106
Wanatsanan Siriwat et al. / Procedia Computer Science 11 (2012) 96 – 106
pathways. A.2. Information on 56 differentially expressed cassava protein IDs of cassava storage development Each cassava protein ID shows the transcription ID from the Phytozome database, the gene ID from the Phytozome database, the Probe ID from microarray data from Yang et al. [1], log2 ratio of DR/FR, MR/DR, and MR/FR, EC number, function, and pathway. A.3. The integrated map The integrated map of significantly expressed genes based on the two-fold change criteria with the reconstructed pathways, including cell wall biosynthesis, starch biosynthesis, and respiration pathway.