Journal of Energy and Power Engineering Volume 4, Number 5, May 2010 (Serial Number 30)
David Publishing
David Publishing Company www.davidpublishing.com
Publication Information: Journal of Energy and Power Engineering (ISSN1934-8975) is published monthly in hard copy and online by David Publishing Company located at 1840 Industrial Drive, Suite 160, Libertyville, Illinois 60048, USA. Aims and Scope: Journal of Energy and Power Engineering, a monthly professional academic journal, covers all sorts of researches on Thermal Science, Fluid Mechanics, Energy and Environment, Power System and Automation, Power Electronic, High Voltage and Pulse Power, Sustainable Energy as well as other energy issues. Editors: Simon C., Glint W., Richard P., Roy Z., Rita T., Candice J., Cherry Z., Tina Z., Lily L., Jim Q., Hiller H., Jane C., Betty Z., Gloria G., Stella H., Alina Y., Ben Y., Hubert H., Ryan H.. Manuscripts and correspondence are invited for publication. You can submit your papers via Web Submission, or E-mail to
[email protected] or
[email protected]. Submission guidelines and Web Submission system are available at http://www.davidpublishing.com. Editorial Office: 1840 Industrial Drive, Suite 160 Libertyville, Illinois 60048 Tel: 1-847-281-9826 Fax: 1-847-281-9855 E-mail:
[email protected];
[email protected] Copyright©2010 by David Publishing Company and individual contributors. All rights reserved. David Publishing Company holds the exclusive copyright of all the contents of this journal. In accordance with the international convention, no part of this journal may be reproduced or transmitted by any media or publishing organs (including various websites) without the written permission of the copyright holder. Otherwise, any conduct would be considered as the violation of the copyright. The contents of this journal are available for any citation. However, all the citations should be clearly indicated with the title of this journal, serial number and the name of the author. Subscription Information: Price: $96 (12 issues) David Publishing Company 1840 Industrial Drive, Suite 160, Libertyville, Illinois 60048 Tel: 1-847-281-9826. Fax: 1-847-281-9855 E-mail:
[email protected]
Journal of Energy and Power Engineering Volume 4, Number 5, May 2010 (Serial Number 30)
Contents Clean and Sustainable Energy 1
The Optimization of Decontamination Methods Selected for Contaminated Areas Used in Decommissioning of CANDU–6 NPP G. Barariu, R. Georgescu, F. Sociu, C. Bilbie and C. Bucur
10
Power Consumption Prediction for an Intelligent Air-Cushion Track Vehicle: Fuzzy Expert System H. Altab, R. Ataur, A.K.M. Mohiuddin and A. Yulfian
18
Dynamic Characteristics of the Crankshaft System with Coupling Effect S.H. Zhang and K. Jia
27
Estimation of Traffic Induced Pollution in Palestine Z. Salhab
32
Paper Machine Influence on Industrial Energy System A. Hazi and G. Hazi
Power and Electronic System 37
Reliability Analysis of Fluid Leak Detection and Isolation System M.A. Djeziri and B.Ould Bouamama
45
Reducing the Short Circuit Levels in Kuwait Transmission Network W. Al-Hasawi and M. Gilany
52
Transient Performance of an Isolated Induction Generator under Unbalanced Loading Conditions A. Alsalloum, R.M. Hamouda, A.I. Alolah and A.M. Eltamaly
58
A Novel MTJ-Based Register Y.F. Jiang, X.B. Zhang and J.X. Ju
May 2010, Volume 4, No.5 (Serial No.30) Journal of Energy and Power Engineering, ISSN 1934-8975, USA
The Optimization of Decontamination Methods Selected for Contaminated Areas Used in Decommissioning of CANDU–6 NPP G. Barariu1, R. Georgescu1, F. Sociu1, C. Bilbie2 and C. Bucur2 1. Romanian Authority for Nuclear Activities-Subsidiary of Technology and Engineering for Nuclear Projects, Magurele-Ilfov 5204-MG-4, Romania 2. S.C. EDATA S.R.L, Bucharest 013713, Romania Received: January 15, 2010 / Accepted: February 2, 2010 / Published: May 31, 2010. Abstract: The objective of this paper is to provide information for nuclear field specialists and decision makers on opportunities for minimizing radioactive wastes arising from the decontamination & decommissioning of a CANDU-6 NPP. The paper proposes a method for selection of appropriate decontamination techniques which may be used at Cernavodă NPP decommissioning, equipped with CANDU heavy water reactors, based on the simulation with ProVision software. The paper has a singular focus on physical decontamination techniques and does not address other aspects of decommissioning. The physical decontamination techniques which are the best for certain areas of the CANDU-6 NPP from point of view of effectiveness and cost were determined. A unit cost for each decontamination technique was determined by relating the total cost to the average surface to be decontaminated. In conclusion, physical techniques will apply more efficiently to concrete surfaces. The chemical decontamination methods, in comparison with physical decontamination methods are, more suitable for non-porous surfaces respectively metal and are less recommended for concrete surfaces. Key words: Decommissioning, decontamination method, software, contaminant, radioactive contaminated area.
1. Introduction For nuclear facilities, decommissioning is the final phase in their life cycle after sitting, design, construction, commissioning and operation. It is a complex process involving operations such as detailed surveys, decontamination and dismantling of plant, equipment and facilities, demolition of buildings and structures, site remediation, and the management of resulting waste and other materials [1]. All activities take place under a regulatory framework that takes into account the importance of the health and safety of the operating staff, the general public and protection of the environment. Corresponding author: G. Barariu, Ph.D. of chemistry, design and research fields: radioactive waste management, disposal facilities. E-mail:
[email protected].
There is a growing volume of information being published annually and mainly presented at international conferences by specialists in various fields related to decommissioning and decontamination. These present mainly good experiences; however, sometimes mistakes and lessons learned are included. It is important for the collected body of international experience in decommissioning planning and management to be assembled and published for use and interpretation by those engaging in these activities [2]. In order to implement the last information in the support documentations for Decommissioning Plan for Cernavodă NPP units 1 and 2 and the future units 3 and 4, we try to determine the optimum decontaminations methods for each type of surface. In this paper, we mainly underline the physical deco-
2
The Optimization of Decontamination Methods Selected for Contaminated Areas Used in Decommissioning of CANDU–6 NPP
ntamination methods, but at CANDU-6 NPP, the chemical decontaminations methods are also applicable on large scale. Basically, the chemical decontamination is a cleaning operation that involves the use of a single chemical agent or a mixture of chemical agents in order to remove even trace amounts of radionuclides that are present on a surface. The chemical decontaminations methods, in comparison with physical decontamination methods, are more suitable for metal surfaces and are less recommended for concrete surfaces, but these methods are not treated in this paper. One characteristic of CANDU-6 reactors is the presence of Tritium and 14C in main coolant and in moderator systems. In general, 14C production in HWRs (like CANDU-6) will be higher than in LWRs, owing to the large quantity of heavy water (with 17O) in the moderator system. The amount of tritium generated in fuel by ternary fission is approximately the same in HWRs as in LWRs. However, a relatively large amount of tritium is produced in the D2O coolant and moderator (approximately 8.9 × 10⁷ GBq·GW(e)–1·a–1), primarily in the operation of the moderator system. Due to this characteristic, any decontamination activity must be done carefully in order to avoid spread of contaminants (i.e., all decontamination activities must be done under a special tent and that implies supplementary costs) [3].
2. Objective The objective of this paper is to provide information for nuclear field specialists and decision makers (ranging from regulators, strategists, planners and designers to operators) on opportunities for minimizing radioactive wastes arising from the Decontamination & Decommissioning (D&D) of a CANDU-6 nuclear facility. This will allow waste minimization options to be properly planned and assessed as part of National, Site and Plant Radioactive Waste Management Plan. The paper has a singular focus on decontamination techniques and does not address other aspects of
decommissioning, deactivation or dismantlement. It assumes that a decision has been made to clean up the structure and that cleanup goals have already been established. The paper is meant to be an aid to making decision and is not meant to replace other procedures that are acknowledged as critical to the decision-making process [4]. It may be appropriate to gather information to support remedy selection and implementation through a small-scale engineering study. Such small-scale engineering studies are often laboratory based tests which provide critical information on how a proposed technology will perform under particular real-world conditions. They are relatively low cost and are often used to provide better data to support remedy selection and valuation. Small-scale laboratory tests may be followed up with advanced or pilot scale tests if more remedy design information is needed. When properly designed, a treatability study should yield information on seven remedy selection criteria: y overall protection of human health and the environment; y compliance with applicable or relevant and appropriate requirement; y long-term effectiveness; y reduction of toxicity, mobility and volume; y short term effectiveness; y implementability; y cost. Recognition of the value of this approach will allow the project manager to budget early in the planning process for decontamination treatability studies, screen for potentially applicable decontamination technologies, develop remedial alternatives incorporating other considerations such as protective cleanup levels and waste disposal options, and perform a comparative analysis of alternatives to ultimately select the final remedial action technology [5].
3. Decontamination Techniques Selection For this paper, decontamination is defined as the re-
The Optimization of Decontamination Methods Selected for Contaminated Areas Used in Decommissioning of CANDU–6 NPP
moval of radiological contamination from the surfaces of facilities and equipment by a variety of physical techniques with the objectives of: y reducing radiation exposure; y enabling reuse of equipments and materials; y reducing the amount of material (equipment, construction and related debris) requiring expensive disposal; y restoring the site or facility; y removing contaminants prior to the return for usage, further treatment, modifications, protective storage, or longer-term management and disposal; y reducing the amount of residual radioactivity for the public protection and worker health and safety, and the environment. The hazards associated with radiological contaminants include radiological exposure to personnel from three potential pathways: (1) direct exposure to external radiation emanating from radioactive contaminants on surfaces and in equipment; (2) radiation exposure due to inhalation of contaminants that are already airborne in the facility or are generated during the remediation activities; and (3) radiation exposure due to ingestion of radioactive contaminants. It should be noted that a technology that addresses one of these pathways need not necessarily address the others. Decontamination is usually part of a larger cleanup activity often involving characterization, waste treatment, dismantlement, demolition, and disposal work. The decontamination activities per se require two main resources: clearly understood target cleanup levels and technologies to achieve the required level of cleanup. It was originally intended that a technology should also be cost effective in its implementation indicating costs commensurate with decontamination effectiveness. However, technology implementation cost information and the corresponding details of its application have been extremely difficult to obtain, and therefore, determining “cost effectiveness” with appro-
3
ximation is difficult. The decontamination of metal structures, concrete surfaces and buildings is considered in the nuclear installation decommissioning process. To facilitate the selection process, each selection criterion has been assigned, in descending order of preference, and ifferent levels of performance. The object of decontamination may be the surface of an equipment, a subsystem or an entire process system or in case of concrete structures the wall or floor area, etc.. For components whose contamination can be easily removed from the system, the most usual option is to use physical or electrochemical decontamination, unless chemical decontamination is the only feasible method. If pursuant to the evaluation, several techniques are considered acceptably their characteristics are reviewed to determine which type of technology meets the constraints set on postulated charge best and which offers may be available for analysis [5]. The net cost of the decontamination process has a role in selecting the methodology because it includes the cost of materials, equipments and activities for the implementation of the method and the cost of processing and disposal of the resulted radioactive waste. The lower the value of cost-benefit ratio is, the better the method is, because it signifies the cost per unit of radiation dose reduction for a particular method. The final choice of the most appropriate decontamination technique is made by comparing the costs with other similar techniques and the method with the most competitive cost is selected [6].
4. Simulation as a Step of Decontamination Techniques Choice A unit cost for each decontamination technique was determined by relating the total cost to the average surface to be decontaminated (i.e., 500 m2), corresponding to one month work period of a decontamination team. In order to develop a comparative study on the deco-
4
The Optimization of Decontamination Methods Selected for Contaminated Areas Used in Decommissioning of CANDU–6 NPP
ntamination techniques, an estimation of the operational parameters corresponding to the work procedures associated to the analyzed decontamination techniques, has been conducted by means of mathematical modeling (Monte Carlo simulation method). The steps of the simulation (modeling), according to the simulation methodology adopted by the manufacturer of ProVision V.6.1.1. device, involved the following actions: y the definition of the work procedures specific to the decontamination techniques; y the parameterization of the work procedures in point of necessary time; y the parameterization of the work procedures in point of costs associated to the component activities; y the simulation of the work procedures by ProVision 6.1.1. by Monte Carlo mathematical method; y the generation of post-simulation reports on which basis the efficiency of each decontamination technique is assessed. The definition of the work procedure specific to the decontamination techniques and the parameterization of the work procedures in point of time-consumption and costs related to the component activities were made on basis of the information in the decontamination technique descriptions for to demonstrate their performance [3]. The parameters represented the input data for the soft simulation of the work procedures employing Monte Carlo mathematical modeling method. The cost for radwaste management was calculated for final container disposal in Saligny Surface Repository, near Cernavodă NPP, for short-lived radwastes and in a Geological Repository for long-lived radwastes. The Geological Repository will be in operation starting 2055.
5. Decontamination Techniques Reviewed In case of nuclear installation decommissioning, decontamination methods, relevant for the decontami-
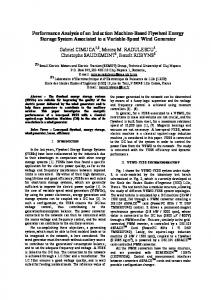
nation of steel structures and equipment. (i.e, concrete surfaces and buildings.) are chemically and physically decontaminated. Physical decontamination methods are based on some form of physical or mechanical abrasion of the surface contaminants or host material to get the effect of contaminant removal. Fig. 1 shows the diagram of the decontamination methods applicable to nuclear installation decommissioning, in accordance with those described above. Starting with the scope of applicability, i.e., imposed limitations, and evidencing the special considerations for each decontamination, the efficiency of each decontamination technique was determined on the basis of professional decision and available information in Ref. [7]. The decontamination techniques that are best for certain areas of the CANDU-6 NPP were determined and for each selected technique, the estimated concrete or metal surfaces which are to be decontaminated through that technique, were established. On the other hand, on basis of the detailed studies in the previous stages [8], the total theoretical areas requiring decontamination were estimated for CANDU-6 NPP, namely: 85,000 m2 metal surfaces and 65,000 m2 concrete surfaces. To determine the total metal surface to be decontaminated, we used formula: ST1= mc: (ρ x gc) + me : (ρ x ge) [m2] (1) where: mc-total mass of pipes, fittings and vanes; me total mass for all others metal components; ρ - material medium density; gc - pipes, fittings and valves materials average tickness; ge - all others metal components material average tickness. To determine the concrete surface which will be decontaminated, we calculate the sum of rooms’ area in Reactor Building and Service Building that are high or medium contaminated. The capacity of each decontamination technology characterizing a decontamination technique, depending on the type of contaminated surface (metal, concrete)
The Optimization of Decontamination Methods Selected for Contaminated Areas Used in Decommissioning of CANDU–6 NPP
5
Fig. 1 The diagram of the decontamination methods.
is shown in Table 1, structured on methods of physical decontamination.
6. Cost Selection
Cnsiderations
for
Technology
It was considered that all surfaces identified in the contaminated areas must be decontaminated either for the license release or for passing to an inferior contamination category. The following physical decontamination techniques were considered relevant and selected for the decontamination of the Nuclear Power Plant in Cernavodă: Strippable Coatings, Centrifugal Shot Blasting, Concrete Shaver, En-Vac Robotic Wall Scabbler, Grit Blasting, Soft Media Blast Cleaning, Steam Vacuum Cleaning, Piston Scabbler. A unit cost for each decontamination technique was determined by relating the total cost to the average surface to be decontaminated (i.e., 500 m2), corresponding to one month work period (Table 1). The sievert-man cost is included and it is assimilate to the Canadian experience. The standard cost for man-hour is considered constant per type of practices: y worker – intermediate school;
y dosimetrist – high school; y supervisor – high school; y trainer – high qualification. In Fig. 2, we show the selected decontamination techniques and related unit costs (in Euro / m2). In Fig. 3, we show the selected decontamination techniques costs, in Euro., for a surface of 500 m2, corresponding to one month work period. In Fig. 4, we show the concrete surfaces in square meters covered by different physical decontamination techniques at the decommissioning of a CANDU-6 NPP. In Fig. 5, we show the metal surfaces in square meters covered by different physical decontamination techniques at the decommissioning of a CANDU-6 NPP.
7. The Optimum Presentation [7]
Physical
Method
In Fig. 6, we illustrate the En-vac Robotic Wall Scabbler (physical method) workflow, which is the input for ProVision simulation. The En-vac Robotic Wall Scabbler (ERWS) is in fact a remote-controlled grit blasting unit specifically designed to work on flatsurfaced walls. It is also capable of working on floors.
6
The Optimization of Decontamination Methods Selected for Contaminated Areas Used in Decommissioning of CANDU–6 NPP
Table 1
Physical decontamination techniques.
Technical code
Techniques
2.1
Strippable Coating
2.2
Centrifugal Shot Blasting
2.3
Concrete Grinder
2.4
Concrete Shaver
2.5
Concrete Spaller
2.6
Dry Ice Blasting
2.7
Dry Vacuum Cleaning
2.8
Electro-Hydraulic Scabbling
2.9
En-vac Robotic Wall Scabbler
2.10
Grid Blasting
2.11
High Water
2.12 2.13
2.14
Pressure
Strengths
Quality of performance data
Type of surface
Extent of use [%] / surface [m2]
Unit cost [€ / m2]
Total cost [€ / month]
Good
Metal Concrete
10 / 8,500 1 / 650
34, 275
17.13743
Good
Concrete
10 / 6,500
68, 579
34.28928
Good
Concrete
1 / 650
33, 403
16.70136
Good
Concrete
7 / 4,550
17, 646
8.82311
Good
Concrete
0.5 / 325
28, 530
14.26522
Proper
-
-
Proper
Concrete
10 / 6,500
15,590
7.79543
Poor
Concrete
1 / 650
135, 666
67.83328
Good
Concrete
35 / 22,750
11,887
5.94361
Good
Metal Concrete
10 / 8,500 20 / 13,000
11,152
5.57598
Proper
Metal
10 / 8,500
109,206
54.60328
Good
Metal
20 / 13,000
17,960
8.98043
Good
Metal
5 / 4,250
59,738
29.86928
Good
Concrete
1 / 650
103,615
51.80745
Produce a single solid waste. No airborn contamination. No secondary liquid waste. Especially good for removing paint and light coating from concrete surfaces in open areas, away from wall-floor interfaces. Fast and mobile. Less vibration. Good for large, flat, open concrete floors and slabs. Fast and efficient. Good for in-depth contamination. Fast. CO2 gas generates very little extra waste. Very good for surface contamination. Quick available. Compatible with other physical decontamination techniques. Generates less secondary wastes than other techniques using water. Very efficient. Removes deep contamination. Works well on large, open spaces, including wallsand ceiling. Worker exposure to contaminants is limited; remote operation and integrated vacuum system. Well-established technology. Different Types of grid and blasting equipment are available for a variety of applications. High pressure systems are available.
Soft Media Blast Actually removes all the Cleaning (Sponge contamination from the Blasting ) surface Easy to use.Wasted surfaces Steam Vacuum dry quickly. Cleaning Good for large flat surfaces. Remotely operated and standard units are available. Piston Scabbler Good for open flat concrete floors.
The ERWS adheres to walls by high vacuum suction created in a sealed blasting chamber at the unit’s base. The vacuum system also serves to prevent any fugitive dust or grit emissions from the working surface of the
blasting operation. The unit is supported by a safety harness system and moves horizontally and vertically along floors, walls, and ceilings by individually motor-controlled wheels. The complete En-vac
The Optimization of Decontamination Methods Selected for Contaminated Areas Used in Decommissioning of CANDU–6 NPP
Blasting System consists of the En-vac robot (the unit that performs the scabbling), a recycling unit, a filter and a vacuum unit. The ERWS scabbles by abrasive blasting using abrasive steel grit or steel shot as the surface removal medium. The vacuum unit creates the vacuum that holds the robotic unit to the wall and contains and transports the waste. Recyclable and spent blast grit and blast residue are returned from the robot to the recycling unit through the vacuum hose. Debris from the scabbling operation is processed by a recycling unit, a filter and a vacuum unit, all of which are separate from the robotic unit. The recycling unit continuously provides abrasive grit to the robot through the blast hose.
7
The ERWS targets contaminants on painted wall surfaces, on floors and in the near surface of concrete. As with other physical decontamination technologies, there is no radionuclide specificity to this technology; it works by bulk removal of the paint and concrete surface where contaminants reside. This technology is specifically designed for flat, painted concrete and carbon steel surfaces. It is not suitable for bare metals, plastics, wood, etc., and can not accommodate complex geometries. The primary waste generated by ERWS is a stream of scabbled concrete and paint debris containing small amounts of grit. The grit is recycled on average 10 times, so it constitutes only a small proportion of the waste. Waste is collected automatically by the vacuum system. The recyclable grit is separated in the recycling system, and the waste portion is stored in drums for disposal. The particulars of waste disposal are case specific depending on radionuclides present and also on whether or not lead or other hazardous materials were present in the paint.
Fig. 2 The selected decontamination techniques unit costs (in Euro / m2).
Fig. 4 The concrete surfaces in square meters covered by different physical decontamination techniques at the decommissioning of a CANDU-6 NPP.
Fig. 3 The selected decontamination technique costs, in Euro., for a surface of 500 m2, corresponding to one month work period of the working team.
Fig. 5 The metal surfaces in square meters covered by different physical decontamination techniques at the decommissioning of a CANDU-6 NPP.
8
The Optimization of Decontamination Methods Selected for Contaminated Areas Used in Decommissioning of CANDU–6 NPP
Fig. 6 En-vac robotic wall scabbler (workflow).
Fig. 7 Soft media blast cleaning (workflow).
The En-vac system, consisting of three large units in addition to the robotic scabbling unit, is heavy with a total weight of about 5000 Kilos. The heaviest piece is 3480 Kilos. All units are designed to be lifted and transported by industrial forklift or mobile carry crane. The system requires a three-person work crew-two laborers and one equipment operator. The robot scabbler is movable, but, once set up with the safety
harness system, it is not portable until demobilized and relocated. The safety harness arrangement must be prepared and properly rigged to suit the circumstances. The weight of the robot and supporting hoses must be calculated along with the resulting loads imposed by the rigging angles, forces and vectors. Harness attachment points must be selected for maximum safety.
The Optimization of Decontamination Methods Selected for Contaminated Areas Used in Decommissioning of CANDU–6 NPP
The En-vac system requires a maximum of 640-scfm compressed air with an air dryer, and 440VAC, 3-phase, 60-Hz, 120-kW-peak demand electrical power. Surface pretreatments are not required, though. Since the unit is designed for flat surfaces, piping and conduit must be removed as necessary. In operation, the En-vac robot is placed on a wall and attached to the auto tension winch, a safety device consisting of a winch and cable system tethered to the wall and connected to the robot to prevent accidental damage to the robot, equipment, and nearby personnel in case of a loss of power or vacuum. The auto tension winch also assists in repositioning the robot on the wall after moving around piping and conduit, as the robot is not capable of scabbling on small piping. The robot can scabble to a depth of 1 / 8 inch on the walls, removing multiple layers of paint and surface concrete, and within eight inches of piping and other obstructions. An optional Accessory Corner Robot can be quickly installed on the same working umbilical, using the same supporting equipment as the En-vac robot. The corner robot is designed to remove a 20-inch path by using the winch system to move along wall corners. The En-vac Robotic Wall Scabbler is a mature technology that performed well during demonstration. Operating the robot unit required no special skills; however, the En-vac system required the user to be trained to operate the equipment. According to the operators, this technology completed a large surface area much more easily and faster than the baseline technology. The system was user-friendly and able to remove paint at a faster rate than the baseline technology. It was noted that anchor points are needed to support the robot in case of emergency power shutdown.
8. Conclusions Following a deep review of commercially available
9
decontamination methods and after a cost-benefit analysis, we conclude the following for CANDU-6: y The physical techniques will apply more efficiently to concrete surfaces. y En-Vac Robotic Wall Scabbler is the more efficient method for concrete surfaces. y Soft Media Blast Cleaning is a very efficient method for metal surfaces (see in Fig. 7 – the workflow for this method, which is the input for simulation with ProVision). The chemical techniques can remove any contaminant in theory. In practice, however, it is more limited since the same processes that attack the contaminant can also attack the surface material on which the contaminant resides. Therefore, not all surfaces (e.g., porous material) are amenable to its use, and we consider that these techniques are suitable especially for metallic surfaces.
References [1] [2]
[3]
[4]
[5]
[6] [7]
[8]
OECD / NEA, Decommissioning of Nuclear Power Plants, Policies Strategies and Costs, Paris, 2003. IAEA, Planning, managing and organizing the decommissioning of nuclear facilities: lessons learned, TECDOC-1394, Vienna, May, 2004. EC, IAEA and OECD/NEA, Standardized List of Definitions for Cost Items for Decommissioning Projects, Paris, 1999. NEA, Decontamination techniques used in decommissioning activities, A Report by the NEA Task Group on Decontamination, NEA-OECD, Paris, 1998. IAEA, State of the art technology for decontamination and dismantling of nuclear facilities, Technical Reports Series no. 395, Vienna, 1999. IAEA, Financial aspects of decommissioning, Report by an Expert Group, TECDOC-1476, Vienna, Nov. 2005. U.S. Environmental Protection Agency, Technology reference guide for radiologically contaminated surfaces, EPA-402-R-06-003, USA, Apr., 2006. Subsidiary of Technology and Engineering for Nuclear Projects, Researches for developing decontamination methodologies and radioactive waste management generated by nuclear facilities decommissioning, Phase 3, Contract: 21-051 / 2007, Bucharest, Romania, Feb., 2009.
May 2010, Volume 4, No.5 (Serial No.30) Journal of Energy and Power Engineering, ISSN 1934-8975, USA
Power Consumption Prediction for an Intelligent Air-Cushion Track Vehicle: Fuzzy Expert System H. Altab1, 2, R. Ataur1, A.K.M. Mohiuddin1 and A. Yulfian1 1. Department of Mechanical Engineering, Faculty of Engineering, International Islamic University Malaysia, Kuala Lumpur 50728, Malaysia 2. Department of Mechanical Engineering, Faculty of Engineering, Universiti Industri Selangor, Kuala Selangor 45600, Malaysia
Received: November 6, 2009 / Accepted: February 9, 2010 / Published: May 31, 2010. Abstract: This paper describes the unique structure of an intelligent air-cushion system of a hybrid electrical air-cushion track vehicle working on swamp terrain. Fuzzy expert system (FES) is used in this study to control the swamp tracked vehicle’s intelligent air cushion system while it operates in the swamp peat. The system will be effective to control the intelligent air-cushion system with total power consumption (PC), cushion clearance height (CCH) and cushion pressure (CP). Ultrasonic displacement sensor, pull-in solenoid electromagnetic switch, pressure sensor, micro controller and battery pH sensor will be incorporated with the FES to investigate experimentally the PC, CCH and CP. In this study, we provide illustration how FES might play an important role in the prediction of power consumption of the vehicle’s intelligent air-cushion system. The mean relative error of actual and predicted values from the FES model on total power consumption is found as 10.63 %, which is found to be alomst equal to the acceptable limits of 10%. The goodness of fit of the prediction values from the FES model on PC is found as 0.97. Key words: Power consumption, fuzzy expert system, ultrasonic displacement sensor.
1. Introduction With the high demands of off-road vehicles over soft terrain and swamp peat such as agriculture, forestry, construction and the military, there is a need to increase the knowledge about intelligent air-cushion system of swamp peat vehicle. However, prepared or unprepared tracks inherently have uneven profile for situations of vehicles travelling on deformable road surfaces. The Swamp peat terrain is a most critical terrain in Malaysia where the plantation companies are expanding their plantations. It is reported by Malaysia Agriculture Research Development Research Institute [1] that the swamp peat terrain surface mat thickness is closed to 70 mm and ground contact pressure is 7kN/m2. There is not a single vehicle in Malaysia developed to do the transportation operation on such Corresponding author: H. Altab, Lecturer, Research fields: Automotive Engineering, Intelligent system, Vehicle Dynamics and Off-road Vehicles. E-mail:
[email protected].
terrain. A hybrid electrical air-cushion tracked vehicle has been developed and tested for such a swamp terrain. There were some problems which were incurred during operation on the swamp terrain due to the controlling problem of the air-cushion system. As the vehicle is more string on power consumption, it is crucial for the vehicle to reduce the dragging motion resistance. From this study, the air-cushion system will be controlled by applying Fuzzy Logic technique more precisely during operation the vehicle over the swamp terrain and would be able to reduce the dragging motion resistance significantly. The details of the vehicle are given in Ref. [2]. In the transportation era, many expert systems were designed for predicting the power consumption of the vehicle. Fuzzy Logic was proposed [3, 4] for wing rock and power demand prediction. To predict the power consumption on wheeled air-cushion and semi-tracked air-cushion vehicles, Fuzzy Logic has been applied
Power Consumption Prediction for an Intelligent Air-Cushion Track Vehicle: Fuzzy Expert System
successfully to a large number of expert applications. It is a knowledge based technique performs exceptionally well in non linear and complex systems. This work presents the model of fuzzy expert system (FES), comprising the control rules and term sets of variable with their relates fuzzy sets, in which classical set theory is extended to handle partial memberships, enabling to express vague human concepts using fuzzy sets and also describe the corresponding inference systems based on fuzzy rules [5]. In fuzzy rule-based systems, knowledge is represented by if-then rules. The aim of this study is to construct fuzzy knowledge-based models based on the Mamdani approach for the prediction of the power consumption of the intelligent air-cushion system. A comparative performance analysis of this approach, by sampling data collected from the operation, was used to validate the fuzzy models.
2. Methodology 2.1 Prototype Vehicle Development A custom-built light weight small-scale vehicle was made for the transportation operation of agricultural and industrial goods on swamp peat in Malaysia [2]. The steering of the developed vehicle was achieved by means of an individual switch of the DC motor with a power of 1.50 kW @ 2.94 Nm. The dry weight of the vehicle was considered as 2.43 kN and it was designed mainly for operating a maximum load of 3.43 kN including a 1.00 kN payload over the swamp peat terrain. The total ground contact area of the vehicle was 1.052 m2 including 0.544 m2 of the air-cushion system. Vehicle was powered by a battery pack comprising eight (8) lead acid batteries. Total power stored in the pack was 10.08 kWh. Battery arrangement was made in such a way that the pack could deliver the power to the DC motors for three hours. The arrangement of the pack: two batteries were connected in series in order to make 24 volts and again each set of two batteries were connected in parallel in order to get the total power of 10.08 kWh. Therefore, the pack was able to power the
11
car for 3 hours before reducing the terminal voltage to 21.4 volts. The vehicle could travel 36 km powered of the single charging battery pack. A small IC Engine power of 2.5 kW @ 4000 rpm was installed on the vehicle to recharge the battery pack with the help of an alternator. The field experiment was conducted on the terrain of length 50 m which was made similarly to swamp peat just on the river side of the International Islamic University Malaysia with loading conditions of 2.43 kN and 3.43 kN and travelling speed of 10 km / h . 2.2 Intelligent Air-Cushion Pressure Control Structure Fig. 1 shows the control system of air-cushion pressure. The pressure of the air-cushion is mainly controlled based on the sinkage of the vehicle. It is noted that the air-cushion system will only be activated once the vehicle sinkage will be closed to or equal to 70 mm. The ultrasonic displacement sensor (sinkage measuring sensor) will be used to measure the sinkage of the vehicle. The output voltage of the ultrasonic displacement will be used to operate the pull-in solenoid switch through the microcontroller which will close the circuit of the compressor motor. So, the motor of the compressor will get the power from the battery. The engine will be used in this study only to charge the batteries pack if it is necessary. Distribution of vehicle load to the air-cushion will be controlled by Fuzzy Logic controller by maintaining the inside pressure of the cushion. Accumulator will be used in this study to reduce the power consumption of the air compressor by keeping
Fig. 1 Control system of air-cushion pressure.
12
Power Consumption Prediction for an Intelligent Air-Cushion Track Vehicle: Fuzzy Expert System
air inside the accumulator. In the system, air accumulator defines the compressor running condition. Since air accumulator will be kept in charge with the compressed pressure for releasing to the air-cushion chamber, so the power of the compressor motor can be optimized. Air compressor will be operated powered by a battery. When it is necessary to run the compressor, then it will be automatically connected with the battery with activating pull-in magnetic switch by the microcontroller. At any instant, the sinkage is measured by the high precision (1 mm resolution) distance measuring sensor. Then optimum pressure is determined based on the developed optimum pressure-sinkage relationship and the pressure in the cushion chamber is controlled by the Fuzzy controller and continuously monitored by the pressure sensor attached with the cushion chamber. 2.3 Theoretical Model and Analysis The theoretical model in this study is made by incorporating the mathematical models mentioned in Ref. [2]. When the vehicle with a constant load is subjected to external disturbances, such as uneven or slope of terrain surfaces, the clearance height of the vehicle, load distribution between driving system and air cushion system changes and thus the total power requirement changes. Hence, in order to find an optimal range of load distribution which is corresponding to minimum power requirements, the cushion pressure needs to be controlled within optimal range. The total power requirement P of the vehicle includes the power for air cushion system Pc and the power for driving system (propulsion system) Pd, which is given by: (1) P = Pc + Pd In this study, the intelligent air-cushion system for swamp peat vehicle is designed mainly for supporting the vehicle’s partial load and making the vehicle mobile to do the basic operation over the terrain. As the vehicle is designed to travel over the terrain at 10-15 km / h, so the aerodynamic motion resistance is ignored.
Hence, the total motion resistance Rt will be only the sum up of motion resistance due to terrain compaction Rc, inner resistance Rin and the dragging motion resistance Rdrag. For peat terrain, the compaction resistance Rc is given by Eq.(2), ⎛kpz Rc = 2B⎜ ⎜ 2 ⎝
where z= Dhtc =
⎛ k p Dhtc ⎞ ⎟⎟ ± − ⎜⎜ ⎝ 4mm ⎠
2
+
4 mm z 3 D htc
3
⎞ ⎟ ⎟ ⎠
(2)
⎤ ⎡⎛ k p Dhtc ⎞ 2 D ⎟⎟ + htc p′⎥ ⎢⎜⎜ mm ⎥ ⎢⎣⎝ 4mm ⎠ ⎦ 2
4 BL and p ′ = Wt = W − p c AC 2(L + B ) (L )(2 B ) 2 BL
Where, p ′ is the normal pressure of the vehicle in N / m2, z is the sinkage in m, L is the track ground contact length in m, B is the track width in m, mm is the surface mat stiffness in N / m3, kp is the underlying peat stiffness in N / m3, Dhtc is the track hydraulic diameter in m when air cushion touches the ground, AC is the air-cushion effective area, W is the total weight of the vehicle in N, Wt is the weight supported by the two tracks (weight of driving system or weight supported by propulsion system) in N, and pc is the cushion pressure in N / m2. The total motion resistance of the vehicle can be defined as, ⎛ kpz2 4 + Rt = 2B⎜ mm z3 ⎜ 2 3 D htc ⎝ ⎛ W − p c Ac ⎞ ⎟⎟ [222 + 3 v ] + ⎜⎜ ⎝ 1000 g ⎠
⎞ ⎟ ⎟ ⎠
+ p c AC tan ϕ
(3)
Where, v is the vehicle theoretical speed in km / h, g is the gravitational acceleration in m / s2, and ϕ is the terrain internal friction angle in degrees. Based on Eqs. (1) and (3), the total vehicle power requirement P is rewritten as below, P = Pc + Pd 1
3 ⎛ 2 ⎞2 = hc Lc Dc ⎜⎜ ⎟⎟ ( p c ) 2 ⎝ρ⎠
⎡ ⎛ kpz2 ⎞⎤ 4 m m z 3 ⎟⎥ vt + ⎢2 B⎜ + ⎟ ⎜ 2 3D htc ⎠⎦⎥ ⎣⎢ ⎝ ⎤ ⎡⎛ W − Wv ( ac ) ⎞ ⎟[222 + 3v ] + p c AC tan ϕ ⎥ vt + ⎢⎜⎜ ⎟ ⎥⎦ ⎣⎢⎝ 1000 g ⎠
(4)
Power Consumption Prediction for an Intelligent Air-Cushion Track Vehicle: Fuzzy Expert System 1 2
Where, Pc = pc Q = hc Lc Dc ⎛⎜⎜ 2 ⎞⎟⎟ ( pc ) 2 3
⎝ρ⎠
and ⎡ ⎛ kpz2 4 mm z3 Pd = ⎢ 2 B ⎜ + ⎜ 2 3 D htc ⎝ ⎣⎢
⎡⎛ W − p c Ac + ⎢ ⎜⎜ ⎣ ⎝ 1000 g
⎞⎤ ⎟⎥vt ⎟⎥ ⎠⎦
⎤ ⎞ ⎟⎟ [222 + 3 v ] + p c A C tan ϕ ⎥ v t ⎠ ⎦
Where Q is the volume flow of air from compressor in m3 / s, hc is theoretical clearance height in m, Lc is the air-cushion perimeter in m, Dc is the discharge coefficient, ρ is the air density in kg / m3, and vt is the vehicle theoretical speed in m / s.
for the inputs and outputs. In this study, the center of gravity method for defuzzification was used because these operators assure a linear interpolation of the output between the rules. For the two inputs and three outputs, a fuzzy associated memory or decision (also called decision rule) is shown in Table 1. Total of 25 rules were formed. Fuzzifications of the used factors are made by aid follows functions. These formulas are determined by using measurement values. ⎧i ;0.01 ≤ i1 ≤ 0.03⎫ CH (i1 ) = ⎨ 1 ⎬ ⎩ 0; otherwise ⎭
3. Fuzzy Logic Expert System The Fuzzy Logic expert system is introduced in this study for the prediction of total power consumption of the vehicle with controlling the intelligent air-cushion system. The main advantage of Fuzzy Logic is that it can be tuned and adapted if necessary, thus enhancing the degree of freedom of the system in Ref. [6]. The general configuration of the fuzzy expert system, which is divided into four main parts in Ref. [7] as shown in Fig. 2 are: (1) Fuzzification- which converts controller inputs into information that the inference mechanism can easily use to activate and apply rules, (2) Knowledge base-which contains a fuzzy logic quantification of the expert’s linguistic description on how to obtain satisfactory control for a particular application, (3) Inference-which creates the control actions according to the information provided by the fuzzification module by applying knowledge about how best to control the plant, and (4) Defuzzification-which calculates the actual output, i.e., converts fuzzy output into a precise numerical value (crisp value) and then sends them to the physical system (plant or process), so as to execute the control of the system. For implementation of fuzzy values into the intelligent air-cushion system by using FES, CH and CP were used as input parameters and PC was used as output parameter. For fuzzification of these factors, the linguistic variables very low (VL), low (L), medium (M), high (H) and very high (VH) were used
13
⎧i ;0.5 ≤ i 2 ≤ 4⎫ CP (i2 ) = ⎨ 2 ⎬ ⎩ 0; otherwise ⎭ ⎧o ;2 ≤ o3 ≤ 10⎫ PC (o3 ) = ⎨ 3 ⎬ ⎩ 0; otherwise ⎭
(5) (6) (7)
Prototype triangular fuzzy sets for the fuzzy variables, namely, clearance height (CH), cushion pressure (CP), and total power consumption (PC) are set up using MATLAB. The membership values used for the FES are obtained from the above formulas and are shown in the Figs. 3, 4 and 5. The linguistic expressions and membership func-
Fig. 2 Structure of the fuzzy logic system. Table 1 Rule base fuzzy system. Rules 1 10 15 20 25
Input variables CH CP VL VL L VH M VH H VH VH VH
Input variable PC VL H H M M
14
Fig. 3 height.
Power Consumption Prediction for an Intelligent Air-Cushion Track Vehicle: Fuzzy Expert System
Prototype membership functions for clearance
Fig. 4 Prototype membership functions for cushion pressure.
Fig. 5 Prototype membership functions for total power consumption.
tions of CH obtained from the developed rules and formulas are given as following.
⎧ i1 − 0.02 ⎫ ⎪ 0.005 ;0.02 ≤ i1 ≤ 0.025⎪ ⎪ ⎪ ⎪ 0.03 − i1 ⎪ μ H (i1 ) = ⎨ ;0.025 ≤ i1 ≤ 0.03 ⎬ 0 . 005 ⎪ ⎪ ⎪0; i1 〉 0.03 ⎪ ⎪ ⎪ ⎩ ⎭ i 0 ; ≤ 0 . 025 ⎫ ⎧ 1 ⎪ ⎪ 0.03 − i ⎪ ⎪ 1 μVH (i1 ) = ⎨ ;0.025 ≤ i1 ≤ 0.03⎬ 0 . 005 ⎪ ⎪ ⎪⎭ ⎪⎩1; i1 〉 0.03
(11)
(12)
Similarly, the linguistic expressions and membership functions of CP and PC are obtained. The determination of conclusion is taken when the rules are applied to deciding what the power consumption to the plant (vehicle) should be. To do this, the recommendations of each rule are considered independently. Then later, all the recommendations from all the rules are combined to determine the total power consumption inputs to the vehicle. In defuzzification stage, truth degrees (μ) of the rules were determined for the each rule by aid of the min and max between working rules. For example, for CH = 0.022 m and CP = 2.25 kPa, using Figs. 3 and 4 and using Table 1, it is observed that the rules 13, 14, 18 and 19 are on (i.e., their values are non zero) and all other rules have membership functions that are off (i.e., their values are zero). To get the fuzzy inputs, the values for CH and CP are obtained as μ M (CH ) = 0.6 , μ H (CH ) = 0.4 μ M (CP ) = 1 and
⎧1; i1 〈0.01 ⎫ ⎪ 0.015 − i ⎪ ⎪ ⎪ 1 ;0.01 ≤ i1 ≤ 0.015⎬ μVL (i1 ) = ⎨ 0 . 005 ⎪ ⎪ ⎪⎩0; i1 〉 0.015 ⎪⎭
(8)
⎫ ⎧ i1 − 0.01 ⎪ 0.005 ;0.01 ≤ i1 ≤ 0.015 ⎪ ⎪ ⎪ ⎪ ⎪ 0.02 − i1 μ L (i1 ) = ⎨ ;0.015 ≤ i1 ≤ 0.02⎬ 0 . 005 ⎪ ⎪ ⎪ ⎪0; i1 〉 0.02 ⎪ ⎪ ⎭ ⎩
μ H (CP ) = 0.25 and the strength (truth values) of the four rules are obtained as α 13 = min{μ M (CH ), μ M (CP )} = min(0.6,1) = 0.6 α 14 = min{μ M (CH ), μ H (CP )} = min (0.6,0.25) = 0.25 α 18 = min{μ H (CH ), μ M (CP )} = min (0.4,1) = 0.4 α 19 = min{μ H (CH ), μ H (CP )} = min (0.4,0.25) = 0.25 The membership functions for the conclusion
(9)
reached by rule (13), which is denoted as μ13 , is
⎧ i1 − 0.015 ⎫ ⎪ 0.005 ;0.015 ≤ i1 ≤ 0.02⎪ ⎪ ⎪ ⎪ 0.025 − i1 ⎪ ;0.02 ≤ i1 ≤ 0.025⎬ μ M (i1 ) = ⎨ 0 . 005 ⎪ ⎪ ⎪0; i1 〉 0.025 ⎪ ⎪ ⎪ ⎩ ⎭
given by
(10)
α 13 (PC ) = min {0.6, μ L (PC )}
Similarly, the membership functions for the conclusion reached by rules (14), (18) and (19), are α 14 (PC ) = min{0.25, μ M (PC )} α 18 (PC ) = min{0.4, μ L (PC )}
α 19 (PC ) = min{0.25, μ M (PC )}
Power Consumption Prediction for an Intelligent Air-Cushion Track Vehicle: Fuzzy Expert System
In this stage, defuzzification operation is considered as the final component of the fuzzy controller. Defuzzification operates on the implied fuzzy sets produced by the inference mechanism and combines their effects to provide the “most certain” controller output (plant input). The output denoted by “PC crisp” can be calculated which represents the conclusions of the fuzzy controller. Due to its popularity, the “center of gravity” (COG) defuzzification method Ref. [7] is used for combing the recommendations represented by the implied fuzzy sets from all the rules Center of gravity method for singletons (GOGS) defuzzification method is a weighted average of the center values of the output membership function centers (i.e., their shape does not matter, just their center value). The output membership, values are multiplied by their corresponding singleton values and then are divided by the sum of membership values. ∑ bi μ i (13) PC crisp =
∑μ
15
controller such as total power consumption is within the range of the vehicle performance according to the terramechanics reported in Ref. [8-9].
4. Results and Discussions To optimize the power consumption of the vehicle, the design parameters of the vehicle as shown in Table 2 are taken into accounts. The power consumption of the vehicle is optimized based on the total motion resistance which is mainly for compaction motion resistance and dragging motion resistance. From the experimental result [2], it is found that compaction and dragging motion resistance are mainly incurred due to the load distribution from the track system to the air-cushion system. The present study is focusing on load distribution (defined as the load transferred from the driving system to the air cushion system) for mini-
i
Where bi is the position of the singleton in i th universe, and μ(i) is equal to the firing strength of truth values of rule i. Using the above mentioned rules in Fig. 5, the following values are obtained as b13 = 2 , b14 = 4 , b18 = 2 , and b19 = 4
Using Eq. (13) with membership values obtained from the rules, the crisp output PCcrisp could be obtained as 2.67 kW. The fuzzy control surface is developed using MATLAB as shown in Fig. 6. The relationships between clearance height and cushion pressure are on the input side, and controller output total power consumption are on the output side. The control surface is the output plotted against the two inputs, and displays the range of possible defuzzified values for all possible inputs. The plot results from the interpolation of rule base with twenty five rules as shown in Table 1. The plot is used to check the rules and the membership functions on determining the effect of input parameters on the output parameters such as total power consumption. Fig. 6 shows that the output of the
Fig. 6 Control surface of the fuzzy inferring system for total power consumption. Table 2 Terrain and vehicle design parameters. Parameters Total vehicle load, W Length of track ground contact, Lt Width of track ground contact, Bt Length of the air-cushion, Lac Width of the air-cushion, Bac Air cushion perimeter, LC Vehicle theoretical velocity, vt Air density, ρ Surface mat stiffness, mm Underlying peat stiffness, kp
Values 3433.5 1.00 0.254 0.80 0.68 2.96 2.78 1.20 13, 590 171, 540
Units N m m m m m m/s kg / m3 N / m3 N / m3
16
Power Consumption Prediction for an Intelligent Air-Cushion Track Vehicle: Fuzzy Expert System
Fig. 7 Effect of load distribution ratio on total power consumption.
Furthermore, the correlation between actual and predicted values (from FES model) of total power consumption for different load distribution conditions is also examined. The relationships are significant for all the parameters in different operating conditions. The correlation coefficient of total power consumption is found as 0.96. The mean relative error of actual and predicted values from the FES model is found as 10.63 %. For the parameter, the relative error of predicted values is found to almost equal to the acceptable limits of 10%. The goodness of fit of the prediction values from the FES model is found as 0.97. The value is found to be close to 1.0 as expected.
5. Conclusions
Fig. 8 Correlation between measured and predicted values of total power consumption.
mizing total power consumption. The effect of load distribution on the power consumption for the vehicle has been investigated. Fig. 7 shows the relationship between load distribution ratio and total power consumption. From the figure, it is observed that the load distribution ratio affects the total power consumption significantly as total power consumption linearly increases with the increase of load distribution ratio. Total power consumption is varied from 1.25-8.3 kW. Based on established theoretical model and the designed prototype, corresponding simulation and experimental results were carried out and an optimal load distribution ratio of 0.2 [2, 10, 11] was obtained which could result in prediction of minimum power consumption of 3.5 kW. The conclusion is supported by Ref. [2] for the vehicle loading condition of 3.43 kN Fig. 8 shows the relationship between load distribution ratio and total power consumption for the actual and predicted FES values. The mean of actual and predicted values are found as 4.03 and 4.22 kW.
This paper presents an adaptive approach based on the use of fuzzy logic for the prediction of total power consumption for an intelligent air-cushion track vehicle in transportation efficiency and fuel efficiency. With comparison to other predictive modeling techniques, fuzzy models have the advantage of being simple (rule base and membership functions) and robust. In this study, according to evaluation criteria of predicted performances of developed fuzzy, knowledge-based model was found to be valid from the display result of the control surfaces. However, the conclusions drawn from this investigation are as follows: Load distribution could be controlled by controlling cushion pressure as a control parameter using fuzzy logic controller which could significantly reduce the vehicle total power consumption. The developed model can be used as a reference for the full scale prototype which is being carried out as the model will be developed with incorporating the output of the ultrasonic sensor, pressure control sensor, micro controller and battery pH sensor.
Acknowledgments The authors are grateful for the financial assistance supported by International Islamic University Malaysia (IIUM).
Power Consumption Prediction for an Intelligent Air-Cushion Track Vehicle: Fuzzy Expert System
References [1]
[2]
[3]
[4]
[5]
B.J. Jamaluddin, Sarawak: peat agricultural use, Malaysian Agriculture Research and Development Institute (MARDI) 2002, pp. 1-12. R. Ataur, A.K.M. Mohiuddin, I. Faris, H. Altab, Development of hybrid electrical air-cushion tracked vehicle for swamp peat, Journal of Terramechanics 47 (1) (2010) 45-54. G.A. Sreenatha, J.Y. Choi, P.P. Wong, Design and implementation of fuzzy logic controller for wing rock, International Journal of Control, Automation and Systems 2 (4) (2004) 494-500. A. Al-Anbuky, S. Bataineh, S. Al-Aqtash, Power demand prediction using fuzzy logic, Control Engineering Practice 3 (9) (1995) 1291-1298. K. Carman, Prediction of soil compaction under pneumatic tires a using fuzzy logic approach, Journal of Terramechanics 45 (2008) 103-108.
[6]
17
A. Rajagopalan, G. Washington, G. Rizzani, Y. Guezennec, Development of fuzzy Logic and neural network control and advanced Emissions modeling for parallel hybrid vehicles, Center for Automotive Research, Intelligent Structures and Systems Laboratory, Ohio State University, USA, 2003. [7] M.P. Kevin, Y. Stephen, Fuzzy Control, Addison Wesley Longman, Inc., Menlo Park, USA, 1998. [8] J.Y. Wong, Theory of Ground Vehicles. John Willey & Sons, Inc., New York, 1989. [9] J.A. Okello, M. Watany, D.A. Crolla, Theoretical and experimental investigation of rubber track performance models, Journal of Agri. Engg. Research 69 (1998) 15-24. [10] Z. Luo, Y. Fan, Load distribution control system design for a semi-track air-cushion vehicle, Journal of Terramechanics 44 (4) (2007) 319-325. [11] Z. Luo, F. Yu, B.C. Chen, Design of a novel semi-tracked air-cushion vehicle for soft terrain, Journal of Vehicle Design 31 (1) (2003) 112-123.
May 2010, Volume 4, No.5 (Serial No.30) Journal of Energy and Power Engineering, ISSN 1934-8975, USA
Dynamic Characteristics of the Crankshaft System with Coupling Effect S.H. Zhang and K. Jia School of Mechanical and Automation Engineering, Shanghai Institute of Technology, Shanghai 200235, China Received: December 22, 2009 / Accepted: March 2, 2010 / Published: May 31, 2010. Abstract: The nonlinear dynamic model of the marine diesel crankshaft system with a propeller and 6 cranks is established, in which the variable moment of inertia of the linkage and the piston, coupling effect between torsional and axial vibration, the actuating force applied on the piston, the actuating torque and force applied on the propeller is included. The governing equations of the model denote a strong nonlinear and non autonomous system. By numeric simulation, the dynamic response of the system to initial displacement and initial speed, variable moment of inertia, the pressure applied on the piston by combustion gas, the torque and the axial force applied on the propeller by fluid is researched respectively. According to the research results, the variable moment of inertia and coupling effect between torsional and axial vibration are the fundamental reason for nonlinear vibration. Different actuating factors can not only result in different frequency components of the response, but make the same frequency component have different vibration amplitude. The dynamic behavior of the system is not influenced obviously by the actuating torque and force applied on the propeller. There is obvious difference in sensitivity of the dynamic response in the different direction to the same actuating factor. Key words: Coupling effect between torsional and axial vibration, nonlinear dynamic model, crankshaft system, dynamic response.
1. Introduction In order to improve the efficiency of the marine diesel engine with large power and low speed, its stroke and length of the crank is longer obviously than the length of other engines, which results in lower stiffness in the torsional and axial direction of the crankshaft system, but its bending stiffness is enhanced. Therefore, when the crankshaft is connected whit a propeller, torsional, axial and coupled vibration caused by the torque and the force applied on the propeller and by the pressure applied on the piston is the fundamental behavior. In the research on coupled torsional and axial vibration, the phenomenon of coupled torsional and axial vibration is not only explained by Li, but its principle is also studied by means of theoretical and testing method [1-3]. In order to establish coupled Corresponding author: S.H. Zhang, Ph.D., professor, research fields: mechanical dynamics and simulation of mechanical system. E-mail:
[email protected].
torsional and axial vibration model, Zhang employed equivalent coupling stiffness, equivalent acceleration and speed coefficients [4]. According to the characteristics of the modern ship’s crankshaft with long stroke and lower axial stiffness, Ying studied coupled vibration model, examples and vibration absorption method. His model is frequently used as the later Ref. [5-7]. Over the years, in order to economize energy, the marine diesel engine with long stroke has taken great progress, therefore more attention is paid to coupled torsional and axial vibration [8-10]. Because there is not an ideal mathematical method, the dynamic model involved in above research is a linear model under the most conditions, and a few nonlinear dynamic models are simplified greatly. The model and its result can not really show the behavior of the system. In the paper, the marine diesel crankshaft 4-6S60MC-C is used as an object. In the case of the consideration of a propeller, variable moment of inertia of the linkage and the piston, and coupling effect
19
Dynamic Characteristics of the Crankshaft System with Coupling Effect
between torsional and axial vibration, the nonlinear dynamic model of the system will be established. The response of the marine diesel engine crankshaft system with a propeller to all kinds of actuating factors will be studied in order to reveal its dynamic characteristics.
2. Coupled Torsional and Axial Vibration Model In terms of kinetics of the diesel engine, the moment of inertia of the crank and the linkage mechanism can be approximated to as follows. ⎡ r ⎤ I (ωt + ϕ ) = I 0 ⎢1 − cos 2 (ωt + ϕ ) ⎥ (1) ⎣ l ⎦ 1 I 0 = I A + Mr 2 2 M = mB +
lA ml l
In Eq. (1), r is the radius of the crank, l is the length of the linkage, ω is the speed of the crankshaft, t is time, ωt + ϕ is the angle between the crank and moving direction of the piston, ϕ is the initial phase, mB is the mass of the piston, ml is the mass of the linkage, lA is the distance from the linkage centre of the mass to centre of the linkage journal, and IA is the moment of inertia of the crank and the equivalent mass of the linkage about rotating centre. If kx is supposed to be the axial stiffness of the unit crank system. According to Ref. [8], the pressure applied on the piston is transmitted to the linkage journal through the linkage, by which the equivalent axial force is caused. The axial displacement of any near by bearing journal caused by the equivalent axial force is as follows. rP l 2 (2) x= r P 16 EI In Eq. (2), l p is the length of the crank pin, EI is the bending stiffness of the crank pin, and Pr is the radial force applied on the linkage journal. The equivalent axial force caused by the radial force Pr is as follows. Px = k x
rPr l p2 8 EI
(3)
The component force in the linkage direction caused by the pressure Pg applied on the piston is as follows. Fg =
Pg ⎡r ⎤ 1 − ⎢ sin(ω t + ϕ ) ⎥ ⎣l ⎦
(4)
2
Fg will cause the radial force Pr, the tangential force Pt, and the torque Mt, which is applied on the linkage journal. If the influence of the angle between the linkage and moving direction of the piston on the fore and torque is neglected, the radial force Pr, the tangential force Pt, and the torque Mt are as follows. Pr = Pg cos (ωt + ϕ ) (5) Pt = Pg sin (ωt + ϕ )
(6)
M t = r ⋅ Pg ⋅ sin (ωt + ϕ )
(7)
A crankshaft system with a propeller and 6 cranks is shown in Fig. 1. The lumped method is used to establish the dynamic model. The mass and moment of inertia is simplified and added on the centre of the bearing journals. The model is used to study the relative torsional vibration ( θi +1 − θi ) and the relative axial vibration ( xi +1 − xi ) of the propeller and the mass plate. Suppose k xi is the axial stiffness, kti is the torsional stiffness, and the direction of angular speed ω is along the x coordinated axis. Suppose the resistance torque Mm applied on the propeller by fluid is opposite direction of the angular speed ω, which always prevent the crankshaft rotating. Suppose Pm is coupled fluid force, in which, the damping force is included, M ti is driving torque, and Pri is the radial force produced by combustion gas. The centre of the bearing between the propeller and the crank is used as a boundary. The
Px1=Pm
ω
ktx1,kxt1 ktx6,kxt6 kt1, kx1 ktx2,kxt2 kt2, kx2 ktx3,kxt3 ktx4,kxt4 ktx5,kxt5 kt6, kx6 kt3, kx3 kt4, kx4 kt5, kx5
•
(θ2, x2) Mt1=Mm (θ1, x1) m2, I2 m1, I1 Px2, Mt2
•
•
(θ4, x4) m4, I4 Px4, Mt4
•
•
•
(θ6, x6) (θ7, x7) m6, I6 m7, I7 Px6, Mt6 Px7, Mt7
(θ5, x5) (θ3, x3) m5, I5 m3, I3 Px5, Mt5 Px3, Mt3 Fig. 1 Model of the crankshaft system with a propeller and 6 cranks.
20
Dynamic Characteristics of the Crankshaft System with Coupling Effect
rotating mass and the propeller at left side are simplified as m1 and I1 . The rotating shaft, the crankshaft and the mass plate are simplified as m2 and I 2 . The rest elements may be deduced by analogy. Because the variable moment of inertia is caused by reciprocation motion of the linkage and the piston, when the axial vibration is studied, the crank mass is only considered as constant, and involved in the mass plate. When the axial stiffness k xi and the torsional stiffness kti of the crankshaft are calculated, the
in the elastic force of the equation, it is a strong nonlinear and non autonomous system. Because there is not an ideal mathematical method, the governing Eq. (8) is only solved by means of numerical method, and its analytical formulas can not be got. Eq. (8) is expressed as matrix form as follows. (10) MX&& + CX& + KX = F In order to make the inertia force and moment of the crankshaft balanced by itself, the phase difference among the 1st, 2nd and 3rd crank, among the 4th, 5th and
centre of the bearing is used as a boundary. When the propeller exists at the left side, the torsional stiffness, the mass and moment of inertia of the shaft used to fix the propeller is taken into account. Suppose ktxi is coupled axial and torsional stiffness, k xti is coupled torsional and axial stiffness. According
6th crank is 120°, the phase difference between the 3rd and 4th crank is 60°. When the diesel engine with 6 cranks operates, there is phase difference among the force applied on every piston.
to Refs. [1, 2, 9], ktxi = k xti , and the frequency of the
The parameters of the crankshaft system are shown in Table 1, which are used to analyze the nonlinear dynamic characteristics of the crankshaft system with a propeller. Some marine diesel engine MANB&6S60MC has 6 cylinders and 2 strokes. Stroke length is 2.292 m. Nominal power is 12240 kW. Rated speed is 105 r / min. The ergogram of combustion gas is expanded into Fourier series. Because the first and the second terms of Fourier series are main components of the ergogram, in order to simplify the calculation, the first and the second terms of Fourier series are used to replace the ergogram function of combustion gas. Therefore, the pressure function of combustion gas can be expressed as follows. Pg =2683746.762cos(ωt )+1741897.077cos(2ωt ) (11) +509476.7445sin(ωt )+631125.1719sin(2ωt )
axial vibration aroused by the torsional vibration is two times frequency of the torsional vibration, because both backward and forward torsional deformation makes the crankshaft shrinking. Let βi = θi +1 − θi , yi = xi +1 − xi , i=1, 2, …, 6, the dynamic equations of the system can be obtained as follows. ⎧ ⎛ 1 1⎞ k k + ⎟ βi − ti−1 βi−1 − ti+1 βi+1 ⎪ β&&i + kti ⎜ I I I I i+1 i ⎝ i+1 i ⎠ ⎪ ⎪ ⎪+ k ⎛⎜ 1 + 1 ⎞⎟ sgn ( β ) y − ktxi+1 sgn ( β ) y i i i+1 i+1 ⎪ txi ⎝ I i+1 I i ⎠ I i+1 ⎪ M M ⎪− ktxi−1 sgn β ( i−1 ) yi−1 = ti+1 − ti ⎪ I I i+1 Ii (8) ⎪ i ⎨ ⎛ 1 k xi−1 k xi+1 1 ⎞ ⎪ && ⎪ yi + k xi ⎜ m + m ⎟ yi − m yi−1 − m yi+1 i ⎠ i i+1 ⎝ i+1 ⎪ ⎪ ⎛ 1 ktxi+1 1 ⎞ sgn ( βi+1 ) βi+1 + ⎟ sgn ( βi ) βi − ⎪+ ktxi ⎜ mi+1 ⎪ ⎝ mi+1 mi ⎠ ⎪ k ⎪− txi−1 sgn ( βi−1 ) βi−1 = Pti+1 − Pti ⎪⎩ mi mi+1 mi
⎧ 1 ⎪ sgn( βi ) = ⎨ 0 ⎪ −1 ⎩
( βi ) > 0 (βi ) = 0
(9)
( βi ) < 0
Because moment of inertia of the system varies with the phase angle of the crankshaft, and the axial vibration and the torsional vibration are coupled by signal function sgn, and the nonlinear function appears
2. Parameters of the Model
When the propeller operates in non uniform wake field, because the state of blade varies with the wake field at every revolution, the torque and axial force applied on the blade vary periodically, which can be calculated by means of empirical formula [4] as follows. Pm =203800cos(ωt )+132280cos(2ωt ) (12) +38688sin(ωt )+47926sin(2ωt ) M m = −3218883.76cos(4ωt ) (13)
21
Dynamic Characteristics of the Crankshaft System with Coupling Effect
Table 1 Parameters of the crankshaft system. Parameters
Value
Parameters
Value
Crank radius r
1.2 / m
Moment of inertia I01
51,116.56 / kg.m2
Linkage length l
2.628 / m
Moment of inertia I02~ I06
10,704.29 / kg.m2
Length of linkage journal lp
0.194 / m
Moment of inertia I07
7,735.595 / kg.m2
Diameter of linkage journal dp
0.720 / m
Equivalent mass m1
25,751 / kg
Elastic modulus E
2.06×10¹¹ / N.m-2
Equivalent mass m2
15,077 / kg
-3
Density ρ
7850 / kg.m
Equivalent mass m3 ~m6
10,407 / kg
Equivalent translating mass of linage and piston mh1~mh6
1530 / kg
Equivalent mass m7
24,860 / kg
Axial stiffness kx1
8
-1
Torsional stiffness kt1
0.269×10⁸ / N.m
8
-1
4.02×10 / N.m
Axial stiffness kx2~ kx6
4.55×10 / N.m
Torsional stiffness kt2~ kt5
6.45×10⁸ / N.m
Coupled torsional and axial stiffness ktx1~ ktx6
5.25×10⁸ / N
Torsional stiffness kt6
3.951×10⁸ / N.m
3. Response Analysis In order to research the response of the system to variable moment of inertia, the torque applied on the piston, the fluid force applied on the propeller, initial speed and initial displacement, in the following study, the above actuating factors are applied respectively. The variable moment of inertia is calculated in terms of Eq. (1), which exists in every occasion. The pressure applied on the piston is calculated in terms of Eq. (11). The actuating torque and the axial force are calculated in terms of Eq. (12) and Eq.(13). When the response of the system to initial displacement and initial speed is researched, initial displacement are all same values, i.e., the linear displacement is 10-6 m, and the angle displacement is 10-6rad in any coordinate direction. Initial speed is also all same values, i.e., the velocity is 0-6m / s, and the angular speed is 10-6 rad / s. According to the simulation results, the response of the relative displacement between any two connected cranks to different actuating factors is similar, but the response of the relative displacement between the propeller and the 1st crank is obviously different from others. Therefore, the response of the relative displacement between the propeller and the 1st crank, between the 1st and 2nd crank is presented in the paper. In order to describe conveniently, Aβ1 and Ay1 are used to denote the relative torsional and axial vibration
amplitude between the propeller and the 1st crank, and Aβ2 and Ay2 are used to denote the relative torsional and axial vibration amplitude between the 1st and 2nd crank. 3.1 Response to Variable Moment of Inertia Except variable moment of inertia, other actuating factors are not exist, i.e., the actuating fore F=0 at the right side of Eq. (10). In this case, because initial displacement and initial speed among the cranks are zero, the signal function sgn is also equal to zero, and the torsional vibration is not coupled with the axial vibration. Because there are not torsional actuating factors, and initial speed and initial displacement are also equal to zero, the torsional vibration dos not appear, and its response is equal to zero. The amplitude of the torsional vibration is actually zero, but the amplitude of the axial vibration is not zero. The frequency spectra are shown in Fig. 2. In the frequency spectra of the axial vibration, fundamental frequency component and 6 times frequency component appear and their amplitude is large. Although 43 times frequency component is also appear, but its amplitude is very small. Fig. 2 denotes that the same frequency component of the axial vibration of the crankshaft can not only be aroused, but other frequency components can also be aroused by the inertia force caused by the reciprocating movement of the piston and the translation of the link-
22
Dynamic Characteristics of the Crankshaft System with Coupling Effect
1
2.5 2 -41.5 Ay1 / m⋅10 1 0.5
Aβ1 / rad 0 -1 0 1
20
ωn / ω
40
0 6
20
40
20
40
ωn / ω
Ay2 / m⋅10-4 4
Aβ2 / rad 0
2 -1 0
20
ωn / ω
40
0
ωn / ω
Fig. 2 Frequency spectra of the response to variable moment of inertia.
age. If the initial torsional state of the crankshaft is not disturbed, and any torsional actuating factor is not applied, the torsional vibration is not aroused. But this phenomenon can not appear actually, because all kinds of actuating factors always exist in practice. 3.2 Response to Initial Displacement and Initial Speed In this case, the actuating torque and the force caused by combustion gas, applied on the piston, are zero, and the actuating force caused by fluid, applied on the propeller, is zero too. When initial displacement and initial speed exist, the time history of the system is shown in Fig. 3, and the frequency spectra corresponding to the time history are shown in Fig. 4.
β1, β2, y1 and y2 are respectively the time history of the relative torsional and the axial vibration displacement between the propeller and the 1st crank, between the 1st and 2nd crank. If Fig. 4 is compared with Fig. 2, it is found that, because of the influence of initial displacement and initial speed, although there is only variable moment of inertia, the torsional vibration is caused by coupling effect between torsional and axial vibration. According to the frequency spectra, the torsional vibration is not periodically, but is obviously gust characteristics. The fundamental frequency component and 6 times frequency component still appear in the axial dynamic response, but 13 times and 20 times frequency
components are new components. The phenomenon means that the influence of initial displacement and initial speed on the dynamic response can not be neglected. Initial displacement and initial speed make the vibration amplitude of the fundamental frequency component descended, and make the vibration amplitude of 6 times frequency component ascended. Because the frequency components of the system are changed by initial displacement and initial speed, the vibration energy corresponding to each frequency is redistributed. The energy of the axial vibration decreases, therefore the amplitude of the fundamental frequency component of the axial vibration descends obviously. 3.3 Response to the Pressure of Combustion Gas Initial displacement and initial speed of the system are equal to zero. The fluid force applied on the propeller is also equal to zero. The actuating torque and the force caused by combustion gas exist only. The frequency spectra of the system response to the actuating torque and the force caused by combustion gas are shown in Fig. 5. In this case, because the variable pressure applied on the piston can arouse the torsional vibration, even if initial displacement and initial speed are equal to zero, the relative torsional angle between any two cranks is zero, therefore coupled torsional and axial vibration is caused.
Dynamic Characteristics of the Crankshaft System with Coupling Effect
5
1 y1 / m⋅10-3 0
β1 / rad⋅10-9
0
-5 14 4
β2 / rad⋅10
14.5 t/s
-1 14
15
2
14.5 t/s
15
14.5 t/s
15
-6
2
y2 / m⋅10-3 0
0 -2 14
14.5 t/s
-2 14
15
Fig. 3 Time history of the response to initial displacement and initial speed. 15
6
-5
Ay1 / m⋅10 10
-12
Aβ1 / rad⋅10
4
5
2 0
20
40
0
ωn / ω 2.5 2
4 Ay2 / m⋅10-4 3
1.5
2
-10
Aβ2 / rad⋅10
20
40
ωn / ω
1
1
0.5 0
20
40
0
ωn / ω
20
40
ωn / ω
Fig. 4 Frequency spectra of the response to initial displacement and initial speed. 12 10 8 Ay1 / m⋅10-5 6 4 2
2 1.5 -10
Aβ1 / rad⋅10
1
0.5 0
20
0
40
15
40
3 Ay2 / m⋅10-4
-11
Aβ2 / rad⋅10
20
ωn / ω
ωn / ω
10
2 1
5 0
20
40
ωn / ω Fig. 5 Frequency spectra of the response to pressure of combustion gas.
0
20
ωn / ω
40
23
24
Dynamic Characteristics of the Crankshaft System with Coupling Effect
In the frequency spectra of the system, there are fundamental frequency component, 2 times frequency component, 6 times frequency component and 20 times frequency component. If Fig. 5 is compared with Fig. 2 and Fig. 4, it is found that, in the frequency response of the relative torsional vibration between the propeller and the 1st crank, the amplitude of 2 times frequency component is obviously increased and is larger than the amplitude of other frequency components. In the frequency response of the relative axial vibration between the propeller and the 1st crank, the fundamental frequency component is obviously decreased, and 6 times frequency component is increased appreciably, and 20 times frequency component is new. This phenomenon denotes that the dynamic response of the system to different actuating factors is different from each other. According to Eq. (11), although the fundamental frequency component and 2 times frequency component are included in the actuating force caused by combustion gas, 2 times frequency component appears only in the response of the torsional vibration, and the fundamental frequency component appears only in the response of the axial vibration. This phenomenon denotes that the sensitivity of the system response in different direction to the actuating factor is different from each other. 3.4 Response to Initial Displacement, Initial Speed and the Pressure of Combustion Gas When there is the actuating torque and the force caused by initial displacement, initial speed and the pressure of combustion gas, the frequency spectra of the system response are shown in Fig. 6. If Fig. 6 is compared with Fig. 4 and Fig. 5, it is found that the dynamic response of the system shown in Fig. 6 is not superposition of the dynamic response shown in Fig. 4 and Fig. 5 caused by the single actuating factor. In addition to new fundamental frequency component in the response of the relative torsional vibration between the propeller and the 1st crank, the amplitude of the
frequency components of the relative axial vibration is also changed. This phenomenon denotes that if the initial state of the crankshaft is changed, or initial axial relative displacement and initial torsional relative speed between any two cranks of the crankshaft is changed, even if the same actuating factor is applied on the system, the dynamic response of the system to the actuating factor can be changed. This phenomenon can not take place in the linear dynamic system. Therefore, by research on coupled torsional and axial vibration of the crankshaft, the phenomenon of the multiple frequency vibration is not only displayed and explained, but the calculation precision can also be improved, and the frequency components of the response are prevented from missing. 3.5 Response to the Pressure of Combustion Gas and Fluid Force When there are only actuating torque and force caused by fluid and the pressure of combustion gas, and initial displacement and initial speed is equal to zero, the frequency spectra of the system response are shown in Fig. 7. If Fig. 7 is compared with Fig. 5, in which the frequency spectra of the response to the pressure of combustion gas is shown, it is known that when the torsional actuating torque and the axial actuating force is applied on the propeller by fluid, the dynamic characteristics of the torsional and axial vibration are not changed obviously. There are still fundamental frequency component, 2 times frequency component, 6 times frequency component and 20 times frequency component. The amplitude of some frequency components is increased or decreased appreciably. 4 times frequency component of the actuating force applied on the propeller does not appear or is very small, because the frequency of the actuating force is far from the natural frequencies corresponding to the system mode. In the study case of the paper, the fluid force applied on the propeller only makes the amplitude of every frequency component changed appreciably.
Dynamic Characteristics of the Crankshaft System with Coupling Effect
12 10 8 Ay1 / m⋅10-5 6 4 2
2 Aβ1 / rad⋅10-10
1.5 1 0.5 0
20
40
0
ωn / ω -11
3
15
-4
Ay2 / m⋅10
Aβ2 / rad⋅10
10
20
40
ωn / ω
2 1
5 0
20
40
0
ωn / ω
20
40
ωn / ω
Fig. 6 Frequency spectra of the response to initial displacement, initial speed and pressure. 12 10 -5 8 Ay1 / m⋅10 6 4 2
2 1.5 Aβ1 / rad⋅10-10
1 0.5 0
20
40
0
ωn / ω -11
Aβ2 / rad⋅10
20
40
ωn / ω 3
12 10 8 6 4 2
Ay2 / m⋅10-4
2 1
0
20
40
0
ωn / ω
20
40
ωn / ω
Fig. 7 Frequency spectra of the response to pressure of combustion gas and fluid force. 12 10 8 Ay1 / m⋅10-5 6 4 2
2 1.5 Aβ1 / rad⋅10
-10
1 0.5 0 2
Aβ2 / rad⋅10-10
20
40
0
ωn / ω
20
40
ωn / ω 3
1.5
Ay2 / m⋅10-4 2
1
1
0.5 0
20
ωn / ω
40
0
20
40
ωn / ω
Fig. 8 Frequency spectra of the response to initial displacement, initial speed, pressure of combustion gas and fluid force.
25
26
Dynamic Characteristics of the Crankshaft System with Coupling Effect
3.6 Response to Initial Displacement, Initial Speed, the Pressure of Combustion Gas and Fluid Force When there are initial displacement, initial speed, the pressure of combustion gas applied on the piston and fluid force applied on the propeller, the frequency spectra of the system response are shown in Fig. 8. If Fig. 8 is compared with Fig. 6, when the fluid force applied on the propeller is involved in the actuating factors, the fundamental frequency component of the response of the relative torsional vibration between the propeller and the 1st crank disappear, and the amplitude of the relative torsional vibration between the 1st and the 2nd crank is increased apparently. At the same time, the amplitude of 6 times frequency component of the axial relative vibration is also increased, and the amplitude of the other frequency components is not changed obviously. If Fig. 8 is compared with Fig. 7, when initial displacement and initial speed are involved in the actuating factors, the amplitude of the relative torsional vibration between the 1st and the 2nd crank is increased apparently, and the amplitude of the axial vibration is not changed obviously, and 4 times frequency component applied on the propeller does not appear.
(4) At the special condition of the paper, the dynamic characteristics of the system are not affected obviously by the fluid force applied on the propeller. (5) There is obvious difference in sensitivity of the dynamic response in the different direction to the same actuating factor.
References [1]
[2]
[3]
[4]
[5]
[6]
4. Conclusions (1) The variable moment of inertia and coupling effect between torsional and axial vibration are the fundamental reason for nonlinear vibration. Even if there is not any outer actuating factor, the variable moment of inertia makes the system vibrate. (2) Although the dynamic characteristics of the system is not affected obviously by initial displacement and initial speed, but the influence is not neglected. (3) The different actuating factors can not only cause different frequency components, but can also make the amplitude of the same frequency component changed.
[7]
[8]
[9]
B.Z. Li, T.X. Song, X.G. Song, On coupled vibrations of reciprocating engine shaft systems (part 1)—axial vibration caused by torsional vibration, Transactions of CSICE 7 (1) (1989) 1-6. B.Z. Li, X.G. Song, T.X. Song, D.X. Xue, On coupled vibrations of reciprocating engine shaft systems (part 2)—progressive torsional-axial coupled vibration, Transactions of CSICE 8 (4) (1990) 317-322. X.G. Song, T.X. Song, D.X. Xue, B.Z. Li, On coupled vibrations of reciprocating engine shaft systems (part 3) -calculation method of coupled at same and double frequencies, Transactions of CSICE 12 (2) (1994) 115-120. H.T. Zhang, Z.H. Zhang, L. Wang, Calculation of coupled axial and torsional shafting vibration of motor ship using system matrix model, Ship Engineering 4 (5) (1994) 36-42. Q.G. Yi, B.Z. Li, M.R. Zhou, The coupled torsion-axial vibration of shafting for a modern long-stroke marine diesel engine (part 1), Ship Engineering 4 (1993) 40-44. B.Z. Li, Q.G. Ying, Coupled tortional-axial shafting vibration for long stroke marine diesel (part 2) ─ case study on resonance curves, Ship Engineering 6 (1994) 37-40. Q.G. Ying, M.R. Zhou, B.Z. Li, The coupled torsion-axial vibration of shafting for a modern long-stroke marine diesel engine (part 3), Ship Engineering 1 (1995) 40-43. T.X. Song, Y. Wang, X.G. Song, B.Z. Li, Analysis of characteristic of axial vibration in low-speed long-stroke marine engine, Journal of Dalian University of Technology 35 (3) (1995) 367-370. H.B. Du, Z.Y. Chen, B. Jing, The mathematical model for the coupled torsional-axial vibration of internal combustion engine shaft system, Chinese Internal Combustion Engine Engineering 13 (2) (1992) 66-74. H.G. Li, Q.G. Sun, Analysis of coupled torsional-axial vibration of crankshaft, Journal of Lanzhou Jiaotong University (Natural Sciences) 23 (1) (2004) 107-110.
May 2010, Volume 4, No.5 (Serial No.30) Journal of Energy and Power Engineering, ISSN 1934-8975, USA
Estimation of Traffic Induced Pollution in Palestine Z. Salhab Mechanical Engineering Dept. College of Engineering & Technology, Palestine Polytechnic University, P.O.B.198, Hebron, West Bank, Palestine
Received: January 6, 2010 / Accepted: February 22, 2010 / Published: May 31, 2010. Abstract: Traffic sector presents a major contributor to air pollution in Palestine. This has been maximized as Israeli closure of major roads resulted in major congestion in most of Palestinian cities in West Bank, which causes high emissions of exhaust gases, such as carbon monoxide (CO), nitrogen oxides (NOx), particulate matters (PM), volatile organic compounds (VOCs) and sulphur dioxide (SO2). In order that traffic induced pollution can be assessed in Palestine, in this paper, an approach is presented by which the traffic emissions can be estimated relying on the emission factors as input together with vehicle types, annual traveled distance, etc.. The outcomes cover the emission from the various types of vehicles in West Bank. Key words: Vehicle emissions, vehicle categories, emission factors, estimated emissions.
1. Introduction Transportation is the major source of air pollution in the West Bank. Three factors make traffic pollution more serious. First, most of the used vehicles are in poor conditions and of old models. Second, low quality fuels are mostly used. Third, the road networks in the West Bank are in poor conditions. This pollution is not assessed and there are no surveys about air pollutants. Air pollution is growing with the increase in population, as well as number of vehicles. In Palestine, transportation is the largest energy consumer sector reaching more than 60% of the total energy source used [1]. Burning of fuel in internal combustion engines releases different pollutant to air, such as NOx, VOCs, CO, PM and others. So, the only mode of transport in the West Bank is road transportation. Presently, the West Bank lacks any functional train, underground or air systems of transportation. The impact of road transportation on the environment depends on the total number of vehicles, type of vehicles, engine capacity, and year of Corresponding author: Z. Salhab, research fields: alternative fuels air pollution and environment, renewable energy, solid waste management. E-mail:
[email protected].
production of vehicles in use, fuel quality and road conditions [2]. The road network in the West Bank is in poor conditions where it is not rehabilitated or maintained for many years. The poor conditions of the roads increase the congestion and hence emissions from the vehicles. Traffic congestion, fumes, noise and parking are problems, common to all West Bank urban areas. Added to this, traffic congestion is regularly created by the Israeli checkpoints which are placed at the entrances of all Palestinian cities and towns in the West Bank. These checkpoints are also a major inducer of vehicle pollution [3]. The direction of dominant wind enhances the air pollution by bringing pollutants caused by Israeli traffic to the West Bank. Over the last two decades, the number of vehicles in the West Bank has increased dramatically. The annual increasing rates of private cars and other vehicle are estimated at 12% and 6% respectively. Between 1975 and 1996, the number of vehicles increased ten times from about 12,964 in 1975 to an estimated 133,386 in 1996 after the emerging of the Palestinian National Authority (PNA) in the Palestinian major cities [4]. Based on transportation air emission inventories in
28
Estimation of Traffic Induced Pollution in Palestine
Applied Research Institute Jerusalem (ARIJ) survey in 1996, it is possible to estimate the annual emission of air pollutants due to vehicle gasoline [5]. Calculations are for private cars only based on estimates that the average production year is 1981- 1984, average engine capacity is between 1,400-2,000 and the total yearly distance traveled by such car is 20,000 kilometers. Thus, at least 45,385 tons of CO, 3,258 tons of SOx, 3,723 tons of NOx, 5,500 tons of HC, and 212 tons of lead were emitted to the West Bank atmosphere in 1996, considering the number of registered cars only. Added to this, the 36,500 settlers' cars in the West Bank are estimated to emit around 11,483 tons of CO, 1,183 tons of SOx, 1,299 tons of NOx, 1,628 of HC, and 80 tons of lead to the West Bank atmosphere [5]. For all previous reasons and because there is no specific emission standards for air pollutants which are the main instrument in any air pollution control program, this paper tries to introduce an assessment of the traffic induced emission and its substantial seriousness concerning public health and the environmentally impact in West Bank areas.
2. Methodology of Calculations For the assessment study a stratified representative sample of about 3% of total number of vehicles in West Bank was taken and an investigation for such sample was conducted to measure the yearly driven distance in order to estimate how much emissions have been released. The sample represents five categories: (1) Private cars. (2) Light public vehicles. (3) Light duty vehicles. (4) Heavy duty vehicles. (5) Buses and others. The collected data (number of vehicles) of a stratified sample and its categories in West Bank districts is illustrated in Table 1. Taken into account the total number of registered vehicles in the West Bank, this could bring the estima-
ted traffic induced emissions as shown in (Table 2) [6]. Stratified sample contains number of vehicles of each category and average annual driven distance (km / year). 2.1 Emission Estimation Techniques Estimates of emissions to air, water and land should be reported for each substance that triggers a threshold. In general, there are many types of emission estimation technique. Select the EET (or combination of EETs) that is most appropriate for purpose achieving. If pollution emission is estimated by using any of these EETs, this data will be displayed on the National Pollutant Inventory (NPI) database as being of acceptable reliability. Theoretical and complex equations or models based on the chemical and physical steps of combustion within the combustion engine can be used to estimate pollutant emission levels. However, the theoretical equations and models are often not developed to the stage where pollutant emission levels of acceptable accuracy can be estimated [7]. Additionally, theoretical and complex equations or models require more detailed inputs, but may provide an emission estimation based on facility-specific conditions. Use of theoretical equations and models to estimate emissions from combustion engines is more complex and timeconsuming than the use of emission factors based on simple engine characteristics such as power or fuel consumption and may not provide a better estimation of pollutant emissions. Direct measurement is likely to be a more accurate method of estimating pollutant emissions than other EETs. Collection and analysis of samples can be very expensive, and complicated and measuring instruments must be available. One of the common methods for estimating emissions is using emission factors which seem to be the simplest method [8]. Emission factors may be used to estimate pollutant emissions in the environment. These emission factors relate the quantity of pollutant
Estimation of Traffic Induced Pollution in Palestine
29
Table 1 Number of vehicles of a stratified sample and its categories in West Bank districts. Type of vehicles
Range (km)
District
1,860
Average driven distance (km/year) 25,300
7,000-60,000
Hebron
415
14,000
9,000-25,000
Bethlehem
1,113
17,299
10,000-25,200
Nablus
1,276
21,460
6,500-32,600
Ramallah
260
7,850
4,630-16,220
Jenin
385
64,771
10,000-95,000
Hebron
150
77,720
8,000-105,000
Bethlehem
228
57,310
33,600-111,000
Nablus
217
43,200
29,600-86,700
Ramallah
104
28,828
9,000-70,000
Jenin
116
132,090
100,400-170,000
Other districts
28
31,720
21,700-42,000
Jenin & other districts
365
14,485
10,065-22,760
Hebron
128
36,262
7,305-116,880
Ramallah
Number of vehicles
Private vehicles
Public vehicles
Light-duty vehicles / under 7,000kg
101
23,433
10,227-35,064
Hebron - Ramallah
107
19,840
10,690-28,900
Nablus
36
15,385
7,800-24,790
Bethlehem
Heavy-duty vehicles / above 7,001 kg
100
29,888
13,149-56,979
Hebron, Ramallah
buses
35
1,370
730-2,215
-
Table 2 Total number of registered vehicles in West Bank. Vehicle class Private Commercial Truck (3,500-7,000 kg) Truck (above 7,001 kg) Public bus Private bus Taxi Motorcycle Trailers / drawbar and semi Agricultural tractor All others Total
Number of vehicles 134,309 24,740 6,518 9,785 1,353 503 10,650 941 1,309 6,053 511 196,672
Bethlehem,
the vehicle are required to estimate pollutant emissions in Refs. [9, 10]: Ekpy,i = LY · EFi (1) Where: Ekpy,i = emissions of pollutant i for a specific type of engine, kg/yr; LY = distance travelled in reporting year, km/yr; EFi = emission factor for pollutant i, for given engine and fuel type, kg/km; i = pollutant type. Tables 3-7 contain the emission factors for categories of road-transport vehicles [5]. For simplifying calculations, the various parameters
emitted from an engine to the distance travelled, in the case of road- transport vehicles. Factors are expressed as kg of pollutant per km travelled in the reporting year.
such as engine speed in the traffic flow, engine load,
2.2 Road-Transport Vehicles
conditions were not taken into considerations which
driving patterns (deceleration and acceleration), unregistered
vehicles
and
traffic
management
are estimated to increase the emission concentrations For road-transport vehicle pollutant emission estimations, the vehicle type and distance travelled by
of about 20%.
Estimation of Traffic Induced Pollution in Palestine
30
Table 3 Emission factors for private vehicles (cars). Pollutant
Emission factor (kg/km)
CO NOx PM VOCs SO2
5.55E-03 9.02E-04 1.80E-05 6.76E-04 4.05E-05
Table 4 Emission factors for public vehicles (taxi). Pollutant CO NOx PM VOCs SO2
Emission factor (kg/km) 3.25E-04 3.43E-04 6.19E-05 5.87E-05 3.63E-05
Table 5 Emission factors for light duty vehicles. Pollutant
Emission factor (kg/km)
CO NOx PM VOCs SO2
7.78E-04 6.36E-04 1.93E-05 2.08E-04 6.70E-05
Table 6 Emission factors for heavy duty vehicles. Pollutant
Emission factor (kg/km)
CO NOx PM VOCs SO2
2.51E-03 6.38E-03 4.94E-04 2.05E-03 1.72E-04
Table 7 Emission factors for vehicles (buses). Pollutant CO NOx PM VOCs SO2
Emission factor (kg/km) 5.06E-03 1.00E-02 5.69E-04 1.81E-03 2.65E-04
Table 8 Estimated and calculated values of traffic emission in the West Bank. Pollutant
Estimated value (tons/year)
CO NOx PM VOCs SO2
14,156 4,221 215 2,268 206
3. Conclusions
Air pollution is becoming a more and more important aspect for transportation, particularly vehicle emissions in urban area. As it is known, transportation in the West Bank is a major source of air pollution. The old models of vehicles, poor road networks, road congestion, low quality fuel used and other engine operating parameters are the major factors that make the air pollution from transportation more serious. The collected data (stratified sample and the interview with drivers) may also affect the result. The objective of this paper is to estimate the traffic induced emissions. The calculated results from the investigation and estimations are shown in Table 8 and they also give the important information that the emitted amounts of pollutants must be controlled. So, it should be a continuous inspection and install pollution monitoring to reduce the level of these pollutants.
4. Recommendations According to the estimated results of emissions, the problem of traffic pollution is very serious. In Palestine, there are no specific emission standards for air pollutants. Emission standards are the main instruments in any air pollution control program. So, the Palestinian National Authority should install air pollution (especially traffic pollution) monitoring program. Also, there should be a continuous inspection and monitoring of traffic pollution especially at vehicle licensing centers. There must be control of the excesses emitted emissions from the Ministry of Transport or the power quality of the environment or the traffic police. Monitoring stations should be available to estimate the amounts of contaminants in the mid-cities and traffic jams.
Acknowledgments This work was performed in cooperation with the Renewable Energy and Environment Research Unit (REERU) of the Palestine Polytechnic University.
Estimation of Traffic Induced Pollution in Palestine
References [1] [2] [3]
[4]
[5]
Energy Presence in Palestinian Arias (in Arabic), Palestinian Center Bureau of Statistics (PCBS), 2008. UNDP, Challenges to human security in the Arab countries, Arab Human Development Report, 2009. World Bank, Movement and access restriction in the West Bank: uncertainty and inefficiency in the Palestinian economy, World Bank Technical Team Report, World Bank Publication, May, 2007. V. Qumsieh, J. Isaac, N. Qattoush, Energy and its Impact on the Environment, The Applied Research Institute Jerusalem (ARIJ), 1996. R. Al-Malki, etal, Transportation and Air Quality, The Applied Research Institute Jerusalem (ARIJ), 1996.
[6]
31
Vehicles' Statistics in West Bank, Department of Vehicles Engineering, Ministry of Transport, Ramallah, 2009. [7] D. Ajtay, M. Weilenmann, P. Soltic, Towards accurate instantaneous emission models, in: Atmospheric Environment, 12th International Symposium, Transport and Air Pollution, 2005, pp. 2443-2449. [8] P. de Haan, M. Keller, Emission factors for passenger cars: application of instantaneous emission modeling, Atmospheric Environment 34 (2004) 4629-4638. [9] Emission Estimation Technique Manual for Combustion Engines, Version 2.3, Department of the Environment and Heritage, Australia, 1999. [10] Methods of estimation of atmospheric emissions from transport: european scientist network and scientific state-of-the-art action, LTE 9901 Report, Mar., 1999.
May 2010, Volume 4, No.5 (Serial No.30) Journal of Energy and Power Engineering, ISSN 1934-8975, USA
Paper Machine Influence on Industrial Energy System A. Hazi and G. Hazi Department of Power Engineering, “Vasile Alecsandri” University of Bacau, 157, Marasesti Street, Bacau 600115, Romania
Received: January 6, 2010 / Accepted: February 9, 2010 / Published: May 31, 2010. Abstract: In this paper, the influence of low power factor on electricity system and the influence of paper breaking on heat system are presented. For that, a mathematical model and a case study for a paper mill are realised. The electric mathematical model is based on the relations of energy losses in cables and in transformers as a function of power factor. The thermal mathematical model includes characteristic energy and efficiency of boiler depending on its load. Characteristic of efficiency is modeled by a quadratic dependence between fuel consumption and steam flow. In the case, study were estimated to reduce energy losses for factor neutral (0.92) against real power factor (0.75) for the electrical scheme of a paper machine. Analytical expression of the boiler characteristic and variation of boiler efficiency depending on its load were estimated, too. Key words: Power factor, energy losses, efficiency of boiler, energy system, paper machine.
1. Introduction The papermaking process is the most energy intensive and consumes, about 45% of total energy use. Energy use reduction can provide cost savings, often with low capital investment. The main energy forms that are needed in the production process are electricity, steam, water and natural gas [1]. Flow of reactive power adversely affects operation of distribution network from two important reasons: (1) Increasing active power losses due to increasing absolute values of currents. (2) Significant increase of voltage fall in the network Paper machine has a large number of asynchronous engines that operate with low power factor, especially when they work with low load. The power factor is low and electricity losses on the cables and on the transformers are high. Increasing the power factor can be done by installing capacitor batteries, which generate reactive power required by the consumer or by judicious choice of asynchronous engines rated in the Corresponding author: A. Hazi, Ph.D., professor, research fileds: thermal installations, energy generation, electrical substation and energy efficiency. E-mail:
[email protected].
sense approach and rated engine. If power factor is maintained at neutral value, energy saving can be realized. Some installations that consume heat have a constant regime and another have a variable regime imposed by technological process. Regime of technological installations determines regime of thermal power plant. Drying is the highest energy consumer, requiring large amounts of heat (steam) to evaporate water from paper or paperboard. In the machine, operating appears paper breaking when steam consumption of the dryer cylinders is cutting down automatically. Load of the steam boilers must be reduced correspondingly. But, these breaks are often repeated and determine a variable regime of the steam boilers, and its efficiency decrease. Thus, more fuel is consumed for steam generation.
2. Energy Supply System of Paper Machine Electrical energy is used to drive the paper machine, pumps, ventilating fans, etc. on medium voltage or on low voltage. The steam is used on different locations in the paper making process. The steam flow in the paper mill is
Paper Machine Influence on Industrial Energy System
coming from the combine heat power (CHP) plant on low pressure. The CHP plant delivers electrical energy, too. When the CHP plant produces too little electrical energy, the difference will be brought from the public grid on high voltage. Transformers on 110/6 kV and on 6/0.4 kV are used usually. The diagram of the energy flow is presented in Fig. 1.
3. The Mathematical Model To study paper machine influence on power system, a mathematical model is developed. Induction motors are used to drive pumps and fans of water and air circuits of the paper machine. This leads to a low power factor. To highlight the influence of machine operation with a low power factor on power system, we calculate energy losses in cables and transformers depending on power factor. Maximum apparent power, S(cosϕ) in kVA, is a function of power factor [2]: (1) S (cos ϕ ) = P ⋅ cos ϕ [kVA] Where, P is the maximum active power during T, in kW; T during analysis, in h/year; cosϕ is a power factor. Maximum current, I(cosϕ), is: S (cos ϕ ) [A] I (cos ϕ ) = 3 ⋅U Where U is the voltage, in V.
(2)
Lifetime maximum power, TSM(cosϕ), is a function of power factor [3]: Wa + Wr (cos ϕ ) 2
33
are determined by the relationship: ΔWT (cos ϕ ) = ΔW Fe + ΔW Cu (cos ϕ ) [kWh/year] (6) Where ΔWFe are losses of iron, in [kWh/year], which is determined by the relationship: (7) ΔW Fe = ΔP0 ⋅ T [kW] Where ΔP0 are iron losses in the transformer, in kW, and ΔWCu(cosϕ) are copper losses in the transformer which are determined by a relationship of Eq. (5). Total energy losses in power supply system are: ΔW (cos ϕ ) = ΔWc (cos ϕ ) + ΔWT (cos ϕ ) [kWh/year] (8) Relative loss of energy, wr, is defined as: ΔW (9) wr = ⋅ 100 % W Energy savings, WS, which is obtained by compensating power factor neutral value, is calculated with relation: WS = ΔWcos ϕ − ΔW0.92 [kWh/year] (10) Where ΔWcosϕ is energy losses in case of power factor cosϕ and ΔW0.92 represents energy losses in case of neutral power factor, cosϕ=0.92. A paper tear on the paper machine means a sudden reduction in steam flow on boiler. To highlight the boiler efficiency variation with load, the boiler is modeled by the characteristic energy, B(D), which is considered as a form of analytic functions of degree two [5]: 3 (11) B ( D) = C 0 + C1 D + C 2 D 2 [Nm /h] Where: B is the fuel consumption, in Nm3/h; D is boiler load, in t/h; C0, C1, C2 are unknown coefficients.
2
TSM (cos ϕ ) = 1.03 ⋅
S (cos ϕ )
[h/year] (3)
Where Wa is active energy consumption during T, in [kWh/year], and Wr (cosϕ) is reactive power, in [kVar/year] Duration of maximum loss, τ(cosϕ), is: τ (cos ϕ ) = TSM (cos ϕ ) ⋅
10000 + TSM (cos ϕ ) 27520 − TSM (cos ϕ ) [h/year]
(4)
Active power losses in cables, ΔW(cosϕ), are [4]: ΔWc (cos ϕ ) = 3 ⋅ R ⋅ I (cos ϕ ) 2 ⋅
τ (cos ϕ ) 1000
[kWh/year] (5)
Where R is the resistance of cable, in Ω. Active power losses in transformers, ΔWT(cosϕ),
Fig. 1 The diagram of the energy flow: CHP-combine heat power plant; PB – power boiler; ST – steam turbine; G – generator; PS – power system; TR – transformer; PM – paper machine; HP – height pressure; LP – low pressure; HV – height voltage; MV – medium voltage; LV – low voltage.
34
Paper Machine Influence on Industrial Energy System
Values for steam flow and fuel consumption are determined experimentally for the operation of the steam boiler at nominal parameters, in three regimes. It introduced the numerical values of the independent variable and dependent variable in the equation corresponding to model and a determined system of equations of the form is obtained: (12) B j = f (C , D j ) , j=1...3
Table 1 The maxim power and energy consumption.
Where C is the coefficients vector, D j is independent variable vector, the flow of steam and B j
Table 2 Resistance power cable network.
Installation
Power Energy, (Kw) (kWh/year)
PM1
9,330
PM2
400
CHP
500
WF
400
LES SRA – PM1 LES SRA – 1,957,800 PM2 LES SRA– 3,280,000 CHP LES 2,460,000 SRA–WF
54,492,100
is a vector output measurement, fuel flow, j is the number of operating regime. Efficiency of boiler depending on its load, η (D) , is
Cablul Rezistenta (Ω) LES SRA – PM2 LES SRA – CHP LES SRA – WF
calculated with relation: D ⋅ (i ab − i ap ) η ( D) = ⋅ 100 % Pi ⋅ B( D)
Table 3 Transformer parameters.
(13)
Where iab, iap are enthalpy of steam and of water supply, respectively, and Pi is the lower calorific value of fuel.
4. The Case Study The paper machines influence on energy supply system was studied in a paper mill. The maxim power and energy consumption for a newsprint paper machine (PM1), for a toilet paper (PM2) and for auxiliary installations which are necessary for water supply and steam technology that is water filters and CHP, are presented in Table 1. The resistance power cable network is shown in Table 2 and the transformer parameters are shown in Table 3. In Fig. 2 and in Table 4, it is seen that the largest energy losses occur in the transformer 110/6 kV, 47.05%, followed by 6/0.4 kV transformer, 26.09% and cable LES RAS - PM1, 26.38%. Energy losses can be reduced if capacitors batteries are installed for power factor compensation for the 0.4 kV to neutral value, seen in Table 5. From Table 5, it is apparent that the greatest weight of reduce energy losses, 53.08%, is in cable LES SRA – PM1 supply newsprint machine, although the greatest weight of loss is in 110/6 kV transformer. This is due
Parameter Copper power losses in Cu Iron power losses Primary nominal voltage Secondary nominal voltage Nominal power Resistance
Rezistenta (Ω)
Cablul
0.06 0.01 0.02 0.03
Rezistenta (Ω) 0.06 0.01 0.02 0.03
Simbol
U.M.
TR1
TR2
ΔPCu
kW
180
12
ΔPFe
kW
52
1.85
U1n
kV
110
6
U2n
kV
6
0.4
Sn RT
MVA Ω
40 0.004
1 0.002
Table 4 Energy losses to cos f=0.75. Network elements LES SRA – PM1 LES SRA – PM2 LES SRA - CHP LES SRA - WF TR1 TR2 Total
Symbol loss ΔW1 ΔW2 ΔW3 ΔW4 ΔW5 ΔW6 ΔW
Energy loss (kWh/year) 318,108 2,938 1,447 1,502 567,276 314,622 1,205,893
Weight loss energy (%) 26.38 0.24 0.12 0.12 47.05 26.09
Table 5 Reduce energy losses.
LES SRA – PM1
Symbol energy savings SW1
LES SRA – PM2
SW2
1,398
0.57
LES SRA – CHP
SW3
617
0.25
Network elements
Reduce energy Weight of losses reduce energy (kWh/year) losses (%) 128,693 53.08
LES SRA – WF
SW4
675
0.28
TR1
SW5
57,783
23.84
TR2
SW6
53,246
21.98
Total
SW
242,412
Paper Machine Influence on Industrial Energy System
35
with a power factor cosϕ = 0.75. To see the influence of paper breaking on efficiency of steam boilers, the energy characteristics of the CHP boiler for 3 operating regimes were determined which are presented in Table 6. Analytical expression of the boiler characteristic is given by rel.14 and its graphic representation is shown in Fig. 3.
B ( D) = 2398 + 2.179 D + 0.872 D 2 Fig. 2 Variation of energy loss depending on power factor.
Fig. 3 Boiler energetical characteristic.
(14)
Variation of boiler efficiency depending on its load is shown in Fig. 4. In summer, a single CHP boiler work with a maximum load of 40 t/h and in winter, 2 boilers works in parallel with a maximum load of 60 t/h. In case of breaking paper on paper machine, boiler load drops sharply to 25 t/h. This reduction of boiler load may take several minutes and can be repeated several times and may take several hours or days depending on the issues that determine break of paper web on the paper machine. Such variation of boiler load causes an additional thermal application of boilers and decreases their yield. For example: In summer, the efficiency decreased from 87.66% as corresponding to the load of 40 t/h, to 48.55% as corresponding to the load of 15 t/h. In winter, in case of equal loading of the two boilers, the efficiency decreased from 78.54% as corresponding to the load of 30 t/h, to 55.05% as corresponding to the load of 17.5 t/h.
5. Conclusions Fig. 4 Boiler efficiency Table 6 Boiler operating regimes. Operating regime 1 2 3
Steam flow (t/h) 26 38 45
Fuel flow (Nmc/h) 3,043 3,739 4,361
Efficiency (%) 72.63 86.40 89.79
to iron losses which remain constant in the transformer. For operation at power factor, neutral relative energy loss is reduced to 1.55% against 1.94% in operation
Low power factor due to alternating current (AC) motors influence electricity quality and lead to energy losses. Using the mathematical model presented in this paper, in the case, variation of energy losses depending on power factor was studied. For an average power factor of 0.75 achieved in the factory, energy losses in cables and transformers were calculated. Important losses are in the transformer and in the supply cables of paper machine which has the highest consumption of
36
Paper Machine Influence on Industrial Energy System
energy. Increasing power factor from 0.75 to 0.92 reduce energy losses up 242 MWh/an, that mean 20,000 $/year. The operating regime of the paper machine influences steam boilers efficiency. Breaking of paper leads sudden drop of the boiler load thus a decrease of its efficiency. Proper maintenance works and following the technological process, breaks can be eliminated. Such a paper machine operation could lead to fuel savings, during the breaks eliminated by 1,253 Nm3/h-in summer and 544 Nm3/h–in winter.
References [1] [2] [3]
[4] [5]
Pulp and Paper Industry, BAT Document, available online at: http:// www.mapm.ro M. Iordache, I. Conecini, Power Quality, Technical Publishing, Bucharest, 1997. Indicative NTE 401 / 03 / 00, Methodology for determining economic section conductors in electrical installations of 1-110 kV distribution. I. Conecini, Improve Quality of Electricity, Publisher AGIR, Bucharest, 1999. G. Carabogdan, A. Badea, C. Bratianu, V. Musatescu, Methods of Analysis of Thermal Processes and Power Systems, Technical Publishing, Bucharest, 1989.
May 2010, Volume 4, No.5 (Serial No.30) Journal of Energy and Power Engineering, ISSN 1934-8975, USA
Reliability Analysis of Fluid Leak Detection and Isolation System M.A. Djeziri and B.Ould Bouamama LAGIS, UMR CNRS 8146, Polytech-Lille, Avenue Paul Langevin, V. d'Ascq 59655, France Received: January 10, 2010 / Accepted: February 3, 2010 / Published: May 31, 2010. Abstract: Reliability analysis of a leak detection system developed by OSYRIS R&D is dealed with in this paper. The developed algorithm is based on signal processing theory; and it uses the properties of the cross-correlation function in order to distinguish the fluid leak from a various disturbances. Experimental results obtained on different processes, in presence of thermal and hydraulic disturbances, show the advantages and limits of the proposed approach. Key words: Fault detection and isolation, thermo-fluid process, signal processing.
1. Introduction The detection and isolation of fluid leakage is a major economic and security challenge in several areas (nuclear, petroleum, petrochemical, steel, distribution networks of drinking water). Several research studies published in the literature proposed different approaches based on qualitative or quantitative models. Among the studies, quantitative models for leak detection and isolation where used: a dynamic model with distributed parameters of the pipeline including several leaks was considered, and the principle of analytical redundancy for residual generation was used in Ref. [1, 2]. In Ref. [3], a robust Fault Detection and Isolation (FDI) approach based on bond graph model in Linear Fractional Transformation (LFT) form was developed, then applied on a steam generator. Leak detectable value is identified a priory using a residual sensitivity analysis. The performances of quantitative approaches depend directly on the accuracy of models, which later are difficult to be achieved because of the multiphysical Corresponding author: M.A. Djeziri, Ph.D., research field: integrated disigne for monitoring of complex systems applied for mechatronics and industrial processes. E-mail:
[email protected].
and non-stationary aspect of the process engineering systems. Qualitative methods use the principle of pattern recognition, which consists of dividing the parameter space into classes, corresponding to the known operating modes. Mathematical relationships between the effects (comments of experts, sensor measurements and statistics) and causes (faults) are determined by learning. Those approaches have been the subject of several publications in recent years [4-6]. The signal processing methods are a part of the qualitative FDI approaches. These methods use the signal theory for extracting useful information (faults) from the raw signals issued from sensors. In Ref. [7], presents a comparative analysis of several FDI techniques based on signal processing was presented. The electrical, acoustic and electromagnetic signals are widely used for leak diagnosis, but these techniques use the local characteristics of the leakage, and can not locate leaks in a great scale. In Ref. [8], a cross-correlation of an acoustic signals is used for leak detection in distribution networks of drinking water, this algorithm is implemented using a Digital Signal Processing (DSP) processor, in order to improve the calculation time of the cross-correlation. Another
38
Reliability Analysis of Fluid Leak Detection and Isolation System
techniques uses the signature of the transient operating mode of the system to detect and isolate leaks. In this work, a method of leak detection based on signal processing is analyzed. This approach developed by OSYRIS R&D [9] is based on the crosscorrelation of flow input-output signals of the pipe. Reliability tests are performed on different processes, to show the robustness of the algorithm to the thermal and hydraulic perturbations and its sensitivity to faults (leaks ).
2. Leak Detection Algorithm The leak diagnosis method developed by OSIRIS R&D is a qualitative method based on signal processing. It uses the properties of the crosscorrelation function, so it is necessary to recall the definition and properties of the crosscorrelation function. The crosscorrelation functions is used to evaluate the similarity of the pair of functions x(t) and y(t) which may be random or deterministic. When stationarity conditions are met, mutual covariance becomes the raw crosscorrelation function, noted usually Cxy (τ) [10]: C xy (τ ) = E[x(t ). y * (t + τ )] (1) Where E is the mathematical expectation, and y* is the conjugate of y. Each function must be defined by the same origin, and τ represents the delay of y(t) according to the origin [10]. For functions satisfying the ergodic principle, the mean calculation can be generalized on the variable t: 1 C xy (τ ) = lim T →∞ T
T
2
∫ x(t ) ⋅ y * (t − τ )
−T
(2)
2
In the general case of non-stationarity, the moments and covariance depend on the parameter t. This makes the study of nonstationary random functions be difficult. However, many physical phenomena or measurement data are managed by stationary random functions. We can say that a random function is strictly stationary if its statistical properties are independent of the parameter t. If we consider two samples, xt1 and xt2, of a random
function x(t), the strict stationarity implies that the probabilities or probability densities associated with x(t) are independent of the choice of t₁ or t₂, property that can be expressed as [10]: P ( x t1 ) = P ( x t 2 ) (3) Where P(xt₁) and P(xt₂) are the probability densities of x at times t₁ and t₂ respectively. 2.1 Properties of the cross correlation function: A change of variable shows that the crosscorrelation function is insensitive to the permutation functions x(t) and y(t), which means that we can write: C xy (τ ) = C yx (τ ) (4) y When the functions x(t) and y(t) do not have a stochastic dependence, the crosscorrelation function is independent of the delay τ; y Unlike the autocorrelation function, Cxy(τ) is not a pair function, the maximum is not necessarily centred on the origin; y The crosscorrelation between x(t) and y(t) reaches a maximum for a delay τ if: (5) x(t ) = y (t + τ ) y If one calculates the correlation of raw signals x and y with non-zero means, a constant is added to the results: (6) C xy (τ ) = Cx ′y ′(τ ) + x . y With x ′ = x − x and y ′ = y − y . x and y are
respectively the mean values of x and y. 2.2 Method Developed by OSYRIS R&D Measurements are issued from flow sensors placed at both ends of the pipes to monitor. These signals are then transmitted to the diagnosis system via optic fibber cables, to better retain information and to avoid electromagnetic disturbances. The diagnosis system consists of a processor, on which the crosscorrelation function of the two signals of flow measurement is programmed. An observation window of 1,024 samples per second is considered. On each window, the mean value is calculated and removed from all the samples of the window. During the operation of the system, a sliding
Reliability Analysis of Fluid Leak Detection and Isolation System
mean is calculated every 30 windows, then removed from all the samples of 31 window. The fault indicator (residual) represents the discrete crosscorrelation function of flow signals acquired in real time, this function is calculated in several forms on finite energy signals. The crosscorrelation function used by OSYRIS R&D [9] is given as follows: n −1
C HS ( j ) = ∑ H k .S j + k
(7)
k =0
Where Hk = ( E k − S k ) ; Ek are the values resulting from sampling the measurement of input signal E(t) (vector of size n); S k are the values resulting from sampling the measurement of output signal S(t) (vector of size n); n is the total number of samples Ek and Sk in a defined observation window; k is an integer varying from 0 to (n-1); j is an integer varying from -(n-1) to (n-1), which takes thus the following successive values: -(n-1), -(n-2),..., -2, -1, 0, 1, 2,...,(n-1); CES(j) is a vector of size 2n-1, and the residual represents the time evolution of the central peak of CHS(j). For example, to compute the crosscorrelation with 1000 successive samples Ek and Sk (k varying from 1 to n and n=1000), the sampling frequency is of 1 kHz. For each set of n samples, a crosscorrelation vector is calculated every second. In this example, every second, 1999 values are calculated from CHS[-(n-1)] to CHS(n-1) as follows: ⎧CHS [− (n − 1)] = H 0 .S n −1 ⎪C [− (n − 2)] = H .S + H .S 0 n−2 1 n −1 ⎪⎪ HS ⎨.... ⎪C (n − 2) = H .S + H .S n−2 0 n −1 1 ⎪ HS ⎪⎩CHS (n − 1) = H n −1.S0
(8)
The operating thresholds are determined experimentally after a battery of tests on a test-bench. Signatures (maximum amplitude of the crosscorrelation function) of each mode (Normal, faulty and in the presence of various disturbances) are recorded and saved. If the signature of the leak is different from that of normal operation, the fault (water leak) is detectable. If the signature of the fault is different from those
39
caused by any disturbance, the fault is isolable. The fault detection threshold is determined using the system for a leak of 0.05 m³/h on a nominal input flow of 0.82 m³/h, and corresponds to a residual amplitude of (-0.2). So, the leak is detected and an alarm is generated when Rsidual