A Paper for Presentation at ACSP-AESOP 2003, Leuven, Belgium DO NOT CITE WITHOUT AUTHORS’ PERMISSION
Emerging European-Style Planning in the United States: Transit-Oriented Development
John L. Renne and Jan S. Wells, Ph.D. Rutgers, The State University of New Jersey
Abstract The New Jersey Transit Villages Initiative demonstrates a new role for state planning in the United States, one that is more European-like in nature. In an attempt to promote mixed-use, pedestrian-oriented, dense developments around transit stations in New Jersey — transit-oriented developments — the planning process has proven to be innovative and not typically American. This paper presents an overview of the Initiative and a summary of its evaluation conducted by the authors as part of a project at the Voorhees Transportation Policy Institute at Rutgers University. We conclude that the Transit Villages program in New Jersey is a good model of smart growth, which stems from active planning and intergovernmental cooperation on land use and transportation issues.
Acknowledgements. This investigation has been funded by the New Jersey Department of Transportation. We would like to thank Monica Etz, Transit Village Coordinator at NJDOT, for her assistance in working with the municipalities and state agencies; and, Martin Robins, Executive Director, of the Voorhees Transportation Policy Institute, Edward J. Bloustein School of Planning and Public Policy, Rutgers University, for his support and guidance.
1
My answer to sprawl is active planning of the type practiced everywhere except the United States (and beginning to appear here out of necessity). — (Ewing 1997, 118) Introduction The concept of satellite villages, centered upon a rail station, is not a new idea but promoted in England by Ebenezer Howard in the late 1800s. This became known as the Garden City Movement. New Towns, a successor to Garden Cities, were prevalent in the middle of the twentieth century, mostly in Europe. This movement also promoted highdensity development at rail stations with special attention for high quality pedestrian environments. From about the 1860s in Europe and the New World, the old Walking Cities began to collapse under the pressure of population and industry. A new city form developed that enabled the city to accommodate many more people at somewhat reduced densities…This was achieved through new transit technology…[in which] [t]he trains generally created subcenters at railway stations that were small “cities” with walking-scale characteristics (Newman and Kenworthy 1999, 2829).
From the perspective of many Americans, European cities can be characterized by their high quality public spaces and excellent transit network and services. This becomes evident when comparing travel habits between the two continents. According to Newman and Kenworthy (1999), who look at large cities, an average of 38.8 percent of work trips are made on transit in Europe compared to only 9.0 percent in the United States. Furthermore, 18.4 percent of workers walk or bicycle in Europe compared to only 4.6 percent in the United States. 1 Pucher and Lefevre (1996) state, “walking and bicycling account for roughly three to five times as high a proportion of urban travel in
1
These averages are based on selected cities on each continent for 1990.
2
Europe as in either the USA or Canada. Public transport serves four to six times as high a percentage of urban trips in Canada and Europe as in the USA” (7). Indeed, [t]he most salient trend in American travel behavior over the past four decades has been increased reliance on the private car for urban travel, with corresponding declines in public transit and walking…The private car continues to dominate urban travel among every segment of the American population, including the poor, minorities, and the elderly (Pucher and Renne 2003, 49).
The strength of this love affair with the car notwithstanding, Americans woke up to a disturbing reality in the 1980s: they were spending more and more time sitting in traffic and driving longer and longer distances from their home to the job. Downs aptly describes the growing congestion problem in Stuck in Traffic (1992). He recounts a variety of factors that converged in the late 1980s to create a quandary in commuting for major American metropolitan areas that has only worsened with time. Specifically, population and job growth have outpaced road construction, low-density suburbs are not served by public transit, and political bodies have failed to charge users for the true cost of automobile operation. As large numbers of women joined the workforce in the new service economy, more vehicles per household were needed and more cars were on the road at peak travel times. Lower land costs in the outer metropolitan fringes have attracted homebuyers and companies alike. Jobs formerly in city cores, which were accessible by transit, are now ensconced in sprawling office parks reachable, for the most part, only by car. As congestion has increased and citizens have complained, there has been a major movement in the 1990s by planners and policy makers to combat American automobile dependency by promoting transit use, walking, bicycling, and land use changes.
3
To this end, major federal legislation, the Intermodal Surface Transportation Efficiency Act (ISTEA) in 1991, and the Transportation Equity Act for the 21st Century (TEA 21) in 1996 attempted to create a more balanced transportation system. These ground-breaking federal programs coupled with planning’s new urbanism and smart growth2 initiatives have fostered a fresh look at public transportation, particularly rail, and its connection to the built environment. The result is what planners are calling transit-oriented development strategies. This transit-oriented development (TOD) movement, in effect, promotes “European-like” cities. A renewed popularity in public transit use,3 increased legal restrictions on growth in exurban green spaces, the push for reinvestment in urban areas, and reclamation of brownfields4 are intertwined trends currently taking place in many major metropolitan regions across the United States. TOD illustrates the convergence of these trends. While many definitions can be found in the literature, a TOD is most commonly defined as a mixed use, relatively high density, pedestrian-oriented district that is located within ½ mile of a rail, bus, or ferry station. Furthermore, the urban environment must encourage and/or facilitate transit use and walking through its urban form. This paper will describe how the TOD movement exemplifies emerging European-style planning in the United States. Not only does TOD promote transit use, walking, bicycling, mixed uses, and high density — all European-like qualities — but 2
Smart growth is defined as development that fosters compact, multiuse development; open-space conservation; expanded mobility; enhanced livability; efficient management and expansion of infrastructure; and infill, redevelopment, and adaptive use in built-up areas as defined by Douglas Porter in Making Smart Growth Work (2002), p. 1. 3 See John Pucher. 2002. Renaissance of Public Transport in the USA? Transportation Quarterly. 56,1: 3350. 4 Defined as abandoned, idled or underutilized industrial and commercial facilities where expansion or redevelopment is complicated by real or perceived contamination (HUD 1999).
4
the planning process is also beginning to change in some states with respect to land use and transportation. We particularly see this change demonstrated by programs instituted to promote TOD in the State of New Jersey. In the following pages we describe our research agenda, national TOD trends, and New Jersey’s attempt to plan for the better integration of land use and transportation through the Transit Villages Initiative. Although outcomes of the Transit Villages program are still to be determined (since the Initiative is only a few years old), the planning process has already proven to be innovative and not typically American.
Overview of Research Agenda
The Voorhees Transportation Policy Institute at Rutgers University has been engaged in a variety of activities in order to assess the status of the New Jersey Transit Villages Initiative (an overview of the Initiative appears below). These efforts include: •
Literature review on TOD
•
GIS mapping of each Transit Village with a pedshed5 overlay
•
Interviews with state agencies, municipal officials, and private entities —– stakeholders — to evaluate the success of the program
•
Site visits to the Transit Villages
•
Data gathering from the Census, NJ Transit, and other state agencies to understand the socioeconomic and transportation profile of each Village
•
Research on the history of the towns and review of NJDOT files on the Transit Village program
•
Residential and commercial surveys to report on travel behavior and community perception
5
The term “pedshed” is defined as a true ½ mile walking distance from the center of the transit station, as opposed to the typical ½ mile “air” distance. Based on the street network, some stations have a larger walkable catchment areas or pedsheds than others.
5
•
Develop a system to monitor outcomes (new housing, commercial space, street improvement, etc.) in the Villages This paper will focus on the socioeconomic profile of each village and the
stakeholder interviews. It will show how the planning process in New Jersey, initiated by the State government, has attempted to coordinate land use and transportation planning at both the municipal and state level. Our evaluation describes the successes and obstacles of the overall Initiative. Due to the complexities of planning for TOD, the planning process must include cooperation and collaboration between various groups, both public and private. This cooperative style of planning is not typical in America and represents an “European-like” transition in planning. Our findings indicate that in attempt to create mixed-use, pedestrian-friendly TODs, a development style that mimics most European cities, the cooperation between local and state government in New Jersey has also transitioned to resemble European planning.
Transit-Oriented Development in the United States
Transit-oriented development (TOD) was first popularized by Peter Calthorpe’s book, The Next American Metropolis (1993). Calthorpe calls for a better integration between transportation and land use. This form of development aims to create subcenters around a transit line. The sub-center is a mixed-use, dense development, centered on a transit station — a TOD or Transit Village. People can walk or bicycle around this community or travel to other places using transit.
6
A [TOD] is a mixed-use community within an average 2,000-foot walking distance of a transit stop and a core commercial area. TODs mix residential, retail, office, open space, and public uses in a walkable environment, making it convenient for residents and employees to travel by transit, bicycle, foot or car. (Calthorpe 1993, 56)
The TOD concept represents a shift in planning practice. It calls for the shaping of land uses to affect travel patterns, which had not been widely practiced before the mid-1980s (Boarnet and Compin 1996). Because of a growing interest in this topic, federal and state government, and nonprofits have funded major research projects to better understand the state of practice. The Transit Cooperative Research Program (TCRP), as part of a national study on TOD, recently released Transit-Oriented Development and Joint Development in the United States: A Literature Review (October 2002). A study in California, called the Statewide Transit-Oriented Development Study: Factors for Success in California (September 2002), also looks at TOD literature in addition to case studies from across the United States. Last, a discussion paper prepared for The Brookings Institution Center of Urban and Metropolitan Policy and the Great American Station Foundation was released in June 2002 called Transit Oriented Development: Moving from Rhetoric to Reality.6 The reports listed above describe many aspects of TOD. They grapple with defining the concept, and discuss many topics, some of which include the role of public and private entities, land use and design, financing, parking, and mixed use. The overall conclusions from the current state of the literature are (see Table 1): •
Collaboration is key
6
A compilation of all three of these reports is contained in State of the Literature: Transit-Oriented Development (Renne and Wells, December 2002) done in connection with this evaluation project and will be released in July 2003.
7
•
Public policies are lacking
•
It is necessary to develop a typology and guidelines for success
•
Housing, parking, and financing need special attention
•
Measuring and evaluating success is necessary
Table 1: Overall Conclusions from the TOD Literature Collaboration is key — In order to successfully build a TOD, it is vital that public and private sectors work together, as well as different levels of government and different agencies within the public sector. Public policies are lacking — The Brookings report begins to outline necessary goals and objectives for a coherent public vision. The State of California takes the Brookings recommendations and develops a model of state policy to promote TOD. It is necessary to develop a typology and guidelines for success — While TOD is subject to local market constraints, it is necessary to develop a system for classifying different places and then creating guidelines for success. Future TODs should learn from the successes and/or failures of current initiatives — obstacles should be identified, especially in a local context. Housing, parking, and financing need special attention — All three reports identify the importance of housing, parking, and financing in TODs. These issues need to be worked on in a general sense, again to develop guidelines for success, but also need to be addressed in a local context for each new project. Measuring and evaluating success is necessary — A process of evaluation is important to determine if goals are being realized. As stated in the TCRP report, most of the TODs in the United States are so new that adequate information has not yet been collected to evaluate their success.
In addition to research on TOD in the United States, the European Union funded a project called Public Private Partnerships around Urban Rail Transit (PPP-Transit) conducted by the European Centre for Transportation and Logistics at the Technical University of Hamburg-Harburg, Germany. This study, which looked at TODs in both Europe and the United States, focused upon the various levels of public-private
8
partnerships across the case studies and made specific recommendations to better inform the joint development process.
Overview of the New Jersey Transit Villages Initiative
The Transit Villages Initiative, coordinated by the New Jersey Department of Transportation (NJDOT), is a program that seeks to revitalize and strengthen selected communities with transit as an anchor. The program began in 1999 under Governor Whitman and has been widely supported by the McGreevey administration. Initially, five communities, including Morristown, Pleasantville, Rutherford, South Amboy, and South Orange were named as Transit Villages. These municipalities were selected because they had demonstrated a commitment to redeveloping their downtown using the principles of smart growth and TOD. Riverside, Rahway, and Metuchen were later added as Transit Villages for the same reason. Due to the growing popularity of the Transit Villages program, on January 27, 2003, Governor McGreevey, a major supporter of smart growth initiatives, called for the state to double the number of Transit Villages by the end of this year (State of New Jersey 2003). The Transit Villages policy fits into the larger smart growth agenda because it helps to promote the growth of businesses and residential population around existing (or planned, in one case) transportation infrastructure investments7 . It can be viewed as a tool within the smart growth policy framework as its aim is to promote increased transit ridership, economic revitalization, and the growth of housing stock as part of an overall plan to create vibrant, fun, and exciting areas around major transit nodes. 7
Riverside was named a Transit Village in anticipation of the opening of the South Jersey Light Rail line due to open sometime towards the end of 2003.
9
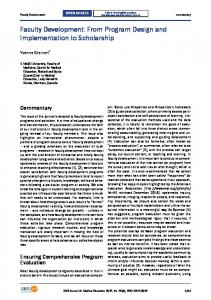
Transit Village Descriptions A demographic overview of seven Transit Villages — Morristown, Pleasantville, Rahway, Riverside, Rutherford, South Amboy, and South Orange 8 — has revealed much diversity in characteristics (see Figure 1 for a map of the locations within New Jersey). Each community brings unique assets to the challenge of fostering TOD and transit ridership. Some towns are farther along than others in terms of their redevelopment; some have more financial capacity; some have better transit service and/or parking facilities; some have better geography and history. In order to better identify the municipalities of the Transit Villages, we classified them into three categories: traditional bedroom communities; urban, industrial-based communities; and South Jersey, non-commuter-rail based communities. The first group includes Morristown, Rutherford, and South Orange. Tied to commuter rail for over a hundred years, these towns are compact and concentrated around Figure 1: Locations of the NJ Transit Villages evaluated in our study.
historic train stations. Their downtowns are readily walkable and their residential
8
Metuchen was designated a Transit Village after we began our research, thus was excluded from the demographic and stakeholder analyses.
10
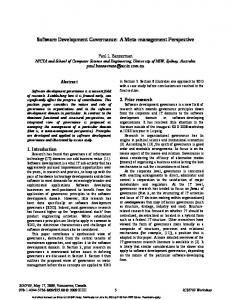
neighborhoods harbor classic housing stock on ¼ to ½ acre lots complete with sidewalks and shade trees. The towns are similar in population, 16,00018,000 persons, and these are also the wealthiest of the seven Figure 2: The train station area in South Orange has been redeveloped to include retail below the platform and traffic calming along the streets.
Villages. Despite a comfortable financial position, in recent
decades each has had to struggle with fraying downtown areas as a result of competition from expanding development at the urban edge with newer housing stock and shopping choices. Still, beyond such common traits, these three traditional suburbs have very different demographic personalities.9 Racially and ethnically, they are diverse populations. The last decade of high immigration levels has affected all three towns: Morristown is 27 percent Hispanic and almost a third of the residents are foreign born. Rutherford has a large Asian contingent, 11.3 percent, with 20 percent of the borough foreign born. South Orange is 31 percent black with almost 17 percent foreign born. Household configurations vary as well: Morristown has nearly 40 percent single person units. South Orange has the most married couple units of all the Villages, 55 percent. Financially, South Orange has the number one median family income, at $107,641. Rutherford is second with $78,120 and Morristown is $66,419. Yet, Morristown showed a high 11.5 percent poverty rate. 9
Based on the 2000 Census data. Please see Tables A-1, A-2, and A-3 at the end of the paper.
11
Housing, too, differs. Morristown has only 36.5 percent single-family dwellings while South Orange, on the other hand, is of almost 70 percent single-family stock. Rutherford falls in between with 55 percent single family. Morristown shows an above average level of crowding, nearly 8 percent, while Rutherford is 3 percent and South Orange is only 1.7 percent. Transit usage is also dissimilar. In Morristown only 6.3 percent of workers use mass transit. In Rutherford the level is 17 percent and in South Orange it reaches 21 percent. Yet, in Morristown and South Orange most workers take the train while in Rutherford the bus is the predominate choice. In South Orange nearly 11 percent of workers walk to work while 8 percent do so in Morristown and only 4 percent in Rutherford. The second group is the urban, industrial-based communities of Rahway and South Amboy. These are blue-collar towns seeking to reinvent themselves economically. Both have water assets: The Rahway River passes through the middle of Rahway and South Amboy is located on the Raritan Bay. Rahway, with a population of 26,500, is about three times the size of South Amboy. South Amboy is 90 percent white nonHispanic. Rahway, in contrast, is 27 percent black and 22 percent Hispanic. Still, they are close in financial terms: median family income for Rahway is $61,931 and for South Amboy it is $62,029. Household configuration is also similar: Married couple households are 47 percent in Rahway and 49 percent in South Amboy with single person households at 28 percent and 26 percent, respectively. South Amboy is characterized by single-family housing, 60 percent of the units, and a homeownership rate of 59 percent. Rahway is only 46.5 percent single-family
12
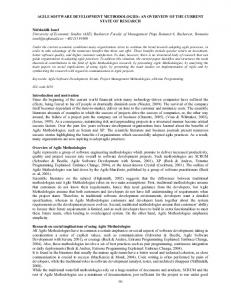
stock and homeownership is at 48 percent. Still, house value (Rahway at $142,600 and South Amboy at $ 138,500) and rent levels (Rahway at $732 and South Amboy at $767) are very similar. Vacancy rates are about the same as well. With their Figure 3: Aerial photograph of downtown South Amboy (train tracks and station are in the middle). Photo taken by Professor Richard Brail.
more modest housing stock South Amboy and Rahway are still relatively affordable.
Approximately 12 percent of households are car-free in both towns but 9.4 percent of workers use mass transit in Rahway compared to 5.9 percent in South Amboy. This is probably due to the rail service. Rahway is a stop on both the Northeast Corridor and the North Jersey Coast line. Access to employment centers in Newark and New York to the north and New Brunswick and Trenton to the south is frequent and efficient. South Amboy, however, has the distinction of hosting a ferry service to Manhattan. Interestingly, most of the rail passengers boarding at South Amboy are non-residents. Rahway and South Amboy are making major land use changes in order to compete with their suburban counterparts. Old, industrial sites have to be cleaned up for residential and retail opportunities. They do not have the financial capacity of the “Bedroom Communities” previously discussed. However, they have the larger properties that developers are looking for and they have excellent transportation access.
13
The last grouping is the South Jersey contingent: Pleasantville and Riverside. And, it is not only geography that puts them together: Neither is served by traditional commuter rail. Pleasantville is a major bus hub Figure 4: Pleasantville’s bus terminal.
to and from Atlantic City and
Riverside is awaiting the start of the South Jersey Light Rail service. In addition, both towns have waterfront areas that they want to utilize for development. There, however, the similarity ends. The municipal demographics could not be more different. Riverside has a population close to 8,000, Pleasantville just over 19,000. Riverside is 88 percent white non-Hispanic. Pleasantville is 58 percent black, 22 percent Hispanic. Foreign born make up 32 percent in Pleasantville but only 10 percent in Riverside. Married couple households are 48 percent in Riverside, 35 percent in Pleasantville. Female single parent households are 12 percent in Riverside. They are twice that in Pleasantville. Median family income in Riverside is $52,479. In Pleasantville the median family income is $40,016 with a poverty rate of almost 16 percent and an unemployment rate of 10.2 percent. Both towns contain mostly single-family housing. However, in Pleasantville almost 8 percent of the units are considered crowded compared to 2.4 percent in Riverside. The homeownership rate is only 56 percent in Pleasantville versus 68 percent
14
in Riverside. Pleasantville has a high vacancy rate and Riverside’s is low. Few workers use the bus service in Riverside whereas in Pleasantville 14 percent use transit, as 21 percent of the households have no car. Still, both towns are in need of economic improvement. Riverside suffers from a manufacturing legacy that has left it with brownfield contamination and a striking but obsolete industrial building that dominates the landscape (see Figure 5). The new light rail stop offers the possibility of
Figure 5: Riverside’s historic Watchcase factory building adjacent to the new light rail stop. Developers are currently planning the redevelopment of this old factory site.
land redevelopment based on upscale residential units or perhaps commercial activity. Pleasantville does not have an industrial albatross but it lacks a distinguishing personality. The town hopes to take advantage of its location on Lakes Bay for waterfront development. Ironically, this fishing spot is what initially brought people to Pleasantville. Perhaps it will do so again.
Demographic Characteristics of the Transit Village The area called the Transit Village in each designated municipality is defined as the half-mile radius circle around the train or bus station. In order to isolate demographics for the Transit Village area, block groups were selected that corresponded
15
to this circle as much as possible. Since Riverside and South Amboy are small geographically, the Transit Village area represents most of the town. Hence, fewer differences are seen between the Village and the municipality in these two cases. In general the characteristics of the Transit Village shift from the municipal profile with remarkable consistency10 :
10
•
School age population percentage goes up in the Transit Village (except in South Orange and Rutherford)
•
Senior population percentage drops in the Transit Village (except in South Orange and Rutherford where it increases)
•
White non-Hispanic population level goes down in the Transit Village (except in South Orange where it increases)
•
Hispanic levels increase in all Transit Villages except South Orange
•
Foreign-born population percentage increases in all the Transit Villages except South Amboy
•
Married couple households drop in share in the Transit Villages except in Riverside and South Amboy
•
Female single parent households in all the Transit Villages stay at about the same level as in the municipalities.
•
Single person households increase in share in all Villages
•
Poverty rate goes up in all Villages except South Orange where is stays the same
•
Unemployment levels go up in all Transit Villages except Morristown and Riverside
•
Single-family housing stock drops in percentage in all Transit Villages except Pleasantville
•
Homeownership rate drops in all Transit Villages except Pleasantville
Based on the 2000 Census data. Please see Tables B-1 and B-2 at the end of the paper.
16
•
For-sale vacancy rate goes up in all Villages
•
Rental vacancy rate goes up in all Villages but only in Pleasantville does it get critically high
•
Percentage-wise there are more households without cars in all Villages
•
Percentage-wise there are less households with 3 or more cars in all Villages
•
A higher percentage of workers in the Transit Village use mass transit
•
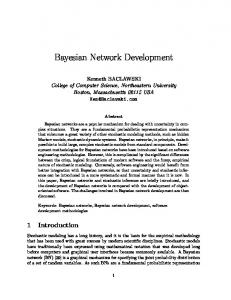
A higher percentage of workers walk to work in all Villages except South Orange Walking and Transit's Mode Share to Work
Percent of all Work Trips
35.0% 30.0% 25.0% 20.0% 15.0% 10.0% 5.0%
Walking Transit Ru Ea Ruth ther st er ford Ru for the d T rfo V rd TV
So Sou uth th A Am mb bo oy yT V
S So outh uth O Or rang an e ge TV
R Ra ahw hw ay ay TV
M M orr or isto ris w tow n nT V Ple Ple asa as ntv an ile tvil eT V
Ne w
Je rse y
0.0%
Figure 6: Walking and Transit’s Mode Share to Work. Source: US Census, 2000.
To summarize: Transit Villages in New Jersey feature a younger population, more racial and ethnic diversity, higher percentage of immigrants, lower household incomes, more singles, more rental housing, highe r vacancy rates, and exhibit better transit habits — less cars, higher use of train and bus, and more residents walking to work.
17
Parking and Service As part of this demographic review NJ Transit provided parking information and ridership data (Table A-3). South Amboy has the largest parking capacity (657 spaces) and the most reported bicycle lockers (4). As mentioned previously, most of their transit ridership is non-resident. However, of the Transit Villages, its monthly charge is the highest ($90 per month) and the utilization rate is the lowest (70 percent). South Orange, with average daily ridership of 2,169, and Morristown, with 1,825, enjoys the highest rail usage. This is a function of the type of ridership — professionals working in New York City taking advantage of the convenient mid-town direct service. Pleasantville (326 daily departures) and Rutherford (332 daily departures including shuttle services) lead in bus service. Pleasantville and Riverside currently have no commuter parking facilities.
Demographic Conclusion
Residents in the Villages demonstrate a strong tendency to use transit, walk or bike — either because they have to financially or because it is more convenient than driving. With the ongoing “transit-friendly” improvement of these station areas (safe, walkable street patterns for access, mixed-use and higher density development, reduced auto activity, traffic calming, and pedestrian scale streetscapes) New Jersey Transit Villages are becoming excellent examples of smart growth strategies.
18
Results of Stakeholder Interviews
In addition to studying the demographic profiles of the Transit Villages, as part of our assessment of the Initiative, we conducted extensive interviews with state and municipal government, and the private sector. This section will summarize our findings.
State Government. The Transit Villages Task Force consists of representatives from ten state agencies, coordinated by the New Jersey Department of Transportation. We conducted interviews with most of the representatives11 : NJ Department of Transportation, NJ Department of Environmental Protection, NJ Redevelopment Authority, NJ Transit, Office of Smart Growth, NJ Department of Community Affairs, Main Street New Jersey, NJ Economic Development Authority, NJ Housing and Mortgage Finance Agency, and the NJ Commerce & Economic Growth Commission. Based on these discussions we believe the following points are the most important components in the viability of the Transit Village Initiative:
11
•
A Task Force that meets regularly with designated agency representatives to monitor progress in the designated municipalities, to discuss problems, and propose solutions. Many representatives cited this “teamwork” aspect as refreshing. It allows the agencies, both large and small, to sit at the same table and act cooperatively to help municipalities leverage resources. The state-municipal relationship is viewed as a partnership.
•
Engaged Task Force members that help cut through “red tape” at their various agencies and assist in targeting funding to the designated Transit Villages. The Task Force members give the municipalities a specific contact within an agency to call when a problem arises.
The NJ Council on the Arts, a Task Force member, was in transition at the time and was not available.
19
•
An active and effective Transit Village program administrator. The Task Force can only be successful if there is guidance, coordination and follow through on Transit Village issues.
•
State leadership publicly supporting transit oriented development and the Transit Village Program. The Transit Village Program owes much of its strength to the statehouse: Created under the auspices Governor Whitman and continued with enthusiasm under Governor McGreevey.
•
NJ Transit actively supporting transit oriented development. NJ Transit’s excellent station improvement program, its efforts at better utilization of parking facilities through partnerships with towns and the private sector, and its investment in a variety of support programs such as jitneys were applauded by everyone.
Municipal Government. Based on our interviews and observations certain positive municipal characteristics emerged that mark Transit Villages: •
Strong leadership. All designated towns in the Transit Village Initiative have mayors, administrators and city councils that have demonstrated a concerted willingness to take action for change.
•
History of planning. New Jersey Transit Villages had been preparing for change and redevelopment well in advance of being designated (some for as long as eight to ten years).
•
Sustained vision of redevelopment. Not only have these towns planned for renewal they have shown perseverance in the face of delays and financial hurdles in pressing for implementation of their strategies.
•
Entrepreneurial attitude. Specifically, willing to: – – – – –
•
“think outside the box” and entertain new ideas work with developers to achieve the desired product implement creative zoning with increased density, multifamily housing, mixed-use, and flexible parking requirements aggressively seek grant funding and/or low-interest loans participate in public/private partnerships
Willing to foster pedestrian and bike access to the downtown and station areas. All of the communities have acknowledged the importance of “walkability” and reduced auto use by implementing such strategies as
20
streetscape improvements, traffic calming configurations, and jitney service. •
Support of the commercial area through downtown partnerships, Main Street programs, or enterprise zones. Transit Villages show a great deal of concern for the climate of local businesses, particularly retail and restaurants that draw people.
•
Sensitive to “quality of life” issues by including parks, recreation areas, and cultural assets in redevelopment goals. Enhanced pocket parks, bike paths, new public recreation facilities, a wetlands educational preserve, and performing arts theaters are among the many lifestyle amenities that are featured on the agendas of New Jersey’s Transit Villages.
Private Sector. The success of the Transit Village Initiative has not been onesided. Private developers have played a key role in implementing redevelopment plans. We interviewed several who have completed large projects in Transit Villages and their common characteristics are worth noting: •
They are major regional or national companies that have the capacity and experience to deal with difficult site issues.
•
They are willing to work with towns to achieve a shared vision.
•
They place a high market value on good transportation connections.
•
They are creative with respect to design of product and utilization of land.
Obstacles Despite these noted success factors there are many roadblocks that face Transit Villages. Some are site specific; others are systemic to the development process. We have identified some major deterrents that need to be considered: •
Contaminated land or brownfields. Most of the Transit Villages have some level of land contamination that is discouraging redevelopment. Even if it is just an abandoned gas station, environmental assessment and then
21
implementation of appropriate remediation is necessary. For old manufacturing locations like Rahway, South Amboy, and Riverside the situation is particularly critical. Often the best use for these properties is housing or recreation, i.e., high human use. This increases the level of clean-up and as a result, the cost. Even with the state’s progressive brownfield statute12 that provides for the remittance of a certain portion of remediation costs and limited liability for “innocent purchasers”, many developers refuse to consider such risk. And, towns, if they own the property, are not in a fiscal position to carry out the clean-up themselves. It is even worse if the egregious property is privately held and “mothballed”. These owners, fearing liability for clean up if they sell, keep taxes paid but do little else with the site. Often these are the prime parcels for redevelopment because of their size or location.
12
•
Acquisition of properties for redevelopment. In order to attract developers, towns need large enough parcels that can hold what builders call a “critical mass”. Effectively, this is a high enough number of units to justify the effort and make the project marketable and profitable. Either the town or the developer has to acquire these properties. This can be a time consuming, expensive process that entails valuation arguments and recalcitrant property owners.
•
Bureaucracy of state agencies. Despite the efforts of the Task Force, municipal representatives complained of frustrating encounters with state agencies. Often this is related to staff changes that leave an approval request in limbo. At other times it reflects the agency’s rigidity with regard to regulations, irrespective of the particular situation. For municipalities that are attempting to be innovative this attitude is extremely exasperating.
•
Cost. Redesigning the built environment is expensive. Even with grants and low cost loans, Transit Villages have major financial challenges in implementing redevelopment plans.
•
Conflict in funding sources. To compound financing problems, towns have found that often federal and state resources cannot be used on the same project due to restrictions placed on the monies that are not compatible.
•
Fear of school children. In New Jersey, the cost of educating children is a major factor in land use decisions. In order to avoid the possibility of a major influx of school-aged children the tactic towns use is to limit the number of bedrooms in new developments to one or two. This leaves little housing choice for families or those childless couples wanting extra space.
The Brownfield and Contaminated Site Remediation Act (P.L. 1997, C.278).
22
It also limits possibilities for those single or childless couples that move into Transit Villages’ new developments to stay in town once they have children. Only South Amboy has embraced family housing with any enthusiasm.
A New Role for the State Government In most European countries, the coordination of land use and transportation planning, to some extent, takes place at the state and/or regional level with more cooperation from municipalities compared to American cities (Cervero 1998; Newman and Kenworthy 1999). American cities are thus much more decentralized than European cities, and they continue to decentralize further at a rapid pace…[t]he failure to plan for mixeduse development or any sort of coordination has led to massive cross-commuting within and among the suburbs (Pucher and Lefevre 1996, 177).
Although there is variety in the planning systems amongst European countries, the conventional understanding is that “European central governments…oversee…local decisions through nationwide land-use statutes” (Nivola 1999, website). (Nivola argues that this is not necessarily true when compared to the US as a reason for sprawl because there is much variety between European countries). Even still, most agree that planning is taken more seriously in Europe compared to America. Planning in the United States is incremental and often reactionary, based on the requests of developers (Ewing 1997). In New Jersey, the Transit Village Initiative is innovative because it represents an impressive attempt to coordinate state and local planning, especially with respect to land use planning and transportation investments. The stakeholder interviews were most telling on this point. Representatives from state agencies remarked with almost disbelief about the team aspect of this program: “We actually sit down every quarter and look at
23
each other and talk about how together we can assist the various municipalities.” The essence of this remark was repeated in many conversations with Task Force members. As a result, although the program is coordinated by NJDOT, it functions as a “State” effort. At the local level, this rarely seen team approach by the state is building bridges and trust. It is no secret that in New Jersey, a home rule state,13 municipalities often see the State as an adversary. With this new approach, Transit Villages have a designated representative at each of the various state agencies who is committed to helping the town solve problems. Consequently, a partnership attitude between local and state government is emerging. While this may not be new for Europe, for the United States, it’s something to get excited about.
13
“Home rule” is an expression used for the self-determination attitude of local governments in New Jersey. This independent spirit is due in large part to the fact that the entire state is divided up into municipal units (566). There is no such thing as county-owned land and counties have relatively little say in local planning.
24
Table A-1 New Jersey Transit Villages Comparative Demographics - Municipalities Morristown
Pleasantville
Rahway
Riverside
Rutherford
South Amboy
South Orange
Population Population Total area (in sq. miles)
18,544 3.0
19,012 7.3
26,500 4.0
7,911 1.6
18,110 2.9
7,913 2.7
16,964 2.9
Population density1
6,304
3,291
6,642
5,197
6,452
5,102
5,945
Percent school age Percent 62 years and older
18.4% 14.3%
28.3% 13.1%
25.2% 16.6%
25.4% 15.5%
25.4% 17.0%
24.4% 15.4%
37.6% 13.9%
Percent White,non-Hispanic Percent Black Percent Asian Percent Hispanic Percent foreign born
50.7% 17.0% 3.8% 27.1% 32.4%
17.9% 57.7% 2.0% 21.9% 12.9%
53.2% 27.1% 3.6% 13.9% 17.2%
88.1% 4.4% 0.4% 4.1% 10.2%
75.6% 2.7% 11.3% 8.6% 20.1%
90.0% 0.9% 1.4% 6.7% 9.0%
58.2% 31.3% 3.9% 4.9% 16.9%
34.4%
35.0%
46.7%
48.4%
53.5%
48.8%
55.2%
12.0% 38.7%
24.7% 24.5%
15.6% 28.0%
12.0% 27.3%
9.2% 28.3%
14.5% 25.9%
10.0% 25.2%
$66,419 11.5% 3.4%
$40,016 15.8% 10.2%
$61,931 7.1% 6.6%
$52,479 8.2% 3.9%
$78,120 3.7% 4.6%
$62,029 7.4% 4.2%
$107,641 5.3% 4.2%
Households Percent married couple HH Percent female single parent HH Percent single person HH Income Median family income 1999 Poverty rate Unemployment rate
1
persons per sq. land mile
Source: Census 2000
Note: Blue = lowest value Pink = highest value
25
Table A -2 New Jersey Transit Villages Comparative Demographics - Municipalities Morristown
Pleasantville
Rahway
Riverside
Rutherford
South Amboy
South Orange
4.0 36.5%
1.9 64.0%
4.1 60.9%
3.2 70.9%
4.0 55.4%
3.1 64.2%
3.1 69.5%
33.2% 7.9% 39.5% $224,400 1.2%
18.4% 10.6% 56.3% $85,900 3.1%
26.1% 5.4% 62.7% $142,600 1.2%
46.2% 2.4% 67.7% $100,400 1.9%
46.6% 3.0% 65.5% $218,300 0.6%
47.2% 1.1% 64.2% $138,500 1.5%
54.9% 1.7% 72.1% $274,600 1.2%
$914 3.7%
$715 7.6%
$732 3.3%
$670 3.7%
$832 2.2%
$767 4.2%
$879 2.7%
24.7%
28.5%
24.5%
26.5%
22.2%
27.8%
28.1%
15.5%
20.9%
11.7%
10.4%
10.0%
11.9%
11.5%
10.2%
7.1%
12.5%
12.2%
14.4%
15.8%
15.3%
6.3% 1.5% 4.4%
14.2% 13.4% 0.0%
9.4% 1.7% 6.9%
1.5% 1.5% 0.0%
16.9% 11.9% 4.1%
5.9% 1.6% 3.6%
21.2% 2.9% 16.8%
7.7%
2.4%
3.5%
3.4%
4.2%
4.2%
10.6%
24.3
22.4
27.8
24.3
30.2
29.2
30.3
Housing Housing density1 Percent single-family Percent of units built before 1940 Percent crowded units Homeownership Rate Median house value For sale unit vacancy rate Median gross rent Rental vacancy rate Median gross rent as a percent of income Transportation Percent of HHs with no vehicles Percent of HHs with 3 or more vehicles Percent of workers using public transportation Bus or trolley bus Railroad Percent of workers walking to work Mean travel time to work (minutes)
1
units per acre of land area Source: Census 2000
Note: Blue = lowest value Pink = highest value 26
Table A -3 New Jersey Transit Villages Comparative Demographics - Municipalities Morristown
Pleasantville
Rahway
Riverside
Rutherford
South Amboy
South Orange
49
no rail service
54
no rail service
18
32
63
669
1,190
2,169
1
Transit Service Train departures (weekday towards New York) 2002 average rail weekday ridership
1,825
not available
Total intercity bus routes2 Number of daily bus departures (per weekday)
10
7
1
1
5
2
2
70
326
37
61
332
62
69
Number of shuttle services Ferry departures
0 no ferry service
0 no ferry service
0 no ferry service
0 no ferry service
3 no ferry service
0 9
2 no ferry service
447 99 348 86.0%
0
587 587 0 73.0%
0
133 133 0 82.0%
657 88 569 70.0%
613 249 364 91.0%
$90 4
R=$25, NR=$55 3
$5,876,048 $7,113
$5,362,479 $9,194
Parking 1 Total parking spaces Owned by municipality Owned by NJ Transit Utilization Monthly fees (R=resident,NR=nonresident) Bicycle spaces Schools3 State Aid 2002-2003 Expenditure per student
1 2 3
$40 3
$7,070,986 $12,361
0
R=$30 - $50, NR=+10/mo. 3
0
$25 3
$43,276,630 $8,951
$14,835,527 $8,891
$7,809,379 $8,457
$2,615,338 $10,356
Source: NJ Transit Other bus routes may exist but are not the vicinity of theTransit village. New Jersey Department of Education
Note: Blue = lowest value Pink = highest value 27
Table B-1 New Jersey Transit Villages Comparative Demographics - Transit Villages1 Morristown TV
Pleasantville TV
Rahway TV
Riverside TV
Rutherford TV
8,022 43.3%
7,134 37.5%
8,862 33.4%
6,470 81.8%
5,535 30.6%
5,785 73.1%
8,861 52.2%
Population density
7,992
2,442
8,650
5,136
3,917
4,753
5,899
Percent school age Percent 62 years and older
21.8% 13.5%
29.4% 11.4%
27.5% 16.3%
26.6% 13.9%
23.6% 18.7%
26.5% 13.1%
29.8% 15.2%
Percent White,n-Hispanic Percent Black Percent Asian Percent Hispanic Percent foreign born
40.6% 17.7% 1.6% 38.0% 42.1%
15.9% 57.1% 2.3% 23.3% 15.8%
38.7% 38.7% 4.2% 16.8% 19.6%
87.0% 4.4% 0.6% 4.5% 10.9%
64.6% 5.0% 17.4% 9.8% 27.7%
88.8% 0.9% 0.7% 8.4% 8.7%
62.6% 24.9% 4.6% 4.3% 20.0%
30.8%
34.8%
39.4%
49.9%
47.2%
51.0%
46.9%
12.3% 40.3%
27.0% 25.5%
16.3% 32.9%
10.5% 28.8%
8.2% 34.0%
14.9% 26.2%
10.6% 32.3%
range: $44,632 $30,909 19.4% 10.3%
range: $70,114 $43,250 9.2% 7.5%
range: $60,000 $38,519 8.4% 3.7%
range: $77,393 $57,321 4.4% 7.4%
range: $76,947 $48,000 7.3% 4.6%
range: $200,000+ $69,821 7.3% 4.3%
Population Population Percentage of population 2
Households Percent married couple HH Percent single female HHer family Percent single-person HH
South Amboy TV South Orange TV
Income range: $104,890 Median family income 19993 $31,458 Poverty rate 17.2% Unemployment rate 2.9% 1
As defined by census block groups around the train/bus station and does not include East Rutherford
2
Persons per sq. land mile
3
Only available for individual block groups
Source: Census 2000
Note: Blue = lowest value Pink = highest value
28
Table B-2 New Jersey Transit Villages Comparative Demographics - Transit Villages1
Housing Housing density2 Percent single-family Percent of units built before 1940 Percent crowded units Homeownership Rate 3
Median house value For sale unit vacancy rate
Median gross rent3 Rental vacancy rate Median gross rent as a 3 percent of income Transportation Percent of HHs with no vehicles Percent of HHs with 3 or more vehicles Percent of workers using public transportation Bus or trolley bus Railroad Percent of workers walking to work Mean travel time to work (minutes)
Morristown TV
Pleasantville TV
Rahway TV
Riverside TV
Rutherford TV
South Amboy TV South Orange TV
5.3 21.6%
1.4 68.5%
5.5 46.5%
3.2 70.8%
2.6 32.1%
36.4% 13.2% 24.6% range: $397,900 $182,600 5.9%
28.5% 12.0% 63.3% range: $85,800 $78,200 4.3%
range: $1,128 $775 3.4% range: 31.4% 19.5%
range: $574 $495 10.7% range: 45.0% 23.4%
range: $928 $469 3.9% range: 31.8% 19.4%
range: $807 $584 6.5% range: 42.5% 23%
range: $928 $709 1.8% range: 28.0% 16.5%
range: $888 $435 4.1% range: 36.3% 24.9%
range: $1,900 $275 3.9% range: 38% 19.4%
23.2%
27.0%
15.4%
10.2%
16.3%
12.8%
15.8%
9.8%
4.3%
8.4%
10.4%
12.6%
15.2%
13.5%
7.3% 2.6% 4.1%
19.9% 19.0% -
14.3% 2.2% 11.2%
1.8% 1.8% -
22.0% 15.3% 5.6%
7.5% 2.1% 4.4%
23.1% 4.0% 18.5%
8.9%
2.7%
5.1%
3.7%
5.2%
4.4%
7.3%
22.5
21.0
31.4
24.2
30.6
28.9
31.7
3.0 59.6%
3.7 57.9%
33.7% 49.5% 47.1% 49.0% 55.0% 6.8% 2.3% 4.4% 1.3% 2.1% 47.7% 66.0% 43.7% 59.4% 59.7% range: $147,100 - range: $109,100 - range: $259,300 - range: $148,900 - range:$467,000 $110,200 $86,100 $160,200 $113,700 $164,900 2.6% 1.0% 1.4% 2.6% 0.7%
1
As defined by census block groups around the train/bus station and does not include East Rutherford
2
units per acre of land area
3
Only available for individual block groups
Source: Census 2000
Note: Blue = lowest value Pink = highest value 29
References Belzer, D. and Autler, G. Transit oriented development: moving from rhetoric to reality. Washington, DC: The Brookings Institution Center on Urban and Metropolitan Policy, 2002. Boarnet, Marlon G. and Nicholas S. Compin. 1996. Transit-Oriented Development in San Diego County: Incrementally Implementing a Comprehensive Idea. Working Paper, Department of Urban and Regional Planning, School of Social Ecology, University of California, Irvine. California Department of Transportation. 2002. Statewide Transit-Oriented Development Study: Factors for Success in California. Business, Transportation, and Housing Agency. Consultants: Parsons Brinckerhoff. Calthorpe, Peter. 1993. The Next American Metropolis: Ecology, Community, and the American Dream. New York, New York: Princeton Architectural Press. Cervero, Robert. 1996. The Transit Metropolis: A Global Inquiry. Washington D.C.: Island Press. Downs, Anthony. 1992. Stuck in Traffic. Washington, D.C.: The Brookings Institution and the Lincoln Institute of Land Policy. Gaffron, Philline, Sylke Streich, Raouf Djekrif, Christophe Racine, and Jochen Schneider. 2002. Public Private Partnerships around Urban Rail Transit. Hamburg-Harburg, Germany: European Centre for Transportation and Logistics. Ewing, Reid. 1997. Is Los Angeles-style Sprawl Desirable? Journal of the American Planning Association. 63,1: 107 – 126. Nivola, Pietro. 1999. Are Europe’s Cities Better? The Public Interest. Accessed 16 June 2003, available from http://www.brook.edu/views/articles/nivola/1999.htm. Newman, Peter and Jeffery Kenworthy. 1999. Sustainability and Cities: Overcoming Automobile Dependence. Washington D.C.: Island Press. Porter, Douglas. 2002. Making Smart Growth Work. Washington D.C.: Urban Land Institute. Pucher, John. 2002. Renaissance of Public Transport in the USA? Transportation Quarterly. 56,1: 33-50. Pucher, John and Christian Lefèvre. 1996. The Urban Transport Crisis in Europe and North America. London: Macmillan Press Ltd.
30
Pucher, John and John Renne. 2003. Socioeconomics of Urban Travel: Evidence from the 2001 NHTS. Transportation Quarterly. 57,3: 49-77. State of New Jersey, Department of Transportation. 2003. News Release. Office of the Governor. McGreevey to Double Number of Transit Villages. Accessed 9 June 2003, available from http://www.state.nj.us/transportation/press/2003releases/012703.htm Transit Cooperative Research Program (TCRP). 2002. Transit-Oriented Development and Joint Development in the United States: A Literature Review. Research Results Digest. Sponsored by the Federal Transit Administration, Number 52. U.S. Department of Housing and Urban Development (HUD), Office of Policy Development and Research. 1999. Assessment of State Initiatives to Promote Redevelopment of Brownfields. Internet Release, http://www.huduser.org.
31
About the Authors John Luciano Renne is a Ph.D. candidate and lecturer at the Bloustein School of Planning and Public Policy at Rutgers University. He teaches a graduate course in Sustainable Urban Development and is also a project manager at the Voorhees Transportation Policy Institute, where he works with Professor Jan Wells in evaluating the New Jersey Transit Villages Initiative. Renne is a US Department of Transportation FHWA Eisenhower Transportation Fellow and Eno Transportation Foundation Fellow. He recently published “Facilitating the Financing and Development of ‘Smart Growth’ in the spring 2002 Transportation Quarterly with Peter Newman and “Socioeconomics of Urban Travel: Evidence from the 2001 NHTS” in the summer 2003 Transportation Quarterly with John Pucher. Jan S. Wells teaches courses on the demographic components of housing demand, housing development finance, and housing policy. She specializes in research on housing development on brownfields and around train stations. She is currently directing a study funded by the New Jersey Department of Transportation on housing development in municipalities selected for the state's Transit Village Program. She is also the Program Manager for the HUD Community Development Federal Work Study Program Grant that funds minority students in the M.C.R. P. degree program. Dr. Wells is a former builderdeveloper in New Jersey whose projects ranged from suburban new construction to urban renovation and adaptive re-use initiatives. Contact Information John Renne –
[email protected], 732-932-6812 ext. 877 Jan Wells –
[email protected], 732-932-3822 ext. 752
32