Transition from a Complex to a Simple Two Dimensional Liquid Madhumita Choudhuri Applied Material Science Division, Saha Institute of Nuclear Physics,1/AF, Bidhannagar, Kolkata-64 Email:
[email protected] Pressure area isotherm of a stearic acid monolayer is recorded and the corresponding image viewed using a Brewster Angle Microscope. Gold nanoparticles have been introduced into the monolayer at two different concentrations. The changes in the pressure area isotherm of the system as it progressively changes from a complex to a simpler two dimensional liquid have been studied
Abstract.
Keywords: Two dimensional liquids, Langmuir monolayer, gold nanoparticles PACS: 68.18.Jk Phase Transitions in Liquid Thin Films
INTRODUCTION Langmuir monolayer is an insoluble monomolecular layer on the water surface. It is formed by amphiphiles such as fatty acids with a hydrophobic, hydrocarbon tail and a hydrophilic polar head group in the same molecule causing them to form a monolayer when spread on water. In fact such Langmuir monolayers are an excellent example of a two dimensional system. Such fatty acid monolayers form a complex two dimensional liquid since they have a large number of degrees of freedom. The numerous ways in which the tails may be tilted, backbone planes (plane containing carbon atoms and bonds between them) may be oriented and head groups may be oriented give rise to a rich phase diagram. In addition fatty acids interact through long range dipolar forces amongst themselves. Spherically symmetric dodecane thiol capped gold nanoparticles interacting via only short range Van der Waals force, on the other hand, form a simpler two dimensional liquid. In addition the hydrophobic thiol cap around the gold core which prevents the nanoparticles from aggregating also eliminates interactions with the water subphase. Our objective here is to progressively replace fatty acid (stearic acid) in the monolayer with thiol capped gold nanoparticles. This transition from a complex to a simpler two dimensional fluid is of interest. This will be helpful in studying the effect if any of the introduction of gold nanoparticles in biological
systems where amphiphilic phospholipids occur in cell membranes.
EXPERIMENTAL PROCEDURE The nanoparticles were prepared by Brust method [1]. Thereafter they were characterized by obtaining the absorption spectrum by a UV-Vis spectrophotometer. Next the monolayer was spread in a Langmuir trough between Teflon barriers which can be moved in (or apart) for compression (or expansion) of the film. Starting with 100% stearic acid the percentage of stearic acid was progressively reduced to 90% and then 50% while the percentage of gold nanoparticles was increased to 10% and finally to 50% by weight of the solute spread in the monolayer. Analogous to a three dimensional system a two dimensional Langmuir monolayer also undergoes phase transition from gas to liquid and finally the solid state on compression. The two dimensional analog for the bulk pressure is the surface pressure while that for volume is the area per molecule. The surface pressure (П= γw- γ) is the difference between the surface tension (γw) of a bare water surface and tension (γ) of a monolayer covered water surface. An isotherm is obtained by recording the increasing surface pressure as function of the area /molecule during compression. A n attempt was also made to view the monolayer using a Brewster Angle Microscope (BAM) [2]. When a bare water surface illuminated with p polarized light incident at Brewster Angle for water is observed with
the reflected light, a dark background is obtained as no light is reflected from the water surface at this angle. In such condition a monolayer on the water surface changes the local refractive index and reflects light thereby forming an image which is visible against the dark background of the water subphase.
RESULTS AND DISCUSSION The surface plasmon resonance band in thiol capped gold nanoparticles which arises from the collective oscillation of surface electrons in response to optical excitation is seen to be superimposed on a Mie scattering background in
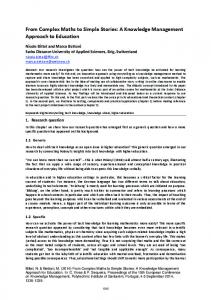
Stearic acid 10% gold 5% gold 50% gold
40 30 20 10 0
20 40 60 80 100120140160180200 area per molecule (A) in Å2
(a)
surface pressure (π) in mN/m
surface pressure (π) in mN/m
Fig 1. The size of the gold nanoparticles was calculated using Mie theory [3] as 3.2nm.
50 40
stearic acid
S
30 L2'
20 10 0
L2
20
25 30 35 area per molecule (A) in Å2
(b)
40
surface pressure (π) in mN/m
Actually a large number of phases are realized in a fatty acid monolayer depending upon the surface pressure and the temperature at which the experiment is performed [4]. Phases differ in the order (long or short range) in position of molecules, in the orientation of backbone planes and the degree of tilt of tails. At very large area per molecule the monolayer exists in gaseous state. At the room temperature at which our experiment is performed we obtain smectic liquid crystalline phases on compression beyond gas phase. The pressure area isotherm curves for 100% stearic acid (Fig 2b) indicates a first order phase transition from L2 to L2’ phases at around 15 mN/m and a second order phase transition from L2’ to S phases close to 24 mN/m. In the L2 phase the amphiphile tails are tilted towards the nearest neighbor while they are tilted towards the next nearest neighbor in the L2’ phase. In the highly compressed S phase the tails are untilted (perpendicular to subphase). 40 50old
30 20 10 0
100 120 140 160 180 200 area per molecule (A) in Å2
(c)
FIGURE 2. (a) Surface pressure-area per molecule isotherms shown for stearic acid (blue), 90% acid- 10% gold (black) and 50% acid- 50% gold (pink) monolayers. The arrows mark the transitions from L2 to L2’ phases (at lower pressure) and L2’to S phases (at higher pressure). The isotherms for (b) stearic acid and (c) 50% acid-50% gold have been shown on an expanded scale. The red tangents have been drawn to the L2 and L2’ phases to indicate that the difference between the slopes in the two phases decreases on addition of gold. TABLE 1. Average Slope of Phases and differences in slope for phase transitions in a Langmuir Monolayer for different concentration of stearic acid-gold nanoparticles Concentration of stearic L2 L2’ S L2’-L2 L2’-S acid-gold nanoparticles 100% stearic acid -3.790 -3.505 -17.685 0.285 14.18 90% stearic acid-10% gold -2.341 -2.491 -9.058 0.150 6.567 50% stearic acid-50% gold -0.396 -0.477 -1.846 0.081 1.369
The first order phase transition from L2 to L2’ phases marked by an inflexion in the stearic acid isotherm (Fig 2b) seems to disappear as the gold concentration is increased to 50% (Fig 2c). The distinct two phase L2-L2’ region in the stearic acid isotherm is apparently being progressively replaced by a single phase on addition of gold nanoparticles. Table1 also indicates that that the difference between the slopes (and thus compressibilities) of the L2 and L2’ phases decreases as the gold concentration is increased indicating that the distinction between the two phases decreases on addition of gold. In addition
there also seems to be an overall decrease in the slope change from L2’ to S phase on adding nanoparticles. This behavior can be explained on the basis of the changes brought about in the system on introducing gold nanoparticles. Gold nanoparticles are much simpler in terms of degrees of freedom as well as in
(a)
(b)
(a)
(b)
FIGURE 3. BAM images for stearic acid (a) low surface pressure (gas phase), (b) higher surface pressure (liquid phase)
FIGURE 4. BAM images for 50% stearic acid-50% gold nanoparticles (a) low surface pressure (liquid phase) (b) higher surface pressure (solid phase)
terms of interactions both amongst themselves and with the subphase compared to the dipolar stearic acid molecules. The replacement of stearic acid molecules by relatively simpler spherical gold nanoparticles interacting via only short range Van der Waals forces changes the complex fluid to a relatively simpler fluid consequently reducing the number of phases in the phase diagram. Thus on addition of gold we obtain a single phase at lower pressure. A solid like phase is retained at higher pressure though softer than the S phase of stearic acid isotherm. The replacement of stronger and longer ranged dipolar attractive forces with weaker, short range Van der Waals force has resulted in an overall increase of compressibility as well as softening of the S phase on addition of gold nanoparticles.
visible. At 50% nanoparticle concentration, gold can be seen to sparkle even in a monolayer (Fig 4a, b).
BAM images show the stearic acid monolayer on a dark water background (Fig3a, b). At large surface pressure the domain size has naturally increased (Fig 3b). Intensity variation between domains is also
REFERENCES 1. Brust et. al. J. CHEM. SOC., CHEM. COMMUN., Vol. page 801 (1994) 2. D. Honig and D. Mobius, Thin Solid Films, 210/211, page 64 (1992) 3. Halperin, RevModPhy Vol. 58, page 533 (1986) 4. Vladmir M. Kaganer, Helmuth Mohwald, Pulak Dutta Rev. Mod. Physics Vol. 71 (1999)