11 (13.3%). C. 60. 83. Total runs ... 9. AvgP by feature (all runs). Middle half of the data. Median. Feature number. A ..... n (notebook paper not available yet).
TRECVID-2005 High-Level Feature task: Overview Wessel Kraaij TNO & Paul Over NIST
High-level feature task o o o o o
Goal: Build benchmark collection for detection methods Secondary goal: feature-indexing could help search/browsing Feature set selected from feature set used for annotation of development data (LSCOM-lite) Examples of thing/activity/person/location Collaborative development data annotation effort n n n
o
Tools from CMU and IBM (new tool) 39 features and about 100 annotators multiple annotations of each feature for a given shot
Range of frequencies in the common development data annotation
TRECVID 2005
2
True examples in the common training data 13%
7000 6000 5000 4000 3000 2000
2.3%
1000
TRECVID 2005
47
46
45
44
43
42
41
40
39
38
0
3
High-level feature evaluation o o o o
Each feature assumed to be binary: absent or present for each master reference shot Task: Find shots that contain a certain feature, rank them according to confidence measure, submit the top 2000 NIST pooled submissions to depth 250 Evaluate performance quality by measuring the average precision etc. of each feature detection method
TRECVID 2005
4
10 Features 38. People walking/running: segment contains video of more than one person walking or running (tv4: 35) 39. Explosion or fire: segment contains video of an explosion or fire 40. Map: segment contains video of a map 41. US flag: segment contains video of a US flag 42. Building exterior: segment contains video of the exterior of a building (tv3: 14) 43. Waterscape/waterfront: segment contains video of a waterscape or waterfront 44. Mountain: segment contains video of a mountain or mountain range with slope(s) visible 45. Prisoner: segment contains video of a captive person, e.g., imprisoned, behind bars, in jail, in handcuffs, etc. 46. Sports: segment contains video of any sport in action (tv3: 23)
TRECVID 2005
5
Participants (22/42) (up from 12/33 in 2004) Bilkent University Carnegie Mellon University CLIPS-IMAG, LSR-IMAG, Laboratoire LIS Columbia University Fudan University FX Palo Alto Laboratory Helsinki University of Technology IBM Imperial College London Institut Eurecom Johns Hopkins University Language Computer Corporation (LCC) LIP6-Laboratoire d'Informatique de Paris 6 Lowlands Team (CWI, Twente, U. of Amsterdam) Mediamill Team (Univ. of Amsterdam) National ICT Australia National University of Singapore (NUS) SCHEMA-Univ. Bremen Team Tsinghua University University of Central Florida / University of Modena University of Electro-Communications University of Washington
TRECVID 2005
Turkey USA France USA China USA Finland USA UK France USA USA France Netherlands Netherlands Australia Singapore EU China USA,Italy Japan USA
--SB -SB SB -SB SB ------SB --SB SB ---
LL -–-LL –-––-----LL LL --LL LL ---
HL HL HL HL HL HL HL HL HL HL HL HL HL HL HL HL HL HL HL HL HL HL
SE SE -SE SE SE SE SE SE --SE -SE SE -SE SE SE SE ---
6
Who worked on which features Bilkent University Carnegie Mellon University CLIPS-IMAG, LSR-IMAG, Laboratoire LIS Columbia University Fudan University FX Palo Alto Laboratory Helsinki University of Technology IBM Imperial College London Institut Eurecom Johns Hopkins University Language Computer Corporation (LCC) LIP6-Laboratoire d'Informatique de Paris 6 Lowlands Team (CWI, Twente, U. of Amsterdam) Mediamill Team (Univ. of Amsterdam) National ICT Australia National University of Singapore (NUS) SCHEMA-Univ. Bremen Team Tsinghua University University of Central Florida / Univ. of Modena University of Electro-Communications University of Washington
TRECVID 2005
38 38 38 38 38 38 38 38 38 38 38 38
39 39 39 39 39 39 39 39 39 39 39
38 38 38 38
39 39 39 39
40 40 40 40 40 40 40 40 40 40 40 40 40 40 40 40 40 40 40
41 41 41 41 41 41 41 41 41 41 41
42 42 42 42 42 42 42 42 42 42 42
43 43 43 43 43 43 43 43 43 43 43
44 44 44 44 44 44 44 44 44 44 44
45 45 45 45 45 45 45 45 45 45 45
46 46 46 46 46 46 46 46 46 46 46
47 47 47 47 47 47 47 47 47 47 47
41 41 41 41 41 41 41
42 42 42 42
43 43 43 43 43 38 39 42 43 39 42 43 43 38 39 40 41 42 43
44 44 44 44
45 45 45 45
46 46 46 46
47 47 47 47
44 45 46 47 44 45 46 47 44 44 45 46 47
7
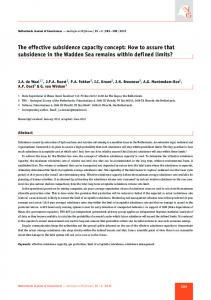
Number of runs each training type Tr-Type
2005
2004
2003
A
79 (71.8%)
45 (54.2%)
22 (36.7%)
B
24 (21.8%)
27 (32.5%)
20 (33.3%)
C
7 (6.3%)
11 (13.3%)
18 (30.0%)
Total runs
110
83
60
System training type: A - Only on common dev. collection and the common annotation B - Only on common dev. collection but not on (just) the common annotation C - not of type A or B TRECVID 2005
8
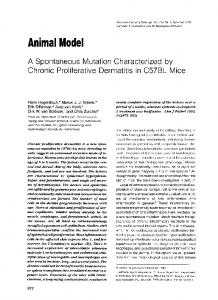
Average precision
AvgP by feature (all runs)
Middle half of the data Median
Feature number TRECVID 2005
9
2005: AvgP by feature (top 10 runs) 38. People walking/running 39. Explosion/fire 40. Map 41. US flag 42. Building exterior
43. Waterscape/waterfront 44. Mountain 45. Prisoner 46. Sports 47. Car
1 2
!
3 4 5 6 7 8 9 10 Median
Median Previous best result on CNN/ABC
TRECVID 2005
10
2004: AvgP by feature (top 10 runs) " " "
28. Boats/ships 29. M. Albright 30. B. Clinton 31. Trains 32. Beach
33. Basket scrore 34. Airplane takeoff 35. People walk/run 36. Phys. violence 37. Road
1 2 3
!
" " " "
4 5 6 7 8 9 10
"
Median
"
Median
TRECVID 2005
11
2003: AvgP by feature (top 10 runs) " " "
!
"
11. 12. 13. 14. 15. 16. 17. 18. 19.
" "
Indoors News subject face People Building Road Vegetation Animal Female speech Car/truck/bus
20. 21. 22. 23. 24. 25. 26. 27.
Aircraft News subject monologue Non-studio setting Sporting event Weather news Zoom in Physical violence Madeleine Albright
1 2 3 4 5 6 7
"
8 9
"
10 Median
"
Median ->
TRECVID 2005
12
AvgP by feature (top 3 runs by per feature) #$%&
" "
38. People walking/running 39. Explosion/fire 40. Map 41. US flag 42. Building exterior
" " " "
43. Waterscape/waterfront 44. Mountain 45. Prisoner 46. Sports 47. Car
'#
#$%&
(#
#$& )$*
#
#$& )$*
#
#$& )$*
#
#+ ,% -./#
0 #
#+ ,% -./#
01#
#+ ,% -./# ,* # #+ ,% -./# ,* # #+ ,% -./#% 0/#
" " "
#+ ,% -./#01%# #+ ,% -./#01% )# #
#
#
#
% 2
TRECVID 2005
13
Max AvgP by number of annotated training examples
44 4 21
4
2 2
22 2 2 1 1 212 1 1 11 3 3 21
3 33 1 31
1 1 21 3
TRECVID 2005
2 24 12
2 12 1
3
1
3 1 2
4 3 3 4 3 3 14 4 3 3 3 2 3 3 34 1 3 1 2
3
3 1
14
Median AvgP by number of annotated training examples
44 4 21
4
2 2
22 2 2 1 1 212 1 1 11 3 3 21
3 33 1 31
1 1 21 3
TRECVID 2005
2 24 12
2 12 1
3
1
3 1 2
4 3 3 4 3 3 14 4 3 3 3 2 3 3 34 1 3 1 2
3
3 1
15
Max AvgP by number true shots found
44 4 21
4
2 2
22 2 2 1 1 212 1 1 11 3 3 21
3 33 1 31
1 1 21 3
2 24 12
2 12 1
3
1
3 1 2
4 3 3 4 3 3 14 4 3 3 3 2 3 3 34 1 3 1 2
3
3 1
! TRECVID 2005
16
Median AvgP by number true shots found
44 4 21
4
2 2
22 2 2 1 1 212 1 1 11 3 3 21
3 33 1 31
1 1 21 3
2 24 12
2 12 1
3
1
3 1 2
4 3 3 4 3 3 14 4 3 3 3 2 3 3 34 1 3 1 2
3
3 1
! TRECVID 2005
17
TRECVID 2005
47
46
45
44
ldin g
exte rior
US fl
ag
Car
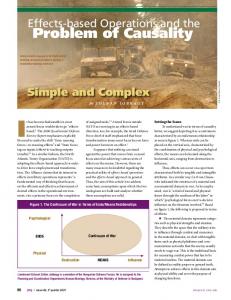
Spo r ts
Wa ters cap e/w ate rfro Mo nt unt a in Pris one r
Bui
40
43
50
42
60
41
70
40
80
39
90
Peo ple wal king /run ning Exp losi on/ fire Ma p
100
38
%
Al l te st sh ots
% of true shots by source language for each feature !
$( 3 (
30
20
10
0
Feature number 18
True shots contributed uniquely by team for each feature
4 24
2
1
1 3
1
13
Number of unique true shots
5 2
1 1
1
40 30 20 10 0
38
ar C ts nt 47 or r f ro Sp n e er at 46 iso in Pr ta e/w n ap ior 45 ou M rs c t e r 4 4 a te e x W ing 43 uild g B fl a ng 42 S ni e U un fi r 41 ap n/ g/r M osio lkin 40 xpl wa E le 39 eop P
7 8 sh 16 32 UwaUvA n 1 3 11 2 2 me 9 1 1 Ubrseinghua T 1 HUUS T 5 1 3 N A 2 8 1 6 NIClaTnds 1 6 8 1 3 LowarisLIPCC 14 L HU 5 1 UP J rial 1 12 1 4 al Impe FXP dan 2 6 2 Fu c o m e r 6 Eu CMU R S L . S.LIS Bilkent P I L C
TRECVID 2005
19
Observations o o o
Participation almost doubled over 2004 (12 -> 22) Focus on category A runs (increased comparability) Scores are generally higher than in 2004 despite o o o
new sources errorful text from speech (via MT) What does it mean?
o
Did anybody run last year’s system on this year’s task?
o o
Features were generally found in all language sources Top scores come from fewer systems/groups
TRECVID 2005
20
To follow: overview of the systems with map > 0.16 (median) o Only systems that were tested on all 10 features o Only category A o Runs were compared on map across 10 features
TRECVID 2005
21
Overview of approaches o HLF systems draw from a very wide range of signal processing and machine learning techniques n Generic vs feature specific n How to do feature selection for visual modalities such as color and texture n Visual representation: grid or salient feature clusters n Various fusion methods, normalization methods n Range of classifiers
TRECVID 2005
22
Carnegie Mellon University o
Approach n n n n n n
o
unimodal / multimodal (as in 2004) learn dependencies between semantic features (by using various graphical model representations): inconclusive global fusion < local fusion multilingual > monolingual multiple text sources > single text source Best run: local fusion
Results: 0,4
0,35 0,3 0,25 0,2 0,15 0,1 0,05 0
TRECVID 2005
23
Columbia University - presentation follows o
Approach n n
Parts based object representation (ARG) Captures: o o
n n
o
topological structure (spatial relationships among parts) Local attributes of parts
Model learns the parameter distribution properties due to differences in photometric conditions and geometry Runs vary across classifier combination schemes (fusion/selection)
Results: n n n
Significantly better than global (i.e. grid based) approach Esp. good for visual concepts where topology and local attributes are important (e.g. US flag) Text features play only a marginal role (contrastive experiment)
0,4 0,35 0,3 0,25 0,2 0,15 0,1 0,05 0
TRECVID 2005
24
Fudan University o Approach: n Several runs o Specific feature detectors o ASR based o Fusion of several unimodal SVM classifiers o Contrastive experiments with different dimension reduction techniques (PCA, locality preserving projection
o Results: n Best run: 0.19
TRECVID 2005
25
FXPAL o Approach n SVM trained on low level features donated by CMU n Classifier combination schemes based on various forms of regression n 1st time participation
o Results n Best result: map=0.18
TRECVID 2005
26
Helsinki University of Technology o Approach: n Self Organizing maps trained on multimodal features and LSCOM lite annotations
o Result: n 1 run : map 0.2
TRECVID 2005
27
IBM o
Approach n
Features: o o o
n n n n
o
Visual: Extensive experiments for selecting best feature type and granularity for individual modalities (color, texture etc.) Motion, Text, LSCOM LITE concepts Features also included meta-information such as time of broadcast, channel etc.
SVM > (ME, KNN, GMM ) Flat and hierarchical feature fusion Variations in classifier fusion methods Feature specific approaches (selection based on held-out data)
Results: 0,4 0,35 0,3 0,25 0,2 0,15 0,1 0,05 0
TRECVID 2005
28
Imperial College London o
Approach n
1. “Naïve model”: o o
n
o
locate salient clusters in feature space Learn HLF clusters models
2. Nonparametric Density estimation (kernel smoothing)
Results: n n
Naïve model: performance problems NPDE >> Naïve model
0,4 0,35 0,3 0,25 0,2 0,15 0,1 0,05 0
TRECVID 2005
29
Mediamill team (Univ. of Amsterdam) - presentation follows o
Approach n n n
o
Authoring metaphor Feature specific combination of content, style and context analysis 101 concept lexicon
Results: n
Textual features contribute only a small performance gain
0,4 0,35 0,3 0,25 0,2 0,15 0,1 0,05 0
TRECVID 2005
30
National University of Singapore (NUS) o
Approach 1. Ranked maximal figure of merit: ASR only, texture only, 2 fused runs 2. HMM for visual dependency (4X4 grid): ASR only, +visual, +audio,genre,OCR . RankBoost fusion
o
Results: n 2nd approach >> 1st approach
0,4 0,35 0,3 0,25 0,2 0,15 0,1 0,05 0
TRECVID 2005
31
University of Washington o
Approach: ? n
o
(notebook paper not available yet)
Results: 0,4 0,35 0,3 0,25 0,2 0,15 0,1 0,05 0
TRECVID 2005
32