Inequality in the Singaporean Workforce. Pundarik Mukhopadhaya*. Economics Department, Macquarie University, Sydney. This paper examines the trends in ...
INCOME INEQUALITY [Asian Economic Journal Vol. 17 [Asian Economic Journal 2003, 1998, IN Vol.SINGAPORE 12 No. No. 3] 3]
243
Trends in Total and Subgroup Income Inequality in the Singaporean Workforce
Pundarik Mukhopadhaya* Economics Department, Macquarie University, Sydney
This paper examines the trends in income inequality in Singapore using Labour Force Survey data from 1974 to 1998. Trends in inequality within and between age, educational and occupational groups are studied using the Theil inequality index. A new method based on the Gini coefficient is also utilized to explore the nature of inter-temporal variation in within-group inequality. Any increase within age-group inequality is due to changing income shares, while the decrease in educational-group inequality comes from decreases in within-group inequality. The contribution of intereducation inequality has also increased over the years, as has inter-occupational inequality. Keywords: decomposition, distributional Disparity, Gini, intergroup inequality, intragroup inequality, Theil coefficient. JEL classification codes: D31, D63, I38.
I. Introduction Singapore, a city-state of almost four million people, reached a gross national product (GNP) per capita of US$ 22 856 in 1998, following eight other economies in the list of 174 covered in the World Development Report, 1999–2000 (World Bank, 1999–2000). The country is also high in social development, with a life expectancy of 76 years, an adult literacy rate of over 90% and enviable progress in housing, education, health and sanitation. In housing, for example, over 80% of the population are owner-occupiers of apartments built on a vast scale as part of the subsidized public housing program. Given such achievements in economic and social development, considerable policy interest in income inequality trends has come about. Earlier research did address some of the
* Comments from three anonymous referees and G. Shantakumar have helped in revising an earlier draft of this paper. The usual caveats apply. Please note that a substantial part of the paper was written when the author was at the Department of Economics, National University of Singapore.
ASIAN ECONOMIC JOURNAL
244
issues.1 This paper attempts to add value by explaining the inequality trends using Theil decomposition and also by a new method using Gini decomposition with regards to age, education and occupation. The study is based on earnings inequality during 1974–1998 using data from the annual labor force surveys. This essay begins with a note on the earnings data (Section II.1). Trends in inequality are briefly discussed in Section II.2. The method used for the decomposition analysis is in Section III. Theil and Gini decomposition analyses with respect to age, educational attainment and occupation are presented in sections IV, V and VI, respectively. The final section provides a summary and some conclusions. II. II.1
The Trends in Overall Income Inequality Data for analysis
The analyses are based on income (earnings) data from the report on the Labour Force Survey (LFS, various years). For 1990, data refers to the population census and for 1995, the data refers to the General Household Survey (Department of Statistics, 1996), a mid-term sample census.2 Income is defined in the Labour Force Surveys (LFS) as the gross monthly income considered as total earned income from employment in the preceding calendar month. For employees, this includes wages and salaries, allowances, overtime, commissions, tips, bonuses and the employees’ contribution to the Central Provident Fund. For employers and own-account workers, it is the total receipts from sales and services minus operating expenses. The LFS for 1996 onwards included unpaid family workers that would inflate the computed level of inequality as they would be found in the lowest income class. To avoid this, unpaid family workers are excluded from the reported number of income recipients in the lowest income class. The LFS of Singapore publishes data in income groups.3 Thus, except for the highest and the lowest income classes, averages are assumed to equal the arithmetic means of the upper and lower bounds of the classes. For the highest and the lowest open-ended income classes, average income data or gross income estimates are not provided. For 1974–1988, the mean of the lowest income 1. See, for example, Pang (1975), Rao and Ramakrishnan (1980), Islam and Kirkpatrick (1986), Rao (1990) and Rao (1996). 2. Although for overall trend we will present results from the 1990 census and the 1995 General Household Survey, we will not use these data sources for decomposition analysis. This is because of the different definitions and classifications. 3. Thus, data is available for total labor force as a frequency distribution under several income ranges. Also classified data for occupation, education, industry, age etc. are available where income ranges and a number of people in each group are available for various classifications. Besides studies referred to in footnote 1, recently, the Singapore Department of Statistics (2000) used this classification for examining inequality in Singapore.
INCOME INEQUALITY IN SINGAPORE
245
group of ‘below $200’ was assumed to be $125. From 1989 onwards, the mean for the lowest income class of ‘below $400’ was set at $260.4 The highest income class in the surveys for 1974–1976 was ‘$1500 and above’. For 1977– 1992, it was ‘$3000 and above’ and for 1993 onwards it is ‘$6000 and above’. The estimation of the mean for the highest income class is based on the interpolation at the appropriate income groups on the assessed income distributions from the annual reports of the Inland Revenue Authority of Singapore (various years).5 II.2 Trends in income inequality The Gini ratio and the Theil index are presented in Table 1. The Gini coefficient for Singapore remained high at approximately 0.471 to 0.475 for the past decade. Starting from a ratio 0.429 in 1974, the Gini rose to 0.454 in 1977 before falling to an all-time low for 1978. It went up again to 0.461 in 1982 and has been approximately 0.460–0.475 since then. The labor force Theil index for 1974– 1998 follows a similar pattern.6 Rao (1999) and Mukhopadhaya and Rao (2002)
Table 1 Gini Ratios and Theil Index for Earnings, 1974–1998 Year
Gini ratio
Theil index
1974 1975 1976 1977 1978 1979 1980 1981
0.429 0.440 0.428 0.454 0.408 0.421 0.429 0.434
0.379 0.408 0.380 0.462 0.372 0.401 0.408 0.422
Year Gini ratio 1982 1983 1984 1985 1986 1987 1988 1989
0.461 0.476 0.471 0.464 0.459 0.461 0.462 0.471
Theil index
Year
Gini ratio
Theil index
0.449 0.462 0.448 0.429 0.419 0.424 0.425 0.435
1990 1991 1992 1993 1994 1995 1996 1997 1998
0.468 0.471 0.475 0.475 0.474 0.470 0.474 0.470 0.471
0.423 0.418 0.417 0.450 0.443 0.437 0.423 0.417 0.415
Sources: Computed from LFS (various years), Singapore Census of Population, 1990, and the General Household Survey 1995 (Department of Statistics, 1996).
4. This assumption is made to consider a positive monthly income for the lowest income group, but this assumption is arbitrary. During 1974 to 1988, most of the labor force had secondary or lower education, and the distribution of the workforce was weighted towards lower income brackets. In this case, the assumption of lower income bound might overestimate the measurement of inequality. For this reason, the inequality calculations in this paper are based on compromised measures of inequality with the computation of lower and upper bounds of Gini and Theil (See Cowell (1995) in this context). 5. This data source reports total income of taxpayers and total number of taxpayers, thus providing the most accurate income information for the highest income class in the labor force. 6. This observation is not similar to what Islam and Kirkpatrick noted. They observed a continuous decrease of both Theil (based on population share) and Gini between 1973 and 1983. This difference is perhaps due to the assumptions regarding the open-ended classes.
ASIAN ECONOMIC JOURNAL
246
observed a similar trend in Singapore. This trend can be explored through a decomposition analysis (sections IV, V and VI). III.
Decomposition Analysis: The Method
Income inequality in Singapore has varied through time. Decomposition of the inequality indices by subgroups of population will help to identify the sources of inequality. The Theil index7 is widely used in the literature for such analyses, because of its decomposable property.8 The index can be written as:
T =
y
∑ Si ln nSi , where Si = nXi
(1)
i
where yi is the mid-point income, X is the mean income of the total population (n), thus Si is the income share of person i. If total population is divided into k sub-groups, it can be demonstrated that: T =
∑g sgTg + TB
(2)
where sg is the income share of the subgroup g, while Tg is the Theil index for this group g. The first term of the right hand side is the weighted within-group (or intergroup) inequality. The second term, TB, is the between (or intragroup inequality). The between group component is the value of the inequality index when all within-group income differences are artificially suppressed. Thus, it can be said that the between-group inequality is the value of the inequality measure for an imaginary income distribution where within-group inequality is smoothed out by assigning each person within a group the mean income of the group. Hence,
TB =
∑
ng X ig X ln ig , n X X
(3)
where ng = number of people in group g and Xig = mean income of group g. The Gini coefficient cannot be decomposed into between-group and withingroup components, as above (if the constituent subgroups overlapped, which is most common). However, other decomposition procedures are possible for the Gini ratio. This paper follows the method from Rao and Ramkrishnan (1980).9 They have shown that when there are k mutually exclusive and exhaustive groups, the Gini coefficient (G) can be decomposed into: 7. See Theil (1967). 8. Islam and Kirkpatrick (1986) used the L-index to analyze inequality in Singapore between 1973 and 1983. Mukhopadhaya (2001) used Theil decomposition to examine male–female income diversity in Singapore. Akita (2000) used Theil decomposition to analyze Indonesian and Chinese inequality. 9. Some other attempts to decompose the Gini by subgroups of population can be found in Rao (1967), Bhattacharya and Mahalanabis (1967), Pyatt (1976), Lerman and Yitzhaki (1991), Lambert and Aroson (1993) and Podder (1993).
INCOME INEQUALITY IN SINGAPORE
G=
∑g
247
ng X g 1 Gg + n X X
∑g ∑ h
ng nh Dgh n n
(4)
where ng is the number of people in the gth group, n is the total sample size, and Gg is the Gini ratio for the group g. Dgh is the factor that explains distributional disparity between two groups g and h, hence: ∞
Dgh = ∫ [Fg − Fh ]2 dy
(5)
0
where Fg and Fh are distribution functions of incomes of groups g and h, respectively. Thus, the whole second term on the right hand side of the Gini decomposition is the ‘contribution of the disparity’ between the income distributions of the two populations to the inequality of the combined population. The population share of any group being less than 1 (i.e. very small) and the fact that the Dgh is very small in absolute terms when there are a large number expression y of groups, the second term of equation 4 is expected to be negligible (Rao and Ramkrishnan, 1980).10 The weighted within-group Gini would be: G* =
∑g
ng X g Gg = n X
∑g S gGg
(6)
where Sg is the income share of the group g. For the analysis of income inequality we can further write the change in G* over time as: dG* = dt
∑g Gg
dS g + dt
∑g S g
dGg dt
(7)
After discrete transformation of the continuous derivatives,11 we have: ∆Gt* =
∑g Gg ∆ S g, t + ∑g S g ∆Gg, t
(8)
where, ∆Gt* = Gt* − G* t−1, the change in total Gini over time, ∆Sg,t = Sg,t − Sg,t−1 is the change in income share in group g between two periods of time, and ∆Gg,t = Gg,t − Gg,t−1 is the change in Gini of group g over two periods of time.12 In the next three sections, we will analyze the changes in income inequality in Singapore over time with a detailed exploration of the inequality of various subgroups according to age, educational attainment and occupational status, 10. This paper uses the decomposition analysis for the age groups, various educational groups and occupational groups. It was found that less than 10% of the information was lost due to this factor. 11. Other popular attempts at inequality decomposition were made by Oaxaca (1973), Blinder (1973) and Juhn et al. (1993). All these methods were based on regression analysis. It is contended that our method is different. This decomposition procedure explains intertemporal changes in inequality, closer to the attempt by Mookherjee and Shorrocks (1982). 12. For empirical analysis, Sg and Gg are calculated as the average of two periods under consideration.
ASIAN ECONOMIC JOURNAL
248
subject to the following: (i) the Theil decomposition method traces the trend in intergroup and intragroup inequality; and (ii) the Gini decomposition method, as discussed above, examines the changing sources of within- (intra) group inequality over time. IV. Inequality and Age From 1984 to 1997/1998, the proportion of the labor force in the 15–24-year-old age group declined by 61%, while the proportion of over 40-years-of-age rose by 60% (see Table 2). There was a drastic drop in the labor force participation rates for the ages below 25 years, as relatively more individuals started pursuing tertiary education. The higher wage earned by ages 40–45 years compared to the age group 25–29 years declined from approximately 60% during 1984 to 50% during 1994–1997/1998. These changes underlie the narrowing of the interage inequality. The decline in the wage reward due to age, evidenced in Table 2, is a result of a flexi-wage system.13 In such a system, earnings are based on results and achievements.14 Table 2 Population Shares and Relative Mean Incomes of Various Age Groups, 1974–1997/1998 Age groups Population shares 15–24 years 25–29 years 30–34 years 35–39 years 40–44 years 45–54 years ≥55 years Relative Mean Income 15–24 years 25–29 years 30–34 years 35–39 years 40–44 years 45–54 years ≥55 years
1984
1992
1994
1997/1998
0.305 0.188 0.145 0.100 0.081 0.113 0.067
0.192 0.174 0.169 0.143 0.121 0.135 0.067
0.172 0.161 0.161 0.154 01.27 0.152 0.073
0.133 0.149 0.157 0.153 0.142 0.187 0.079
0.511 0.915 1.297 1.510 1.482 1.292 1.000
0.474 0.851 1.130 1.259 1.322 1.252 0.925
0.465 0.814 1.056 1.253 1.283 1.270 0.945
0.443 0.826 1.096 1.203 1.225 1.176 0.848
Note: Computed from LFS (various years).
13. In the flexi-wage system, the total wage has a fixed part (independent of productivity) and a variable part (completely dependent on labour productivity). 14. Since 1982 at the firm and industry level, a direct relationship was promulgated between wage and increase in productivity. Also, the employers’ contribution to the Central Provident Fund for workers aged more than 55 years was lowered. See Yah and Associates (1988) and Asher (1999) in this context.
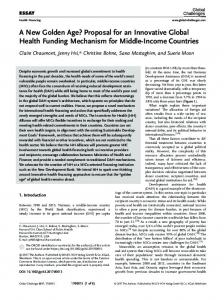
INCOME INEQUALITY IN SINGAPORE Figure 1
249
Result of Decomposition of Theil Index by Age
Note: Inter- and extragroup contributions will add to Theil). Source: Derived from LFS (various years), Singapore.
The interage income inequality pattern in Singapore from 1984 to 1998, measured in terms of Theil, is provided in Fig. 1. During 1983–1986, there was a decline in interage inequality from 0.061 to 0.058 (while, during 1984 interage inequality increased to 0.069). From 1986 to 1989, interage inequality was constant at 0.058. It dropped to 0.051 in 1990–1992, increased to 0.082 during 1993 and stayed close to 0.040 thereafter. On the other hand, intra-age inequality fluctuated within a range of 0.357 to 0.378. The interage Theil index is based on the disparities in the mean incomes among the different age groups. A narrowing of that disparity would mean an erosion of the age reward in earnings, as evidenced in Table 2. To analyze the increases in contribution of intra-age inequality in some detail, we present the Gini ratio in Table 3. As age increased within age group, Gini also increased. This is due to the presence of heterogeneous skills among higher age groups. It also confirms the upward movement of the total within-group inequality. However, the average annual change is positive only for the age groups 15–24 years and ≥55 years.15 Let us examine this trend in three phases using our methodology. From Table 4, we see that within-group weighted Gini increased during all three intervals: 1983–1992, 1992–1994 and 1994–1998. During these phases, the income share shows a decreasing movement. Thus, the group inequality has increased overall inequality. However, the magnitude of the effect of group inequality was almost halved during 1992–1994 compared to 1984–1992. The 15. One further point to note is that during the 1998 Asian economic crisis, Gini increased for both the age groups under 29 years. For all other age groups, Gini decreased during this period. This is because of the increase in unemployment in the age group below 30 years (LFS, 2001).
Year 1984 1985 1986 1987 1988 1989 1991 1992 1993 1994 1996 1997 1998 Average Average annual change
Gini ratio of individual age groups, 1983–1998
Total within group
15–24 years
0.442 0.438 0.435 0.430 0.434 0.435 0.444 0.445 0.454 0.546 0.454 0.455 0.453 0.451 0.0009
0.275 0.279 0.274 0.279 0.282 0.287 0.314 0.326 0.348 0.335 0.373 0.373 0.389 0.315 0.0095
25–29 years 0.367 0.359 0.346 0.354 0.341 0.351 0.364 0.372 0.468 0.340 0.345 0.336 0.337 0.361 −0.0025
30–34 years
35–39 years
40–44 years
45–54 years
≥55 years
0.447 0.436 0.428 0.434 0.435 0.441 0.442 0.441 0.554 0.412 0.421 0.422 0.419 0.442 −0.0023
0.489 0.477 0.477 0.473 0.481 0.482 0.464 0.467 0.573 0.472 0.460 0.460 0.459 0.481 −0.0025
0.508 0.501 0.499 0.497 0.494 0.496 0.484 0.478 0.579 0.495 0.488 0.483 0.477 0.500 −0.0026
0.499 0.507 0.496 0.497 0.495 0.512 0.507 0.503 0.594 0.516 0.513 0.501 0.495 0.510 −0.0003
0.512 0.515 0.512 0.500 0.508 0.505 0.508 0.515 0.620 0.534 0.538 0.529 0.528 0.524 0.0013
ASIAN ECONOMIC JOURNAL
Table 3
Note: Computed from LFS (various years).
250
INCOME INEQUALITY IN SINGAPORE
251
Table 4 Changing Pattern of Sources of Within Age Group Inequality 1984–1992
1992–1994
1994–1998
0.01087
0.00317
0.00121
g ,t
−0.001720
−0.001654
−0.005389
g ,t
0.009144
0.004819
0.007324
∆G t*
∑G ∆S g
g
∑ S ∆G g
g
Note: Computed from LFS (various years).
decease in income share during 1984–1992 mainly comes from a huge decrease in population share of the age group 15–24 years (as evidenced in Table 2), and the trend has continued in the subsequent years for all age groups below 30 years (due to an increased emphasis on education by the Government, while people in that age group had delayed entering the workforce).16 Figure 2 explains the age-education distribution in Singapore. It is observed that this distribution is quite unequal and could be the reason for the high inequality within the age group. It might be noted that with the expansion of educational opportunities, all the age groups encountered better qualified entrants over time. However, for the age group ≥50 years, less-educated people dominate with some moderation in recent years (which is also reflected by the Gini in Table 3). For the age group below 20 years, the left tail was stretched by the shift of the median to the right (also reflected by an increase in Gini in Table 3). In the 20–29 years age group, the increase in post-secondary plus educated people has been spectacular. However, for the age groups 30–39 years and 40–49 years, this increase is not that significant, and the distribution continues to be quite unequal. This explains the intra-age diversity in income.17 V. Inequality and Education Between 1974 and 1998, the educational level of the labor force shifted upwards due to an increasing number of better-educated entrants. The proportion of the workforce with below-primary education decreased from 40.3% in 1974 to 14.3% in 1998 (Table 5). In 1974, the bulk of the population was less educated, with 71.7% having less than a secondary education. The proportion of the less-educated workforce has decreased over the years (37.5% having less than secondary education in 1998). The upper end of the educational ladder has shown an almost six-fold increase in the proportion of university graduates during 16. Low et al. (1991). 17. The average gross monthly income in 1998 of a person with primary education was $1167, while that of a secondary educated person was $1913, a post-secondary or diploma holder earned $2500 and a degree holder earned $4333 (LFS, 1988).
ASIAN ECONOMIC JOURNAL
252
Figure 2 Age and Education Distribution: 1984, 1994 and 1998
Source: Derived from LFS (various years), Singapore: 1984, 1994 and 1998.
1974–1998, the percentage of the workforce with secondary and post-secondary education increased significantly before embarking on a downward trend in 1992. This period has witnessed an educational expansion, accounting for the above observations. After 1992, the rates for these two groups remained relatively unchanged, with only marginal changes (Table 5). While the tertiary-educated labor force would command a higher wage premium and salaries, the extent has reduced during the past 25 years. Thus, the
INCOME INEQUALITY IN SINGAPORE
253
Table 5 Population Shares and Relative Mean Incomes of Various Education Groups, 1974–1998 Educational groups Population shares Never attended school/lower primary Primary/Lower secondary Secondary Post-secondary Diploma Degree Relative mean Income Never attended school/lower primary Primary/Lower secondary Secondary Post-secondary Diploma Degree
1974
1989
1992
1998
0.404 0.314 0.197 0.062 – 0.024
0.191 0.292 0.315 0.140 – 0.062
0.157 0.296 0.301 0.111 0.053 0.081
0.143 0.232 0.285 0.100 0.099 0.141
0.734 0.831 1.198 1.597 – 4.292
0.555 0.661 0.927 1.479 – 3.258
0.516 0.649 0.920 1.132 1.491 2.778
0.420 0.577 0.839 1.110 1.222 2.383
Note: Computed from LFS (various years).
mean income of the tertiary educated, which was 4.3 times the overall mean income in 1974, had declined to 2.4 times in 1999. Yet, the disparity between the least educated and the tertiary educated has been preserved through a reduction in the relative mean income of the least educated (from 0.73 to 0.42). During 1974, even a secondary qualification could command an income close to the mean, but by 1998, one needed a post-secondary qualification to be close to the mean income of Singapore. Because of the structural change, starting from mid-1980s, the wage rate of the less-educated labor force dropped drastically relative to the skilled labor force.18 On the other hand, education expansion helped to moderate the higher earnings received by the educated. Decomposition of the Theil index by level of educational attainment (indicated in Fig. 3), shows that there was an overall increase in intergroup inequality levels between 1974 and 1983, with some moderation thereafter. Intergroup inequality levels were relatively low in the middle to late 1970s (approximately 0.11 by the Theil index), went up in the early 1980s, reached a peak of 0.170 in 1983, declined to 0.149 in 1994 and increased again to 0.160 during 1998. This pattern is due to the post-1979 shift away from low value-added production activities, towards higher value-added skill and technology-intensive sectors (Islam and Kirkpatrick, 1986). Economic restructuring shifted educational-wage differentials in favor of professional and other skilled workers, leading to higher inequality levels between educational groups during the early 1980s.19 18. See Mukhopadhaya and Rao (2002) for a detailed discussion. 19. However, the upward shift in the educational composition of the workforce, together with the recession in 1985–1986, brought down these earning differentials from skill shifts in the mid-1980s.
ASIAN ECONOMIC JOURNAL
254
Figure 3 Decomposition of Theil Index by Educational Attainment
Note: Inter- and extragroup make total Theil. Source: Computed from LFS (various years), Singapore.
Table 6 presents the Gini ratio for individual groups by educational attainment. The Gini ratio of the groups ‘never attended school/lower primary’ and ‘primary/ lower secondary’ was approximately 0.30–0.40, while for secondary educated it was approximately 0.35–0.40. For those with post-secondary education, the Gini was 0.40–0.50. For Diploma graduates, it stayed at approximately 0.40 from 1991 to 1998, while the university-educated group experienced the most fluctuation in the range 0.30–0.40 generally, with a drop in income inequality to an all-time low of 0.286 and 0.269 in 1991 and 1992, respectively, before hitting a high of 0.412 in 1993. One reason for the decline in the late 1980s and early 1990s was the expansion in tertiary education. However, the sharp increase in 1993 and 1994 was due to an engineering bias in manpower requirements and economic development when engineering students commanded the highest premium while those with general degrees experienced a drop in salaries. Furthermore, as both groups of students constituted the majority of the tertiary student population, the income range for graduates could have experienced a two-pronged effect (consisting of increases both in inequality and population share of this group) leading to increasing income inequality. Table 7 explains the pattern of within-group inequality reflected by the changing trends in income share and subgroup inequality. Weighted within-group Gini (G*) decreased during 1974–1978, and this was the result of decreasing inequality in various groups. However, during this period, the effect of income share in increasing inequality was positive. Although the population share of the group ‘never attended school/lower primary’ had decreased from 40.3% to 29%, resulting in a 25% decrease in income share, the population share of the groups ‘secondary’ and ‘post-secondary’ increased by 15 and 37%, respectively, leading
Year
Total
Never attended school/ lower primary
Primary/lower secondary
Secondary
Post-secondary
Diploma
Tertiary
1974 1975 1976 1977 1978 1979 1980 1981 1982 1983 1984 1985 1986 1987 1988 1989 1991 1992 1993 1994 1996 1997 1998 Average Average annual change
0.370 0.368 0.368 0.386 0.362 0.371 0.368 0.370 0.379 0.382 0.374 0.365 0.363 0.371 0.373 0.372 0.369 0.371 0.391 0.390 0.389 0.376 0.373 0.374 0.000
0.337 0.332 0.367 0.332 0.328 0.336 0.320 0.310 0.338 0.349 0.358 0.334 0.329 0.333 0.320 0.323 0.343 0.353 0.347 0.344 0.376 0.368 0.369 0.341 0.001
0.375 0.349 0.348 0.352 0.329 0.328 0.310 0.308 0.334 0.342 0.336 0.336 0.330 0.325 0.321 0.322 0.336 0.345 0.321 0.325 0.351 0.345 0.349 0.336 −0.001
0.404 0.415 0.380 0.412 0.382 0.390 0.376 0.388 0.393 0.403 0.391 0.381 0.376 0.391 0.393 0.391 0.398 0.402 0.383 0.378 0.381 0.357 0.352 0.388 −0.002
0.382 0.439 0.422 0.456 0.423 0.433 0.465 0.462 0.465 0.461 0.455 0.458 0.452 0.463 0.470 0.479 0.492 0.494 0.486 0.493 0.453 0.447 0.446 0.456 0.003
– – – – – – – – – – – – – – – – 0.401 0.411 0.391 0.384 0.406 0.404 0.399 0.122 0.018
0.365 0.311 0.334 0.408 0.391 0.406 0.413 0.402 0.366 0.339 0.323 0.307 0.312 0.328 0.323 0.309 0.286 0.269 0.412 0.405 0.382 0.370 0.365 0.353 0.000
255
Note: Computed from LFS (various years).
INCOME INEQUALITY IN SINGAPORE
Table 6 Gini Ratio of Individual Groups with Various Educational Attainments, 1974–1998
ASIAN ECONOMIC JOURNAL
256
Table 7 Changing Pattern of Sources of Within Educational Group Inequality 1974–1978 −0.00798
∆G t*
∑G ∆S g
g ,t
g
∑ S ∆G g
g
1979–1989
g ,t
0.004362 −0.01235
0.00077 0.014559 −0.01378
1989–1994 0.01795 −0.01981 0.037756
1994–1998 −0.01662 0.000162 −0.01764
Note: Computed from LFS (various years).
to an increase in respective income shares by 20 and 28%. G* recorded an increasing trend during 1979–1989 and 1989–1994; however, rows 3 and 4 of Table 7 demonstrate that the reason for this upward trend could be different. During 1979–1989, the rising trend can be partly explained by the increase in the income share (while there was a decrease in inequality within the group itself ); however, for the period 1989–1994, the positive influence came from the increase in intragroup income inequality. During 1979–1989, the Gini ratio for tertiary-educated workers registered almost a 24% decrease. In this period, individual group Gini for all the groups (except the post-secondary) had also decreased, which can be viewed as an effect of increases in educational and training opportunities that created equalization of wages even within the group. The increase in Gini in the post-secondary group can be accounted for by two factors: first, demand for labor in the services sector, through the restructuring process, had increased, and second, people already in the workforce with post-secondary qualifications enjoyed a higher wage over new entrants. However, this increase in inequality was overshadowed by the decrease in inequality in other sectors. The increase in income share of various groups is the most important reason for the increasing G* during 1979–1989 due to the increase in population share in post-secondary and tertiary groups. In this increase (of the population share), the contribution of women was the largest (LFS, various years). The year 1994 experienced the highest inequality among tertiary and postsecondary groups, a result of engineering bias in manpower requirements during that period (as explained earlier), and accounts for the increase in Gini during 1989–1994. Decrease in G* during 1994–1998 is mostly explained by the decrease in individual group inequality. During this period, the Gini for the tertiaryeducated group decreased from 0.405 to 0.365, that for post-secondary decreased from 0.493 to 0.446, as also for secondary from 0.378 to 0.352. This clearly indicates the erosion of experience premium in earnings in the same education group. Thus, the decomposition analysis shows that the increased inequality is largely accounted for by the increase in intereducational-group inequality. This has
INCOME INEQUALITY IN SINGAPORE
257
arisen from structural changes in the economy that was biased towards skilled labor. The contribution of intra-educational inequality decreases over time and the average change in weighted group Gini is almost zero. Over time, the age reward for earnings decreased as a result of flexi-wage systems. And this is the reason for the decreasing contribution of intra-educational inequality.20 The weighted within-group inequality increased during 1979–1989 and during 1989– 1994. The reasons are different for the two cases. In the first period, when structural changes began and wage diversity between better- and less-educated groups was high, the change in income share was the main factor that determined the increase. In the second period, the bias for engineering graduates (with better pay) created a large income diversity within groups (when Gini in the tertiaryeducated group increased from 0.309 to 0.405). VI. Inequality and Occupation In Table 5, we observe the changing educational composition of the Singaporean labor force. Table 8 shows the relevant figures for the occupational structure of the labor force for the period 1974–1998. The two groups ‘Legislators, senior officials, managers’ and ‘Professionals, technicians and related’ need a relatively higher degree of skilled labor as opposed to the groups classified as sales and services, production and related workers, transport equipment operators and laborers. In 1974, ‘Production and related workers, together with ‘Sales and clerical workers’ made up the three largest groups. However, economic restructuring in the early 1980s boosted the demand for professionals, managers and technicians. This increase was also due to the expansion of the financial and business services as well as the commerce sectors. The employment share of legislators, senior officials, managers and professionals increased from 20% in 1989 to 40% in 1998 (Table 8). This is attributable to the rise in educational attainment of the workforce. The share of clerical workers remained relatively unchanged over the years. One reason is the relatively steady pool of the secondary and post-secondary workforce. The pool of service workers experienced a drastic drop from 1989 to 1992, by 10.9%, due to a reduced pool of workforce with below-secondary education levels. The share of ‘Production and related workers’ also declined for the same reason; however, because of the influx of foreign workers into these jobs, the decline was shielded. Table 8 reveals that the higher wage commanded by professionals etc., legislators etc., clerical workers and service workers were decreasing over time. During 1992–1998, the relative mean income for the first two groups decreased from 2.5 to 2.2 and 1.7 to 1.3, respectively. The other occupational groups 20. The intra-education inequality could be high in those cases where the same education group had a high dispersion of income due to differences in age/experience. (Backer, 1964; Mincer, 1970).
ASIAN ECONOMIC JOURNAL Table 8
258
Population Shares and Relative Mean Incomes of Various Occupation Groups, 1974–1998
Occupational groups Population shares Professional, technicians and related workers Legislators, senior officials and managers Clerical and related workers Service workers, shop and market sales workers Production workers, equipment operators and labourers Relative mean income Professional, technicians and related workers Legislators, senior officials and managers Clerical and related workers Service workers, shop and market sales workers Production workers, equipment operators and labourers
1974
1989
1992
1998
0.110 0.020 0.163 0.245 0.388
0.121 0.078 0.153 0.245 0.361
0.101 0.197 0.143 0.130 0.385
0.128 0.270 0.149 0.126 0.293
1.818 4.159 1.301 0.882 0.701
1.926 2.935 0.752 0.751 0.612
2.495 1.741 0.713 0.615 0.525
2.258 1.293 0.691 0.548 0.464
Note: Computed from LFS (various years).
(which were less educated) had also been experiencing wage decreases. This observation can be linked with changing educational profiles and the needs of the economy over the period. Primarily, those occupational groups with better education obtained a declining mean income over the years because of the new workforce who were progressively more educated. Second, as the economy advanced, there was a reduced demand for less-educated manual workers. As a result, these non-professional occupational groups have been experiencing wage declines. And this was compounded by the fact that there was an influx of foreign workers. Because of lower wages, within a regime of foreign workers, the overall wage level of manual workers (including the locals) decreased over time. Interoccupational inequality levels (Fig. 4) show an upward trend between 1974 and 1998, excluding a slight dip during the 1985 recession. Between 1974 and 1998, interoccupational inequality, as measured by the Theil index, almost doubled from 0.106 to 0.194. Intragroup inequality, however, was downward falling by almost a third from 0.288 to 0.226. This is in sharp contrast to trends in intra-educational activity, illustrating that the education-occupation linkage is strong. The rise in interoccupational inequality can be attributed to a widening wage gap between the various occupational groups. The shortage of skilled labor has allowed the two most highly paid occupations (professional, and administrative and managerial) to improve their position relative to the other groups. On the other hand, the presence of cheap foreign labor has resulted in the relative stagnation of wages for the workers in unskilled and semiskilled occupations. The significant reduction in intra-occupational inequality is an acrossthe-board reduction. It implies that if interoccupational disparities had been
INCOME INEQUALITY IN SINGAPORE Figure 4
259
Decomposition of Theil Index by Occupation
Source: Computed from LFS (various years), Singapore.
kept in check, the overall level of income inequality would have reduced. The interoccupational inequality increase was due to selective immigration policy (See Mukhopadhaya and Rao, 2002). Immigration policy is not governed by income-inequality considerations. Preserve international competitiveness might well mean that workers from both the upper and lower ends of the income scale must be attracted to Singapore. Thus, international competitiveness and rapid economic growth are not compatible with the objective of lowering the income inequality. Table 9 presents the Gini ratio of each occupational group. Over the period 1974–1998, the highest income inequality is for the occupational group ‘Others’, followed by ‘Sales and service workers’, while the lowest income inequality is found among ‘Clerical and related workers’. For the ‘Others’, inequality has been increasing over the years because of the heterogeneity of skill composition of the group. Most sales and service workers have a pay structure that comprises a fixed component and a variable component (sometimes called ‘commission’). This variable component depends much on the individual’s ability to provide a service and the type of the service provided. Hence, a wide variation is likely to be observed in this occupational group. On the other hand, clerical and related workers have little variation in their incomes. They usually have the same educational attainment and their pay is standardized across the industries. Thus, this group tends to have the smallest degree of income inequality over the years. Table 10 describes the within-group inequality in terms of changes in group inequality and changes in income shares. Four phases are considered. During 1974–1978, within-group inequality decreased and this decrease is explained mainly by the decrease in intra-occupation inequality in various groups. During
Total
1974 1975 1976 1977 1978 1979 1980 1981 1982 1983 1984 1985 1986 1987 1988 1989 1991 1992 1993 1994 1996 1997 1998 Average Average change
0.371 0.382 0.372 0.391 0.357 0.325 0.357 0.354 0.367 0.367 0.360 0.357 0.354 0.358 0.357 0.351 0.338 0.334 0.358 0.354 0.361 0.365 0.360 0.359
0.434 0.463 0.411 0.445 0.399 0.248 0.426 0.426 0.425 0.415 0.412 0.405 0.406 0.411 0.415 0.412 0.340 0.316 0.425 0.413 0.397 0.391 0.378 0.401
0.382 0.412 0.416 0.469 0.454 0.462 0.451 0.434 0.403 0.368 0.354 0.348 0.348 0.353 0.345 0.334 0.387 0.384 0.383 0.374 0.374 0.389 0.380 0.391
0.320 0.332 0.312 0.328 0.305 0.314 0.250 0.265 0.275 0.273 0.264 0.263 0.255 0.257 0.255 0.255 0.236 0.225 0.218 0.206 0.235 0.237 0.235 0.266
0.000
−0.003
0.000
−0.004
Professional, technical and related workers
Note: Computed from LFS (various years).
Legislators, senior officials and managers
Clerical and related workers
Service workers, shop and market sales workers
Production workers, equipment operators and laborers
Others
0.414 0.408 0.452 0.454 0.423 0.441 0.416 0.397 0.430 0.445 0.435 0.437 0.425 0.418 0.424 0.434 0.328 0.326 0.301 0.303 0.342 0.325 0.331 0.396
0.309 0.294 0.290 0.285 0.266 0.261 0.253 0.249 0.281 0.291 0.294 0.275 0.276 0.279 0.268 0.273 0.300 0.305 0.302 0.307 0.331 0.329 0.333 0.289
0.426 0.464 0.354 0.425 0.381 0.411 0.414 0.497 0.525 0.543 0.548 0.562 0.549 0.576 0.613 0.482 0.559 0.577 0.582 0.605 0.644 0.631 0.657 0.523
−0.004
0.001
0.011
260
Year
ASIAN ECONOMIC JOURNAL
Table 9 The Gini Ratio for Individual Occupational Groups, 1974–1988
INCOME INEQUALITY IN SINGAPORE Table 10
Changing Pattern of Sources of Within Occupational Group Inequality 1974–1978
∑G ∆S g
g ,t
g
∑ S ∆G g
g
1979–1989
−0.01461
∆G t*
g ,t
261
0.000353 −0.01496
0.02635 −0.00469 0.01973
1989–1994
1994–1998
0.00322
0.00553
0.004864
0.003367
−0.00164
0.002163
Note: Computed from LFS (various years).
the early phase of industrialization, when demand for both skilled and unskilled manpower was very high, it had an equalizing effect in each occupational group. This decrease can be explained by the decrease in relative mean income in different groups. During this period, for ‘Administrative and managerial workers’, relative wages decreased by 19%, for ‘Others’ wages decreased by 30%, while a slight increase was observed for ‘professional’ workers. The increase in intragroup inequality during 1979–1989 can be explained by the increase in individual group Ginis. The groups ‘Professional’ and ‘Others’ experienced the maximum increase from 0.248 to 0.412 and 0.411 to 0.482, respectively. During this period, with economic restructuring, skilled immigrants within the professional group were attracted through high salaries that created disparity within the group itself (between locals and expatriates). This disparity was further fuelled by a major public sector salary scale revision for the professional grades during this period (Straits Times, August 6, 1985): the starting salary of graduates in the public sector was higher than for the private sector (Islam and Kirkpatrick, 1986). The period 1989–1994 witnessed an increase in intra group inequality, mainly from the change in income share. Noticeable increases in population share were observed for the group ‘Legislators, senior officials and managers’ of almost 270%, which is mainly due to the effect of expansion of education beginning in the early 1980s. The increase in within group Gini during 1994–1998 was from increases in individual group Gini and income shares. During this period, population share of the ‘Legislators etc.’ increased by another 25% while their Gini increased from 0.374 to 0.380. Again, the increase in population share can be traced to the educational expansion and increase in female workforce. With the expansion of educated entrants into the labor force during the second half of 1990s, an increase of more than 60% female labor is observed in the group that includes legislators. Mukhopadhaya (2001) has noted that during this time, for the ‘Legislators etc.’ group, the between male-female income inequality had increased by 12% and, on average, men in this group enjoyed a salary of almost 28% more than women. This is another reason for the increase in inequality within the ‘Legislators etc.’ group in late 1990s.
ASIAN ECONOMIC JOURNAL
262
VII. Conclusion This paper provides an analytical description of the trend in earnings inequality in Singapore over the period 1974 to 1998. In terms of absolute inequality (as per World Bank Reports), Singapore is ahead of Thailand, Korea, Taiwan and Indonesia. This is a result of attracting talented and skilled workers by rewarding them handsomely in order to raise productivity and at the same time allowing firms and households to employ workers at the lower end of the income ladder. It is observed that educational expansion has not lowered the level of income inequality. The decomposition analysis has brought out some interesting findings. Intraage and intra-educational income disparities respectively contributed some 88% and 66% to the overall inequality. Among all the intergroup disparities, interoccupational disparities had the highest weight (approximately 40%) in overall inequality, and this was due to the impact of selective immigration policies and related factors. It was noted that over the years, intra-age inequality had increased, while intra-educational and intra-occupation inequality remained almost constant. Thus, the increases in inequality are accounted for by the increases in intra-age and intereducational and interoccupational inequalities. The interage inequality reduced from the policies related to productivity-based earnings (in contrast to age or experience-based earnings). However, the drive to enhance educational opportunities encouraged better-educated entrants into the workforce, resulting in within-age-groups disparity increases. Although, over time, the premium on salaries for the better-educated group had decreased as a result of restructuring, income disparity remained high between skilled (educated) and less-skilled (lesseducated) workers. With more workers in the skilled category, intereducation inequality accounts for the increasing trend in overall inequality. The official selective immigration policy depresses the wage rate for some of the occupations related to construction etc., while professionals and legislators attracted high salaries. Thus the interoccupation inequality also increases. This paper explains the distribution of incomes over a quarter of a century. However, there are different forms of subsidies that are not included in the income distributions. Most important of these subsidies are in the public housing and higher education sectors. As these are provided regardless of income level of the recipients, any relative measure of inequality (like the Gini ratio or the Theil index) will show a smaller value had these been included. The Singapore Government also provides other subsidies in medical and health sectors, public assistance for the needy, preferential share allotments to citizens in privatized enterprises etc. Clearly, if all these are considered, the level of income inequality might be lower than what has been observed in this paper.
INCOME INEQUALITY IN SINGAPORE
263
References Akita, T., 2000, Decomposing Regional Income Inequality in China and Indonesia using twostage Nested Theil Decomposition Method. Proceedings of the 7th Convention of the East Asian Economic Association; 17–18 November, Singapore (unpubl. monograph). Asher, M. G., 1999, Pension Scheme in Singapore: Case Study and Implications. Economic and Political Weekly, 34, pp. 3687–3694. Becker, G. S., 1964, Human Capital: A Theoretical and Empirical Analysis. Columbia University Press and National Bureau of Economic Research, New York. Bhattachatya, N. and B. Mahalanabis, 1967, Regional Disparity in Household Consumption in India. Journal of American Statistical Association, 62, pp. 143–161. Blinder, A. S., 1973, Wage Discrimination: Reduced forms and Structural Estimates. Journal of Human Resources, 8, pp. 463–455. Cowell, F. A., 1995, Measuring Inequality. Prentice Hall, London. Department of Statistics, 1996, General Household Survey 1995: Sociodemographic and Economic Characteristics. Department of Statistics, Singapore. Islam, I. and C. Kirkpatrick, 1986, Exportled Development, Labour-market Conditions and Distribution of Income: The Case of Singapore. Cambridge Journal of Economics, 10, pp. 113–127. Inland Revenue Authority of Singapore, various years, Inland Revenue Authority of Singapore Annual Report. Inland Revenue Authority of Singapore, Singapore. Juhn, C., K. M. Murphy and B. Pierce, 1993, Wage Inequality and Rise in Return to Skill. Journal of Political Economy, 10, pp. 410–442. Lambert, P. J. and J. R. Aroson, 1993, Inequality Decomposition Analysis and the Gini Coefficient Revisited. Economic Journal, 103, pp. 1221–1227. Lerman, R. I. and S. Yitzhaki, 1991, Income Inequality Effects by income source: A New Approach and Application to the United States. Review of Economics and Statistics, 67, pp. 151–156. Labour Force Survey, various years, Report of Labour Force Survey. Department of Statistics, Government of Singapore, Singapore. Low, L., T. M. Heng and S. T. Wong, 1991, Economics of Education & Manpower Development: Issues and Policies in Singapore. McGraw Hill, Singapore. Mincer, J., 1970, The Distribution of Labour Incomes: A Survey with Special Reference to the Human Capital Approach. Journal of Economic Literature, 8, pp. 1–26. Mookherjee, D. and A. F. Shorrocks, 1982, A Decomposition Analysis of the Trend in UK Income Inequality. Economic Journal, 92, pp. 886–902. Mukhopadhaya, P., 2001, Changing Labour Force Gender Composition and Male-female Income Diversity in Singapore. Journal of Asian Economics, 12, pp. 547–568. Mukhopadhaya, P. and V. V. B. Rao, 2002, Income Inequality. In: Singapore Economy in 21st Century: Issues and Strategies. (eds Koh, A. T., K. L. Lim, W. T. Hui, V. V. B. Rao and M. K. Chung) pp. 95–111. McGraw-Hill, Singapore. Oaxaca, R., 1973, Male-Female Wage Differentials in Urban Labour Markets. International Economic Review, 14, pp. 693–709. Pang, E. F., 1975, Growth, Inequality and Race in Singapore. International Labour Review, III, pp. 15 –28. Podder, N., 1993, A New Method of Disaggregating the Gini Index by groups. Sankhya, 55, pp. 262–271. Pyatt, G., 1976, On the interpretation and disaggregation of Gini Coefficient. Economic Journal, 86, pp. 243–255. Rao, V. M., 1967, Two Decomposition of Concentration Ratio. Journal of Royal Statistical Society, 132, pp. 428–435. Rao, V. V. B., 1990, Income Distribution in Singapore: Trends and Issues. Singapore Economic Review, April, pp. 143–160.
ASIAN ECONOMIC JOURNAL
264
Rao, V. V. B., 1996, Income Inequality in Singapore: Facts and Policies. In: Economic Policy Management in Singapore. (ed. L. C. Yah) pp. 383–396. Addition-Wesley, Singapore. Rao, V. V. B., 1999, East Asian Economies: Trends in Poverty and Income Inequality. Economic and Political Weekly, 34, pp. 1029–1039. Rao, V. V. B. and M. Ramkrishnan, 1980, Income Inequality in Singapore. Singapore University Press, Singapore. Singapore Census of Population, 1990, Economic Characteristics. Census of Population Office, Department of Statistics, Singapore. Singapore Department of Statistics, 2000, Is Income Disparity Increasing in Singapore? Occasional paper on Social Statistics. Singapore Department of Statistics, Singapore. Theil, H. R., 1967, Economics and Information Theory. North Holland, Amsterdam. World Bank, 1999–2000, Entering the 21st Century. Oxford University Press, New York.Yah, L. C. and Associates, 1988, Policy Options for the Singapore Economy. McGraw Hill, Singapore.