International Journal of Selection and Assessment
Volume 22 Number 3 September 2014
Generating Race, Gender, and Other Subgroup Data in Personnel Selection Simulations: A pervasive issue with a simple solution Frederick L. Oswald*, Patrick D. Converse** and Dan J. Putka*** *Rice University, 6100 Main Street – MS25, Houston, TX 77005, USA.
[email protected] **School of Psychology, Florida Institute of Technology, 150 W. University Boulevard, Melbourne, FL 32901, USA ***HumRRO, 66 Canal Center Plaza, Suite 700, Alexandria, VA 22314, USA
In the past 25 years, organizational researchers and practitioners have relied heavily on computer simulation research to understand how group mean differences and correlations affect overall validity and adverse impact in protected groups (e.g., racial/ethnic groups and gender) as they relate to personnel selection practices. We point out a multilevel issue affecting nearly all past simulations: The total correlations that these simulations intended to specify are somewhat distorted after group mean differences were introduced into the data. Although this distorting effect is minimal in most cases, it matters in some cases, and after all, the main virtue of statistical simulations is precision, both in the population parameters and sample data and statistics those parameters are supposed to generate. We demonstrate this distorting effect through one specific example, based on multiple predictors and meta-analytic data, followed by a broader simulation for single predictors across a wide variety of selection conditions. Rather than merely point out this problem, we also provide a straightforward solution: multilevel formulas that incorporate both between- and within-group correlations that always correct for this biasing problem, yielding more accurate simulation results. We conclude by discussing applications and promising extensions of this work.
1. Introduction
O
bs_bs_banner
ver the past several decades, Monte Carlo simulations have informed a wide variety of areas in personnel selection research and practice, such as ethnic group mean differences (Roth, Bobko, Switzer, & Dean, 2001), adverse impact (Dunleavy, Stuebing, Campion, & Glenn, 2008; Roth, Bobko, & Switzer, 2006), trade-offs between validity and adverse impact (De Corte & Lievens, 2003; De Corte, Lievens, & Sackett, 2007), test score banding (Laczo & Sackett, 2004; Schmitt & Oswald, 2004), linear regression analyses with predictor weighting (Doverspike, Winter, Healy, & Barrett, 1996) or criterion weighting (Hattrup, Rock, & Scalia, 1997; Hattrup & Rock, 2002), and multistage selection systems
(De Corte, Lievens, & Sackett, 2006; Finch, Edwards, & Wallace, 2009). At the core of all these simulation studies is generating sample data that arise from specified population values for the total correlation between X and Y and group mean differences (d-values) on X and Y simultaneously. Unfortunately, most if not all of these simulations have overlooked an issue that, conceptually and statistically, amounts to ignoring the multilevel nature of the data. Today’s organizational researchers have a heightened sensitivity to the problem of ignoring multilevel data in organizations (e.g., Hitt, Beamish, Jackson, & Mathieu, 2007), where applying simple linear regression to multilevel data can lead to inaccurate standard errors and inflated Type I error rates (Bliese & Hanges, 2004). Ex-
© 2014 John Wiley & Sons Ltd, 9600 Garsington Road, Oxford, OX4 2DQ, UK and 350 Main St., Malden, MA, 02148, USA
Subgroup Data in Selection Simulations plicitly modeling the multilevel nature of the data is a fundamental requirement for conducting the appropriate statistical analyses and drawing appropriate conclusions from them (Bliese & Ployhart, 2002). Despite current organizational research appreciating and incorporating multilevel methods, group simulations in organizational research have unfortunately ignored the multilevel nature of their data, and this can distort empirical results in ways that appear to be unappreciated by those conducting simulations or interpreting the results from them. Fortunately, it appears that on average, the distortions are not large enough to completely reverse the history or the practical significance of past simulation work of the sort we have just cited. However, as demonstrated later, under some conditions the distortion can be quite large and thus substantive conclusions could be affected – which is critically important to practitioners and other consumers of this research whose local situation is characterized by those specific conditions. Furthermore, given that the hallmark virtue of simulations is precision – or a full understanding of the underlying conditions and parameters that give rise to the data – a solution to this fundamental multilevel problem involving correlations and mean differences across multiple groups is required to produce accurate simulation data. The purpose of this article is to (1) illustrate the issue noted above, (2) provide a straightforward multilevel formula and simulation method that removes the distortion that results from this problem, (3) point to both a specific example and general conditions under which distortion will occur with traditional simulation methods, and (4) conclude by offering future directions for simulation research in personnel selection.
2. Illustration of the pervasive issue The issue is best illustrated by way of a simple example explaining how personnel simulations that incorporate subgroup differences have almost uniformly been carried out. Imagine you wish to simulate cognitive ability and job performance data for a sample of 1,000 individuals, 200 of whom are Black and 800 of whom are White. Data are generated from metaanalytic estimates found in past literature that reports an average correlation between cognitive ability and job performance of r = .30 (Bobko, Roth, & Potosky, 1999), with standardized mean differences between Blacks and Whites on cognitive ability and job performance of d = −1.00 and d = −0.45, respectively1 (Ford, Kraiger, & Schechtman, 1986; Hunter & Hunter, 1984). With little evidence of differential validity for cognitive ability as a function of race, the researcher almost without exception believes that the metaanalytic correlation cited above should be the same
© 2014 John Wiley & Sons Ltd
311 value for both Whites and Blacks (Jensen, 1980; Schmidt, Pearlman, & Hunter, 1980). After laying this foundation of assumptions, the simulation data are generated. In Step 1, random uncorrelated standard normal scores are generated for the ability and performance variables for 1,000 cases. In Step 2, these uncorrelated variables are transformed into variables having the desired correlation (e.g., LU decomposition or Cholesky decomposition; Simon & Blume, 1994). In Step 3, group mean differences are created by randomly selecting 800 of the 1,000 cases, identifying them as Whites, and adding 1.00 standard deviation (SD) units to their standardized cognitive ability variable scores and 0.45 SD units to their standardized job performance variable scores (of course, subtracting these amounts for the Black group instead would achieve the same results). Scores can conform either exactly to the population means and total correlation specified or within the bounds of sampling error variance. We assume the former because it is simpler and does not detract from our main points. Also for the sake of simplicity, we assume that the variables’ variances for each subgroup are equal in their respective populations. Previous large-sample data in applied settings have supported this latter assumption (e.g., Jensen’s [1980] summary of the large-sample distributional characteristics of Wonderlic data within Black and White applicant populations), as well as the related assumption of homogeneity of variances within subgroups (equal variances in regression residuals) in the context of ability and personality predicting performance in differential prediction analysis (Oswald, Saad, & Sackett, 2000). If one double-checks this three-step procedure by calculating the correlation between simulated cognitive ability and job performance variables for the entire sample, the total correlation is r = .34 rather than the desired value of r = .30 (see Figure 1, Panel A). The researcher finds that within the Black and White groups, the correlation is in fact r = .30. However, .30 was the desired total correlation. To achieve that value, the correlation within the White and Black groups should have been rwithin = .256 instead (see Figure 1, Panel B). Clearly there is a problem here, as the desired simulation values are discrepant from the actual simulation values – certainly more discrepant than the desire for simulation precision would dictate. In this specific example and in ones like it, the inherent problem is multilevel in nature. The researcher failed to appreciate how in Step 2, the overall metaanalytic estimate for the cognitive ability-job performance correlation reflects both the within-group correlation (correlation within each racial group) and the between-group correlation (correlation between racial groups that arises because of group mean differences on cognitive ability and performance). Adding group mean
International Journal of Selection and Assessment Volume 22 Number 3 September 2014
312
Frederick L. Oswald, Patrick D. Converse and Dan J. Putka
Panel A: Incorrect Three-Step Procedure For Simulating Group Differences rwithin = .30
dy = .45
rwithin = .30
rtotal = .34 (unintended value)
3. Description and illustration of the simple solution: a four-step simulation approach
dx = –1.00 Panel B: Correct Four-Step Procedure For Simulating Group Differences rwithin = .256
dy = .45
rwithin = .256
rtotal = .30 (correct value)
dx = –1.00
Figure 1. Incorrect versus correct methods for simulating total and within-group correlations.
differences to the simulated data in Step 3 induces this between-group correlation again, which distorts the total correlation that was already established in Step 2. Generally speaking, whether this distortion resulting from this multilevel problem is of practical importance depends on both its magnitude and how the magnitude translates into real-world use. The magnitude alone is not sufficient, because even small distortions can imply practically important losses to organizations or employees, depending on the criticality of the outcome or utility metric, the time span and number of people over which the bias is multiplied, and so on. The main point for the current paper is that this multilevel problem – no matter how big or small it is judged to be in a particular situation – is always avoidable, just like the problem of ignoring the multilevel nature of the data in a simple linear regression is always avoidable using hierarchical linear modeling or other analyses appropriate to the data instead. Given that the benefit of simulation work over field studies lies in its precision, this is an important if not critical goal. To date, however, it appears that almost all personnel selection simulations have ignored what is inherently a
International Journal of Selection and Assessment Volume 22 Number 3 September 2014
multilevel issue. To reiterate, selection simulations have almost uniformly assumed that the correlation matrix they started out with to generate the sample data is the same as the correlation matrix they end up with after mean differences are added to the predictor and criterion scores of relevant groups – yet this is clearly incorrect. Prior to exploring the scope of this general problem, we will introduce a simple four-step simulation method that eliminates this problem in all cases and is useful in providing further insight into the nature of the problem itself.
The decomposition of the total correlation into withingroup and between-group correlations has been described by organizational researchers within the context of multilevel research (e.g., Dansereau, Alluto, & Yammarino, 1984; McIntyre, 1990; Ostroff, 1993; Ree, Carretta, & Earles, 1999) and provides the basis for our four-step simulation approach. Typically, simulation studies in the organizational literature have relied on previous meta-analysis results for estimates of total correlations and standardized group mean differences (e.g., simulations by Doverspike et al., 1996; Dunleavy et al., 2008; Finch et al., 2009; Hattrup et al., 1997). The new four-step procedure also relies on these estimates, but the first step estimates the within-group correlation based on values of the total correlation between X and Y and group mean differences on X and on Y – again, see Figure 1, panel B. It is this new first step that distinguishes it critically from the traditional three-step procedure. Once this first step is implemented, the threestep simulation process can then be carried out as it was illustrated in the previous section (and in previous simulation research), except one uses the within-group correlation, as opposed to the total correlation, as a starting point. By starting the three-step process with the within-group correlation, the subsequent addition of mean differences leads to the desired total correlation. This new step is a relatively simple one, but to the best of our knowledge, it has not been clearly acknowledged, described, or used in the past selection simulation literature. As such, the work that follows provides a critical resource for future selection simulation research involving multiple groups. Mathematically, the total correlation is expressed as the sum of a between-group component and a withingroup component (Robinson, 1950):
rTXY = ηBX ηBY rBXY + ηWX ηWY rWXY ,
(1a)
where rTXY is the total correlation, rBXY is the betweengroup correlation, rWXY is the within-group correlation,
© 2014 John Wiley & Sons Ltd
Subgroup Data in Selection Simulations
313
ηBX and ηBY is the correlation between scores and their respective group means (eta-between), and ηWX and ηWY is the correlation between scores and deviations of these scores from their respective group means (eta-within). This equation clearly shows that the between-group correlation – arising from mean differences in X and/or Y – almost always makes the total correlation different from the within-group correlation. In fact, these correlations would only be the same under highly constrained mathematical conditions that one would never expect from any data. As we have noted, the novel element of the four-step procedure comes in estimating the within-group correlation in a new Step 1, based on the desired total correlation that might come from past literature or past meta-analyses. Let us relabel the total correlation rTXY from Equation 1a as rStartingTXY : rStartingTXY = ηBX ηBY rBXY + ηWX ηWY rWXY .
(1b)
The within-group correlation required for the new Step 1 comes from simple algebraic rearrangement:
rWXY =
rStartingTXY − ηBX ηBY rBXY ηWX ηWY
(2a)
Each term on the right-hand side must then be calculated. The between-group correlation rBXY is determined by the correlation between the group means, which is limited to only two values when there are two groups (e.g., Blacks and Whites): (1) +1 if group differences exist in the same direction for X and Y (i.e., the same group has the higher score on each variable) or (2) −1 if group differences exist in the opposite direction for X and Y (i.e., different groups have the higher score on each variable). Also, note that in the mathematically constrained case where mean differences in X or in Y are exactly zero, the between-group correlation is zero, and therefore the between-group component of Equations 1 and 2 (i.e., ηBX ηBY rBXY ) would drop out. As mentioned earlier, this latter case is very unlikely to happen. To simplify the formula for the within-group and between-group etas, we can set the mean of X and Y for the reference group (e.g., Whites) equal to zero (i.e., subtract the mean of the reference group from all X and Y scores). This is a linear rescaling that does not change the distribution of the data, but it allows for a simplification of the between and within etas for X and Y as follows:
ηB = and
© 2014 John Wiley & Sons Ltd
c c +1
(3)
ηW = 1 − ηB2 =
1 , c +1
(4)
where c = d2[pmin (1 – pmin)], d is the estimated standardized mean difference between groups (e.g., Blacks and Whites) on the variable of interest (i.e., X or Y), and pmin refers to the proportion of the sample in the minority group (e.g., Blacks). This formula for c reveals that when simulating grouped data, the value of the within-group correlation depends on the total correlation, mean differences between groups, and group proportions with which one begins the simulation process.2 In terms of c, Equation 2a simplifies to
rWXY = rStartingTXY ( c X + 1)( cY + 1) − c X cY
(2b)
These two terms are subtracted when group mean differences in X and Y are in the same direction (which our examples are based on) – but note that the terms are added when they are in opposite directions. Going back to the empirical example described previously, given (1) a starting total correlation of .30 between cognitive ability and job performance, (2) mean differences between Blacks and Whites of 1.00 SD on ability and 0.45 SD on job performance, and (3) the average proportion of Blacks underlying the total correlation is .20 (per Bobko et al., 1999), Equation 2a or 2b estimates a within-group correlation of r = .256 (again, see Figure 1, panel B). This value is then used as the input correlation for the additional three steps described earlier. This methodology can easily be extended to simulation studies with multiple predictors and criteria, each with different group mean differences (e.g., Finch et al., 2009).
4. When is using the three-step simulation method problematic? To this point, we have explained how the four-step procedure is the correct approach for modeling grouped data in selection simulations, and how the three-step procedure incorrectly treated the total correlation as a within-group correlation to which subgroup means in X and Y were incorrectly re-added. It is also worth knowing the extent to which the customary but incorrect three-step procedure threatens the conclusions of the vast array of selection simulation research that has relied on it in the past. To that end, we provide both mathematical and empirical illustrations of bias in the total correlation when relying on the typical three-step procedure for simulating subgroup data. Simulations of differential prediction, validity-adverse impact trade-offs, and other specific personnel selection outcomes rely on
International Journal of Selection and Assessment Volume 22 Number 3 September 2014
314
Frederick L. Oswald, Patrick D. Converse and Dan J. Putka
the total correlation across groups; therefore, we focus on bias in the total correlation because it provides a common denominator across a wide variety of selection simulations.
4.1. Expected level of three-step bias in total correlations From the perspective of Equation 1b, the three-step procedure amounts to treating the total correlation one begins with in the three-step procedure, rStartingTXY , as if it were a within-group correlation instead, and then adding group mean differences to data that are based on that correlation. Mathematically:
rThree −StepTXY = ηBX ηBY rBXY + ηWX ηWY rStartingTXY
(5)
Equation 1b (the correct four-step total correlation) can be subtracted from this equation (the biased three-step total correlation) to yield the bias in total correlations produced by the three-step procedure:
Bias in rThree −StepTXY = ηWX ηWY ( rStartingTXY − rWXY )
(6)
Thus, the starting total correlation will almost always differ from the within-group correlation whenever group differences are present in one or both variables. Far from this being a rare occurrence, nontrivial group differences are quite common in predictor and criterion variables of interest to selection researchers, such as those in our running example (or see the meta-analysis results of Bobko et al., 1999, in Table 1).
Table 1. Meta-analytic estimates of standardized mean differences and correlations for common selection measures (Bobko et al., 1999) Variable
d
1
2
3
4
1. 2. 3. 4. 5.
−1.00 −0.23 −0.09 −0.33 −0.45
.24 .00 .19 .30
.12 .16 .30
.51 .18
.28
Cognitive ability Structured interview Conscientiousness Biodata Job performance
Note: Correlations reflect the total correlation across groups. d = Standardized Black–White mean differences. Total correlations assume that pmin = .20.
We will now examine bias in a specific example taken from meta-analysis, followed by a general example across multiple simulation conditions. Before we venture into these examples, we want to point out that d-values, correlations, and group proportions going into selection simulations (e.g., from meta-analysis or individual studies) have some degree of arbitrariness to them in terms of how precise these values need to be to alter the practical conclusions from a simulation’s results. But arbitrariness should not be confused with imprecision. One hallmark or virtue of simulation is having precise knowledge of its initial conditions, and varying those initial conditions helps remove some of the arbitrariness of any specific set of simulation conditions. Arbitrariness is not the same as imprecision or bias, and the four-step procedure we suggest represents an important yet straightforward step that future researchers can take to eliminate a heretofore unrecognized source of bias in simulation results.
4.2. Example 1: The biased three-step procedure based on meta-analytic data Our first empirical illustration of bias in the three-step procedure is based on the Bobko et al. (1999) metaanalysis that provides the total correlations and standardized mean Black–White differences on a suite of common personnel selection measures (see Table 1); further, we assumed 20% minorities (pmin = .20) and a very large sample (N = 500,000) to estimate bias accurately. The four-step procedure requires the data in Table 1 to estimate between-group etas, within-group etas, and within-group correlations. A quick comparison between Tables 1 and 2 reveals that the estimated within-group correlations were lower than the metaanalytic total correlations whenever two variables showed negative group differences on both variables; this is generally (although not always) expected, given Equation 1a. Table 3 presents total correlations derived from the three-step versus four-step procedures, along with the amount of bias in those correlations when compared with the desired total correlations in Table 1. Table 3 reveals that the four-step procedure resulted in total correlations that were nearly identical to the total cor-
Table 2. Meta-analytic estimates of between- and within-group etas and within-group correlations Variable
ηB
ηW
1
2
3
4
1. 2. 3. 4. 5.
.371 .092 .036 .131 .177
.928 .996 .999 .991 .984
.223 −.014 .154 .256
.117 .150 .290
.510 .177
.254
Cognitive ability Structured interview Conscientiousness Biodata Job performance
Note: Based on Bobko et al. (1999) with pmin = .20. Between-group eta = ηB (Equation 3); within-group eta = ηW (Equation 4). Etas were calculated using d statistics reported in Table 1. Within-group correlations are based on the etas and the total correlation (Equation 2a).
International Journal of Selection and Assessment Volume 22 Number 3 September 2014
© 2014 John Wiley & Sons Ltd
Subgroup Data in Selection Simulations
315
Table 3. Total correlations in the three-step versus four-step simulation procedures: estimated values and amount of bias Variable Three-step procedure 1. Cognitive ability 2. Structured interview 3. Conscientiousness 4. Biodata 5. Job performance Four-step procedure 1. Cognitive ability 2. Structured interview 3. Conscientiousness 4. Biodata 5. Job performance
1
2 .015
.255 .013 .224 .340
.123 .170 .310 −.001
.239 .000 .190 .300
.120 .160 .300
3
4
5
.013 .003
.034 .010 .000
.040 .010 .003 .016
.510 .183 .000 .000 .510 .180
.296 .000 .000 .000
.000 .000 .000 .000
.280
Note: Estimated total correlations are below the diagonal of each block (N = 500,000). Difference in the estimate and the actual total correlation is above the diagonal (i.e., the difference between these correlations and the correlations in Table 1).
relations reported by Bobko et al. (1999), whereas the three-step procedure resulted in correlations that were biased anywhere from approximately .01 and .05 higher than the target total correlations. The greatest levels of bias were observed for those pairs of variables on which the set of mean differences between groups was largest (e.g., cognitive ability and job performance, cognitive ability and biodata). Finally, it is reassuring to report that the amount of bias obtained was the amount predicted by Equation 6, within the limits of rounding error. Note that Equations 5 and 6 assume that the proportion of minorities in the simulated sample (pmin) is the same as the proportion of minorities in the sample underlying the starting total correlation (e.g., a metaanalytic correlation). A researcher may often be interested in varying the proportion of minorities as a feature of the simulation, however, rather than relying only on a single proportion that is reflected in the total correlation. The equations we have shown indicate that the total correlation changes when the proportion of minorities differs – even when mean differences in X and/or Y and the within-group correlations remain constant. Therefore, the value of pmin is a factor contributing to the accuracy of correlations, and to the extent that the assumed pmin in a simulation differs from the actual pmin in the data, this could create simulation inaccuracies. We investigated this possibility by taking meta-analytic data from Table 1 that assume a pmin of .20 and then calculating new estimates for between- and within-group etas (via Equations 3 and 4) using a pmin of .10 or .50 instead. It turns out that the levels of bias when pmin was .10 or .50 were always very small (within .003 correlation units of the bias when pmin was actually .20). Bias in total correlations produced by the three-step procedure appears to be more driven by the magnitude of group mean differences for the pair of variables involved in a correlation (i.e., dx and dy) than by the proportion of minorities in the sample. We still caution that this discrepancy adds unnecessary variance in the estimates from simulation, even if average results are relatively un-
© 2014 John Wiley & Sons Ltd
affected in terms of bias, so modeling simulations with proportions that reflect the actual proportions in a total correlation is recommended.
4.3. Example 2: General conditions for bias in the three-step procedure This example complements the previous one: We examine the phenomenon more closely in the bivariate case, but we also examine a wider array of realistic correlations and conditions that might be encountered in organizational settings. Expanding the terms in Equation 6 reveals that bias in the total correlation using the three-step procedure is a complex nonlinear function of pmin, mean differences on X and Y, and the starting total correlation ( rStartingTXY ). Our simulation results are based on 14,336 conditions that completely cross (1) 4 different levels of proportion of minorities (i.e., pmin ranging from .10 to .40 in increments of .10), (2) 16 different levels of mean differences on X (i.e., dX ranging from 0.0 to 1.5 in increments of .10), (3) 16 different levels of mean differences on Y (i.e., dY ranging from 0.0 to 1.5 in increments of .10), and (4) 14 different levels of starting total correlations (i.e., rStartingTXY ranging from .10 to .75 in increments of .05). First, we examined the descriptive statistics for the bias in the three-step total correlation (i.e., three-step total correlation minus four-step total correlation noted in Equation 6). Mean bias was .03 (median .02), but there was a considerable distribution around this mean (SD = .058) such that this bias could be high or low, depending on the condition being simulated (the central 95% of the distribution of bias ranged from −.04 to .15). To understand the source of variation in bias across conditions, we first regressed the bias in the total correlation across all 14,336 conditions onto (rStartingTXY – rWXY). We started with this difference because it is the key component of Equation 6. Results show that 99% of the variance is driven by this difference, meaning that bias is driven largely by the size of the difference between the
International Journal of Selection and Assessment Volume 22 Number 3 September 2014
316
Frederick L. Oswald, Patrick D. Converse and Dan J. Putka
Table 4. Predicting bias in the three-step procedure: hierarchical linear regression + Block 2
Block 1
int rw
B
SE
ΔR2
.09 −.15
(.001) (.002)
.40
R2 =
.40
int rw dx dy pmin
+ Block 3
B
SE
−.01 −.12 .05 .05 .07
(.001) (.001) (.001) (.001) (.002)
R2 = ΔR2 =
.72 .32
ΔR2
.15 .15 .02
int rw dx dy pmin d2x d2y p2min dxdy
B
SE
.01 −.11 .02 .02 .16 −.04 −.04 −.18 .11 R2 = ΔR2 =
(.001) (.001) (.001) (.001) (.007) (.001) (.001) (.014) (.001) .91 .19
ΔR2
.01 .01 .00 .17
Note: N = 14,336 cases. All regression coefficients are unstandardized values, accompanied by standard errors in parentheses; regression coefficients, R2 and ΔR2 are all statistically significant (p < .0005). The ΔR2 columns indicate the amount of variance predicted if the given term is taken out of that step of the hierarchical regression and then entered by itself in the final step.
starting total correlation that is incorrectly used in the three-step procedure as a within-group correlation, versus the correct within-group correlation that is calculated in the four-step procedure based on the starting total correlation. Although this finding is consistent with our expectations, it does not help us understand the degree to which bias might vary as a function of pmin and the magnitude of group differences on X and Y – the factors that underlie rStartingTXY and therefore (rStartingTXY – rWXY). To help separate out these effects, first recognize that the value of rStartingTXY is itself based on rWXY (see Equation 1a and 2b). Substituting Equation 1b or 2b into Equation 6, and assuming the group mean differences in X and Y are in the same direction (i.e., rBXY is positive), the equation for bias can now be expressed as a linear function of rWXY and a nonlinear function of cx and cy, namely,
Bias in Simulated rThree − StepTXY = 1 rW ⎡1 − ( c X + 1) ( cY + 1) ⎤⎦ + c X cY (c X + 1) (cY + 1) XY ⎣
{
} (7)
Therefore, a hierarchical linear regression could first enter rWXY as a predictor of variance in the bias, and then enter components of c to determine whether they provide practically and statistically significant levels of incremental validity in the model. We also provide the amount of incremental validity that a particular variable or interaction term provides, above and beyond all other variables and interaction terms included at the same step of the regression (i.e., as if that variable were entered alone in a subsequent final step of the regression). Other common methods of determining the relative importance of predictors in regression models, such as importance weights (Fabbris, 1980; Genizi, 1993; Johnson, 2000) or dominance analysis (Azen & Budescu, 2003), cannot handle interaction
International Journal of Selection and Assessment Volume 22 Number 3 September 2014
terms, so we view the hierarchical regression approach as entirely reasonable given the purpose at hand. Note that the components of c in the simulation (dx, dy, and pmin) are completely crossed, so they have zero correlation with one another, and they also have a low correlation with rWXY across conditions examined (magnitudes are < .15). Thus, multicollinearity is not a serious issue if one were to interpret regression weights for the main effects. Results from this analysis (Table 4) indicate that in Block 1, the value of rWXY alone predicts 40.3% of the bias in the three-step total correlation (R2 = .40), such that lower values of the within-group correlation predict a larger amount of bias in the total correlation. In Block 2 of the hierarchical regression, values of dx, dy, and pmin were added, predicting an additional 31.6% of the variance (i.e., R2 = .72, or 71.9% of the total variance in bias). The incremental validity of each variable at this step indicates that the mean differences in X and Y predicted unique variance in bias much more than the minority proportion of the population. In Block 3, dxdy and the squared terms of dx, dy, and pmin were included, as these squared terms are implied by Equation 7. This step predicted yet another 19.2% of the variance in bias (i.e., R2 = .91, or 91.1% of the total variance in bias). However, the incremental validity of each variable in this step revealed that dxdy was the major factor in predicting unique variance in bias compared with the other terms (ΔR2 = .17 compared with .01 or less). In other words, increased bias was associated with larger group mean differences on both X and Y at the same time, above and beyond their independent effects; this finding is consistent with Equation 2b, where dx and dy values are multiplied together as a complex function of cx and cy values, respectively. From these results, we can conclude that although the equation for bias is a fairly complex nonlinear func-
© 2014 John Wiley & Sons Ltd
Subgroup Data in Selection Simulations
317
0.2
0.2
0.1
0.1
Bias
0.3
0.0
0.0
–0.1 1.5
0.0 0.5
1.0 0.0
1.5
pmin = .10
0.0
pmin = .20
0.3
0.2
0.2
0.1
0.1
Bias
0.3
Bias
0.5
1.0 dx
dx
1.5
1.0
0.5
dy
0.5
1.5
0.0
1.0
dy
–0.1
0.0
0.0
–0.1
–0.1 1.5
0.0 0.5 dx
1.5
0.0
pmin = .30
1.5
0.0
1.0
0.5
0.5
1.0 dx
0.5
1.0
dy
1.0
1.5
dy
Bias
0.3
0.0
pmin = .40
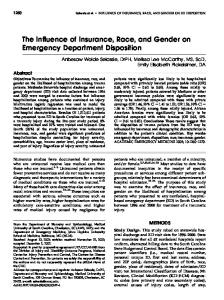
Figure 2. Bias in the total correlation based on minority proportions and mean differences in X and Y. Note: Bias is the bias in the total correlation; dx is the group mean differences in X; dy is the group mean differences in Y. Each surface is symmetric about the line dx = dy, curving downward ‘into’ the surface of the page; surfaces are presented at this side angle to more clearly illustrate the variation in bias and its nonlinear form. Shading is graded uniformly across the range of within-group correlation, with lighter dots representing lower values. Within-group correlations range from −.39 to .93 (the central 95% distribution ranges from .00 to .75).
tion of group mean differences, the within-group correlation, and the proportion of the minority group, a linear regression model with multiplicative terms predicts a large portion (over 90%) of the three-step bias in the total correlation, given a range of realistic conditions found in organizational research. The value of the within-group correlation has a sizable impact on the expected bias in the total correlation, as do the magnitudes of the group mean differences, both independently and in combination with one another. The minority proportion, as a main effect and a squared term, predicted very little variance in the bias of the three-step procedure, above and beyond these other effects. Thus, even without knowing pmin, a relatively simple formula can predict the amount of bias to be expected from past simulations.
© 2014 John Wiley & Sons Ltd
To complement and extend these results, we provide three-dimensional plots of the bias of the three-step procedure across simulated conditions. Each panel in Figure 2 shows bias in the total correlation on the Z axis (labeled ‘bias’) and group mean differences on the X (‘dx’) and Y (‘dy’) axes. Each panel represents 10–40% minority representation (pmin = .10–.40), and across panels, bias is scaled in the same manner to allow for greater comparability. More darkly shaded data points reflect larger values of the within-group correlations; shading is graded uniformly across their range, from −.39 to .93. For the best visualization of relationships, the graph is displayed from the side view of a curved symmetric surface, meaning that as one moves toward the back of the curve, it moves up and ‘into’ the page, and then the surface curves downward. These plots succinctly reflect
International Journal of Selection and Assessment Volume 22 Number 3 September 2014
318 and add to the previous regression results by illustrating how (1) the effects of bias are nonlinear; (2) the size of the within-group correlation affects the bias; (3) larger mean differences on X and Y are associated with larger amounts of bias, especially when the differences are large on both variables (e.g., along the ridge of the curved surface); and a fourth finding not revealed by regression that (4) the variance of the bias across conditions increases when there is a larger proportion of minorities in the sample. As a final way to examine the bias between the threestep and four-step procedures, we applied different thresholds of practical significance to determine the extent to which bias is important across conditions, because different selection simulations and contexts may suggest different levels of bias being practically significant. If an absolute bias of .10 correlation units or greater were to be viewed as important, then 13.0% of the conditions are considered biased to a significant degree. If the standard is .08 instead, that percentage becomes 19.1%, and if it is .05 it becomes 34.0%. If variance in the parameters that contribute to bias are either expanded or restricted, then obviously these percentages will change, but generally, we have demonstrated that bias exists to varying extents across realistic selection simulations, and we offer a simple four-step method to prevent this bias entirely in future simulation efforts.
5. Discussion Although our running example focused on race– ethnicity differences, the general simulation issue is applicable to other types of group differences as well – such as gender-based differences and age-based differences – both of which are very salient to selection researchers and practitioners in light of US employment laws (e.g., Title VII of the 1964 Civil Rights Act; Age Discrimination in Employment Act of 1967). The current paper is useful because computer simulation of subgroups in personnel selection is an informative approach for understanding selection phenomena: the assumptions and parameters of a selection model are explicit and subject to scrutiny; furthermore, parameters can be manipulated to best mirror a wide array of real-world organizational selection scenarios and to test for model sensitivity and generalizability. Our paper points to a specific and common problem in the type of simulations that personnel selection researchers develop when investigating the influence of group differences on simulation results for adverse impact, test score banding, predictor or criterion weighting, or multistage selection systems. The problem deals with accurately modeling group–mean differences and total correlations simultaneously. The three-step ap-
International Journal of Selection and Assessment Volume 22 Number 3 September 2014
Frederick L. Oswald, Patrick D. Converse and Dan J. Putka proach that has been adopted in past simulations is almost universal; however, it ignores the multilevel nature of the data, and the total correlations that these simulations intend to specify are almost certainly biased after group mean differences are incorporated into the simulation. We present these formulas for bias in the three-step procedure and then go beyond the formulas to demonstrate the amount of biasing effects that result when this problem goes unaddressed, first providing a specific example, and then exploring the general issue across a wide variety of selection conditions. Results clearly indicate that total correlations were particularly biased in the three-step procedure when between-group means were high and within-group correlations were low (see Table 4 and Figure 2), and they were less biased otherwise. Three points regarding this pattern of results should be noted. First, we did not model sampling error variance, which creates variability in statistical estimates and is present in any statistical procedure that involves finite random samples. Calculating the four-step procedure versus the three-step procedure across a large number of random samples for each condition could be used to compare the bias in the corrected estimates with respect to the variance in the corrected estimates. Our demonstration was to focus on bias and show that it is removed by the four-step procedure in all cases, improving the accuracy of selection simulations of this sort. Second, the bias in many of these realistic situations was considered practically significant across different and reasonable standards we set. Even when the practical significance of the expected bias could be low for a specific simulation (or local validation study on which a simulation is based) the actual bias may not be predictable. This may be either for substantive reasons (e.g., the multivariate conditions of a simulation) or for statistical reasons (e.g., the local validity estimates used for simulation are themselves biased because of sampling error variance). When substantial variability exists in the possible outcomes of a simulation or validity study, then that variability may overlap with specific conditions that we found to be biased to a practically significant extent. All of this is to suggest that conducting the new four-step procedure in all simulations of correlations with group differences is the safest way to avoid problems with estimation bias in all cases. Third, this pattern of findings has implications for differential bias across a set of total correlations, as was found in our first example borrowed from a metaanalysis. Although our meta-analysis example did not explore specific applications such as the effects of predictor weighting or validity-adverse impact trade-off for various predictor combinations, consider the fact that the total correlation between cognitive ability and job performance was more positively biased from the
© 2014 John Wiley & Sons Ltd
Subgroup Data in Selection Simulations three-step procedure than was the correlation between structured interviews and job performance (Table 3). A practitioner faced with judgments about maximizing validity and minimizing adverse impact in this situation might conclude that, relative to structured interviews, there is a somewhat greater trade-off between validity and adverse impact when a cognitive ability measure is used as a predictor than there is in reality. In other words, the bias we have demonstrated from the threestep procedure does not impact the intercorrelations and criterion-related validity for all predictors equally; therefore, when using multiple predictors in selection, this differential bias will potentially distort all indices used to compare the relative merits of predictors (such as validity-adverse impact tradeoffs or differential predictor weights; Sackett, De Corte, & Lievens, 2010), and that in turn may distort the practical decisions that result. Fortunately, we presented the four-step simulation as a direct and simple solution to these problems arising from the traditional simulation approach, demonstrating that its results are unbiased and consistent with its assumptions. Given the topic of this paper and its findings, we recommend that future research continue along several fronts. First, our findings might be extended to more complex cases (e.g., modeling differential validity and reliability across groups) and perhaps to team-based simulations that might have also ignored the effect of group mean differences on total correlations (e.g., training using teams; multi-team dynamics; team contributions to organizational outcomes). Multilevel research in organizations has long pointed out that ignoring phenomena at one level can lead to a conceptually deficient and statistically biased model (Bliese & Ployhart, 2002; Moerbeek, 2004; Ostroff, 1993), and this is true for simulations as much as for field- or laboratory-based research designs. Second, we have cited many simulation studies across areas of personnel selection, where in nearly all cases, the data generation method was the three-step procedure we described. There were also cases where the technique was not explained in sufficient detail, and we are not sure if something other than the three-step procedure was used. Our four-step solution does address the deficiency of the three-step solution directly; it is simple, understandable, and usable, allowing any personnel selection simulation researcher to apply this recommended improvement. Although we believe that the biases of past selection simulations are generally not large enough to weigh against the practical conclusions they offer, future researchers and practitioners could implement the formulas we have provided and estimate the bias of specific selection simulations of the past. Third, future extensions of our work in this area could take into account the role of psychometric artifacts such as measurement unreliability and range restriction, artifacts that receive a wealth of attention in
© 2014 John Wiley & Sons Ltd
319 the psychometric meta-analysis literature (Hunter & Schmidt, 2004) but receive less attention within individual studies and simulations. These artifacts are often assumed to operate similarly across groups, but future work could examine the extent to which differential reliability and range restriction occur and affect simulation results. Another extension could examine the contribution of mean and correlational differences across more than two racial or cultural groups, or across differences in groups reflecting both race and gender. Even distributional deviations from normality (Micceri, 1989), and distributional differences between subgroups could be examined. Continued work along all these lines could boost the confidence we can have in applying personnel selection simulation results to a demographically diverse workforce.
Notes 1.
Note that the standard notation for the standardized X − X White . A d value is theremean difference is d = Black spooled fore negative whenever the Black mean is lower than the White mean. Although the literature can be inconsistent on this point, we will maintain this standard throughout the text. Also note that other values could, of course, be chosen for these parameters (e.g., the meta-analysis by Roth, Switzer, Van Iddekinge, & Oh, 2011 that examines job complexity as a moderator of validities). We chose these values simply because they provide a straightforward illustration of the multilevel simulation problem, using widely cited values that were available in past simulation studies. We also explore results across a wide range of other parameter values in later sections. 2. Note that this equation assumes the within-group correlation is the same between groups. There is actually a wide range of within-group correlation pairs (rmin, rmaj) that fit any within-group correlation. Also note that some values of proportions are impermissible once the other values of the equation are fixed.
References Age Discrimination in Employment Act of 1967 (ADEA). 29 U.S.C. §§ 621–634 (2000). Azen, R., & Budescu, D. V. (2003). The dominance analysis approach for comparing predictors in multiple regression. Psychological Methods, 8, 129–148. Bliese, P. D., & Hanges, P. J. (2004). Being both too liberal and too conservative: The perils of treating grouped data as though they were independent. Organizational Research Methods, 7, 400–417. Bliese, P. D., & Ployhart, R. E. (2002). Growth modeling using random coefficient models: Model building, testing and illustrations. Organizational Research Methods, 5, 362–367. Bobko, P., Roth, P., & Potosky, D. (1999). Derivation and implications of a meta-analytic matrix incorporating cognitive
International Journal of Selection and Assessment Volume 22 Number 3 September 2014
320 ability, alternative predictors, and job performance. Personnel Psychology, 52, 561–588. Civil Rights Act of 1964 § 7. 42 U.S.C. § 2000e et seq (1964). Dansereau, F., Alluto, J. A., & Yammarino, F. J. (1984). Theory testing in organizational behavior: The variant approach. Englewood Cliffs, NJ: Prentice Hall. De Corte, W., & Lievens, F. (2003). A practical procedure to estimate the quality and the adverse impact of single-stage selection decisions. International Journal of Selection and Assessment, 11, 89–97. De Corte, W., Lievens, F., & Sackett, P. R. (2006). Predicting adverse impact and mean criterion performance in multistage selection. Journal of Applied Psychology, 91, 523–537. De Corte, W., Lievens, F., & Sackett, P. R. (2007). Combining predictors to achieve optimal trade-offs between selection quality and adverse impact. Journal of Applied Psychology, 92, 1380–1393. Doverspike, D., Winter, J. L., Healy, M. C., & Barrett, G. V. (1996). Simulations as a method of illustrating the impact of differential weights on personnel selection outcomes. Human Performance, 9, 259–273. Dunleavy, E. M., Stuebing, K. M., Campion, J. E., & Glenn, D. A. (2008). Using the 4/5ths rule as an outcome in regression analyses: A demonstrative simulation. Journal of Business and Psychology, 23, 103–114. Fabbris, L. (1980). Measures of predictor variable importance in multiple regression: An additional suggestion. Quality and Quantity, 4, 787–792. Finch, D. M., Edwards, B. D., & Wallace, J. C. (2009). Multistage selection strategies: Simulating the effects on adverse impact and expected performance for various predictor combinations. Journal of Applied Psychology, 94, 318–340. Ford, J., Kraiger, K., & Schechtman, S. (1986). Study of race effects in objective indices and subjective evaluations of performance: A meta-analysis of performance criteria. Psychological Bulletin, 99, 330–337. Genizi, A. (1993). Decomposition of R2 in multiple regression with correlated regressors. Statistica Sinica, 3, 407–420. Hattrup, K., & Rock, J. (2002). A comparison of predictorbased and criterion-based methods for weighing predictors to reduce adverse impact. Applied H.R.M. Research, 7, 22–38. Hattrup, K., Rock, J., & Scalia, C. (1997). The effects of varying conceptualizations of job performance on adverse impact, minority hiring, and predicted performance. Journal of Applied Psychology, 82, 656–664. Hitt, M. A., Beamish, P. W., Jackson, S. E., & Mathieu, J. E. (2007). Building theoretical and empirical bridges across levels: Multilevel research in management. Academy of Management Journal, 50, 1385–1399. Hunter, J. E., & Hunter, R. (1984). Validity and utility of alternative predictors of job performance. Psychological Bulletin, 96, 72–98. Hunter, J. E., & Schmidt, F. L. (2004). Methods of meta-analysis: Correcting error and bias in research findings. Thousand Oaks, CA: Sage. Jensen, A. (1980). Bias in mental testing. New York: Free Press. Johnson, J. W. (2000). A heuristic method for estimating the
International Journal of Selection and Assessment Volume 22 Number 3 September 2014
Frederick L. Oswald, Patrick D. Converse and Dan J. Putka relative weight of predictor variables in multiple regression. Multivariate Behavioral Research, 35, 1–19. Laczo, R. M., & Sackett, P. R. (2004). Effects of banding on performance and minority hiring: Further Monte Carlo simulations. In H. Aguinis (Ed.), Test-score banding in human resource selection: Technical, legal, and societal issues (pp. 133– 150). Westport, CT: Praeger Publishers. McIntyre, R. M. (1990). Spurious estimation of validity coefficients in composite samples: Some methodological considerations. Journal of Applied Psychology, 75, 91–94. Micceri, T. (1989). The unicorn, the normal curve, and other improbable creatures. Psychological Bulletin, 105, 156–166. Moerbeek, M. (2004). The consequence of ignoring a level of nesting in multilevel analysis. Multivariate Behavioral Research, 39, 129–149. Ostroff, C. (1993). Comparing correlations based on individual-level and aggregated data. Journal of Applied Psychology, 78, 569–582. Oswald, F. L., Saad, S., & Sackett, P. R. (2000). The homogeneity assumption in differential prediction analysis: Does it really matter? Journal of Applied Psychology, 85, 536–541. Ree, M. J., Carretta, T. R., & Earles, J. A. (1999). In validation sometimes two sexes are one too many: A tutorial. Human Performance, 12, 79–88. Robinson, W. S. (1950). Ecological correlations and the behavior of individuals. American Sociological Review, 15, 351– 357. Roth, P. L., Bobko, P., & Switzer, F. S. (2006). Modeling the behavior of the 4/5ths rule for determining adverse impact: Reasons for caution. Journal of Applied Psychology, 91, 507– 522. Roth, P. L., Bobko, P., Switzer, F. S., & Dean, M. A. (2001). Prior selection causes biased estimates of standardized ethnic group differences: Simulation and analysis. Personnel Psychology, 54, 591–617. Roth, P. L., Switzer, III, F. S., Van Iddekinge, C. H., & Oh, I.-S. (2011). Toward better meta-analytic matrices: How input values can affect research conclusions in human resource management simulations. Personnel Psychology, 64, 899– 935. Sackett, P. R., De Corte, W. D., & Lievens, F. (2010). Decision aids for addressing the validity-adverse impact trade-off. In James L. Outtz (Ed.), Adverse impact: Implications for organizational staffing and high stakes selection. SIOP Organizational Frontiers series (pp. 453–472). New York: Routledge/ Taylor & Francis Group. Schmidt, F. L., Pearlman, K., & Hunter, J. E. (1980). The validity and fairness of employment and educational tests for Hispanic Americans: A review and analysis. Personnel Psychology, 33, 705–724. Schmitt, N., & Oswald, F. L. (2004). Statistical weights of ability and diversity in selection decisions based on various methods of test-score use. In H. Aguinis (Ed.), Test-score banding in human resource selection: Technical, legal, and societal issues (pp. 113–132). Westport, CT: Praeger Publishers. Simon, C., & Blume, L. (1994). Mathematics for economists. New York: W. W. Norton & Company.
© 2014 John Wiley & Sons Ltd