special algorithms for collecting peers' reputation values in the. P2P network. P2PRep (reputation) schema [3] and TrustMe approach [14] introduce a distributed ...
Trust Framework for P2P Networks using Peer-Profile based Anomaly Technique Natalia Stakhanova∗ Samik Basu∗ ∗ Department of Computer Science Iowa State University Ames, IA 50011 USA {ndubrov, sbasu, wong}@iastate.edu
Oleg Stakhanov∗∗ Johnny Wong∗ ∗∗ Department of Sociology Iowa State University Ames, IA 50011 USA {ostakha}@iastate.edu
Abstract
not be flagged as suspicious by reputation mechanism. However, these are the signs of radical and possibly abnormal behaviour of the peer. Accounting for these signs maybe crucial for choosing reliable partner for communication. One of the intuitive ways to capture such suspicious signs is to consider current peer’s actions within its usual behavior. Anomaly detection technique can be effectively applied here. Traditionally, anomaly detection approach is used for an intrusion detection purposes. However, in reputation model setting we apply it to expose suspicious behavior, which is unusual based on the established normal profile, but is not necessarily intrusive. Such behavior would rather be an indication of instability and therefore unpredictability of a peer. Translating this into reputation setting, less reputable peer is less likely to behave in a predictable fashion and, consequently, less trustworthy in communication. In this paper, we propose to apply anomaly detection algorithm in the setting of P2P environment. The central tenet of our approach is that peer-profile based anomaly detection provides enhancement to reputation-based trust management. In light of this, the main contributions of our work can be summarized as follows:
Popularity of peer-to-peer (P2P) networks exposed a number of security vulnerabilities including the problem of finding reliable communication partners. In this paper, we present an integrated trust framework for P2P networks that quantifies the trustworthiness of a peer using reputation-based trust mechanism and anomaly detection technique. We describe anomaly detection procedure that analyzes peer activity on the network and flags potentially malicious behavior by detecting deviation from peer profile. We study the performance of our trust framework using simulation and compare it with the existing reputation-based system which does not employ an anomaly detection mechanism.
1 Introduction Recent years have seen a tremendous growth of P2P networking paradigm on ubiquitous computing in the form of popular P2P file-sharing systems like Napster [12], Gnutella [16] and KaZaA [8]. However, widespread and unrestricted deployment of P2P systems exposed a number of security vulnerabilities and directed major research efforts toward ensuring secure and trustworthy communication between peers in a P2P environment. In this context, reputation-based techniques have emerged as a natural choice to identify trusted peers and isolate the untrusted ones. Though promising, reputation-based techniques may potentially fail to accurately capture a peer’s behavior. Specifically, they often lack global view of peer’s behavior making decision regarding reputation updates based on current actions only. Majority of the existing reputation-based approaches focus on the known traces of abnormal behavior in current peer’s actions. Thus, for instance, sudden download of system file instead of the usual mp3 file [1] or multiple short connections due to the user change on the P2P client will
• Integration peer profile-based anomaly technique to trust management . Peer-profile based anomaly detection provides an extra dimension for computing peer-reliability. To the best of our knowledge, this is the first effort for integrating anomaly technique for computing reputation in the domain of trust management. • On-line reputation computation. In our framework, peer’s reputation is updated while it is in session and also at the end of the session. • Flexibility of trust framework. The framework is designed and developed in a modular fashion. • Application of this technique to P2P networks. We use the framework in the domain of P2P networks and show the effectiveness of our technique via simulation. 1
2 Related Work
detection relies on flagging suspicious and therefore potentially malicious peer activity by detecting deviations of peer behavior from its normal profile. In our framework, anomalous peer behavior affects its trust value in two phases: (a) once at the end of the session and (b) at user predefined regular intervals during the session. While the former update gives a global view of the peer’s reliability, the latter is required to update trust scores on-the-fly so that malicious activity does not go un-noticed while in session.
In this section, we briefly outline the techniques related to our work.
2.1 Identifying peer trustworthiness Current research efforts to identify trustworthy peers on P2P network have mainly focused on trust management techniques. Majority of approaches presented in this area employ special algorithms for collecting peers’ reputation values in the P2P network. P2PRep (reputation) schema [3] and TrustMe approach [14] introduce a distributed protocol which allows peers to access reputation of potential resource providers before initiating a download. If the above approaches allow peer to maintain reputations of other peers it had dealt with in the past, the approach presented by Gupta et al. [7] tracks each peer’s own contribution to the system using a debit-credit mechanism.
3.1 Reputation-based trust mechanism Our approach is built on the reputation-based trust management schema proposed by Stakhanova [15]. The central idea of the approach is to assess the reputation of the peer before making decision about accepting or sending traffic to it. The reputation value (trust score) is calculated based on four factors (actions): resource search, resource upload, resource download and traffic extensiveness. Depending on the outcome, action can be considered bad (if it failed) such as download of damaged file or good (if it succeeded). Trust score of peer i (Ri ) at specified time period is defined as a percentage of bad actions (BAi ) performed by the peer at that given time period and calculated as follows:
2.2 Profiling and anomaly detection User profiling is a well known technique that originally was used for intrusion detection by Denning [5]. She described a rule-based intrusion detection model that monitors users’ activity logs and reports detected abnormal patterns. Most of the research efforts in the area of user profiling have been focused on Unix operating systems [4, 9, 10]. In particular, the work done by Dao [4] concentrated on monitoring user activity using login time, host information and user command sequences. Concepts related to profiling, as well as some dependencies of user profiles, have been discussed but overall the work was exploratory and only sought to provide a basis for future research. Further steps in this direction were taken by Lane and Brodley [9]. They used data mining techniques to perform anomaly detection over user profiles formed using shell commands. Approach proposed by Marin and el. [10] also employed data mining algorithms to expose possible system intrusion based on the established user profiles. The profiles were generated based on the number and types of commands users entered in Unix environment. Anomaly detection technique as a tool for intrusion detection have been studied by many researchers. Portnoy [13] and Eskin [6] explored algorithms for unsupervised anomaly detection over real network data.
Ri = 100 ∗ BAi /T Ai where T Ai denotes total number of actions by peer i. Traffic from a peer is accepted or rejected depending on its trust score and trust threshold scale of the (host) peer calculating its reputation. Two thresholds x1 and x2 represent host peer’s trust policy, where x1 indicates the distrust value, peers with trust score above this value are distrusted, and consequently no traffic is accepted from them. x2 denotes full trust, peers with trust score below this value are considered trustworthy and, therefore their traffic can be fully accepted. If trust score falls between these thresholds average trust is assigned to a peer and only part of its traffic is accepted. This trust schema allows a peer on the network to evaluate traffic from other peers and dynamically update their reputation values.
3.2 Peer profiling A peer profile is a collection of information that establishes the user’s typical behavior on the P2P network. In this work, we assume that profiles of normal behavior are available and gathered in a trustworthy manner which can be archieved through maintainance of generic system profile or generation of profiles in controlled environment. However, the specific approaches to establishing and maintaining up-to-date profiles of normal behaviour are currently under investigation. We identify six features to characterize peer behavior in P2P framework. These features can be broadly classified into
3 Proposed approach In this paper, we present an integrated framework that quantifies the trustworthiness of a peer via reputation-based trust mechanism and anomaly detection technique. Anomaly 2
two groups reflecting the temporal behavior and the network activity of each peer respectively.
We calculate these metrics for each peer profile to obtain full descriptions of the data sets. Based on these calculations we can determine how far the anomalous data is from the normal data mean and measure this distance in standard deviations. Since about 89% of data are at most three standard deviations away from the mean, we will consider data beyond the range of three standard deviations.
1. Temporal features: (a) connection time, (b) connection duration 2. Network activity: (a) number of search requests, (b) number of file downloads and (c) number of file uploads during connection these parameters characterize the level of user activity on the network and the activity itself. (d) number of bytes uploaded by a peer - provides indication of the nature of information being uploaded(system files, multimedia, etc.).
{x1 , .., xi , ..xn } an anomalous session data,where xi,i=1..n are the peer profile features {M1 , ..., Mi , ..., Mn } mean values of profile data set {stdDev1 , ..., stdDevi , .., stdDevn } standard deviations values of profile data set
The information concerning the above features is collected for each peer throughout its online session and is referred to as peer’s session data.
Formally, we define Distance (Disti ) as number of standard deviations xi lies from the mean value Mi . Disti = ((|xi − Mi |)/stdDevi ) − 3
3.3 Anomaly detection
The degree of anomaly is calculated for the entire session data based on the feature distances and will indicate the total deviation of the session from the normal behavior. Let Dap be a degree of anomaly of peers p session data and n be a number of features, then
In general, anomaly detection techniques build a model through training data and then detect deviations in new data sets. Anomaly detection in the setting of reputation-based trust management is being applied to expose unusual and/or unpredictable peer activity. In this context, we define anomaly as any event that does not fit the normal behavioral profile of the peer and is, thus, indicative of its unpredictablity and unreliability. There are two approaches to anomaly detection based on data mining techniques: supervised and unsupervised learning. In our trust framework we will employ unsupervised algorithm. Anomaly detection component in our framework performs two main functions. First, it analyzes a peer’s session data to reveal hidden abnormal information using anomaly detection algorithm. Second, if the data is established as anomalous it determines the degree of anomaly and estimates amount of changes to be done to the peer’s reputation score. Analysis of peers session data was performed using oneclass support vector machine (SVM) algorithm from libsvm [2]. We determine the degree of anomaly for the peer’s session data based on the two most commonly used statistical metrics: mean and standard deviation. Mean indicates the central tendency of the data, while standard deviation provides a measure of variability of the data. Since we cannot guarantee the normal distribution of the data1 we use these metrics according to the Chebyshev’s rule, which can be applied independent of the distribution. According to this rule, at least 1 − k12 of data points will fall within k standard deviations from the mean [11]. As such majority of data, at least 89%, falls within three standard deviations from the mean.
n
Dap =
1� Disti n i=1
where Disti > 0. The final step in the anomaly detection procedure is to determine the change in the trust score depending on the calculated degree of anomaly for the anomalous session and anomaly thresholds. We establish two anomaly thresholds AT h1 and AT h2 that indicate the level of anomaly acceptable by a peer. Since we only consider data lying beyond the range of three standard deviations, anomaly thresholds are intended to determine how big the deviation is from this cut-off point. The corresponding reputation update is presented as follows. Da < AT h1 AT h1 < Da < AT h2 AT h2 < Da
Bad actions value is incremented by b0 2 Bad actions value is incremented by b1 Bad actions value is incremented by b2
Peers session data is evaluated at the end of its session as well as during the session. While peer is online, its feature values are monitored for deviations from the profile data at regular user-predefined intervals (checkPeriod). If deviation occurs, features are analyzed against peer profile by anomaly detection algorithm.
1 Data distribution often depends on a particular user behavior which can be radical and unstable.
2 Parameters
3
b0 ,b1 ,b2 can be configured by system administrator.
4 System design and implementation
4.1 Data sets As a preliminary step, we generated data sets using the user-profile based peer-to-peer simulator for five peers. Each peer’s data set was split into two sets: train and test data sets. Both data sets were normalized with normalization tool in libsvm. Anomalous instances were generated by changing the configuration parameters of the simulator. The configuration parameters include original settings for peers’ profiles such as connection time, connection duration, number of query requests and number of uploaded bytes. During simulation initial feature values were modified based on uniform random distribution within a range specified for each peer’s profile. To generate abnormal data instances based on the normal initial configuration parameters we use standard deviation value of the train data sets by increasing each of the specified parameters by four standard deviations.
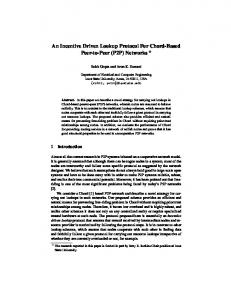
Our framework (Figure 1) is comprised of two main components: the user-profile based peer-to-peer simulator and an anomaly detector. The core of the system is 3LSimulator, a generic peer-to-peer simulator supporting Gnutella protocol v.4.0 [16]. It is modified to simulate peer behavior and capture necessary information about peers during their sessions into the log file. The simulator also includes a reputation-based trust management mechanism employed in our framework.
User-profile based 3LSimulator with anomaly detector
Configuration file Anomaly Detector
3LSimulator with reputation-based trust manager
Anomaly Monitor
4.2 Experiments FormatSVM
We evaluated our framework on a completely connected network of five peers. To evaluate the effectiveness of anomaly detection procedure to reflect trust scores of peers on the network we conducted the experiments in five scenarios: change of connection time, connection duration, number of query requests, number of uploaded bytes and change of all mentioned features. These scenarios were run in two modes: full mode that represented our trust framework with anomaly detection and trust mode that included reputation-based approach that we employed in the framework without anomaly detection mechanism. We present our results in two parts. First, we analyze the effectiveness of the trust framework for all peers on average. Then we look at the particular peer’s trust score patterns.
Log File SVMpredict
{peerIP, BA, total} AnomalyAnalyser Reputation Manager
Reputation repository {peerIP, BA}
Figure 1. Framework architecture.
Upon termination of all peers connections, the log file is written to disk and then analyzed by the Anomaly Detector module, which contains three main parts, namely, FormatSVM, SVMpredict and AnomalyAnalyser. FormatSVM normalizes log data and converts it to a svm format which is then evaluated by SVMpredict using libsvm tool. The output of SVMpredict is analyzed by AnomalyAnalyser to determine if the log records are anomalous and, if so, the degree of anomaly. Based on the anomaly degree, request to update a trust score containing peers IP address and number of BA is sent to Reputation Manager. In addition to these modules, framework includes Anomaly Monitor component whose main function is to determine possible anomalies in peers activities while the peers are online.
4.2.1 General results This first set of the results in Figures 2, 3, 5, 4 shows average trust score value of the peers in the system. Parameters ’connection time’, ’connection duration’ and ’number of uploaded bytes’ are not considered in the trust score calculation in the trust mode, therefore, as we expected, trust score in those experiments remains the same. However, in the full mode we see that trust score takes different patterns which reflect deviation in the peers behavior from their profiles. It is interesting to note that even though by averaging trust score we negate the effect of trust score changes of some peers, the full mode always reflects changes in peers’ behavior better than trust mode alone.
Anomaly Monitor periodically examines behavior of connected peers to identify deviations from normal peer behavior. If such deviations are found, the peer session data is transferred to Anomaly Detector to determine if anomaly exists and to request a reputation update for the peer.
4.2.2 Specific patterns As the experimental results showed, all peers displayed similar patterns, therefore, for brevity we only present representative 4
full mode
trust mode
7
3
6
2.5
5
Trust score
Trust score
full mode 3.5
2 1.5
trust mode
4 3
1
2
0.5
1 0
0 0
20
40
60
80
0
100
20
40
Time steps
Figure 2. Effect of changing ’connection time’ parameter.
full mode
60
80
100
120
Time steps
Figure 3. Effect of changing ’connection duration’ parameter.
full mode
trust mode
trust mode
20
8
18
7
16 14
5
Trust score
Trust score
6
4 3
12 10 8 6
2 4 1
2
0
0 0
20
40
60
80
100
0
Time steps
Figure 4. Effect of changing ’number of uploaded bytes’ parameter.
20
40
60
80
100
Time steps
Figure 5. Effect of changing ’number of requests’ parameter.
trust score patterns from one peer’s view on its neighboring peers.
the current actions. This abnormal behavior is detected later in the session when peers exchanged queries and determined nodes to upload desired files.
1. Change of ’connection time’ parameter (Figure 6): Deviation due to unusual connection time can be detected at the beginning of the peer session. Depending on the abnormality of this feature initial increase of trust score can be more or less rapid. After this increase, if no other deviations from the peer’s profile are detected throughout the session, peer’s trust score decreases. Rate of decrease depends on subsequent peer’s behavior, the better its behavior the faster its trust score decreases.
4. Change of ’number of query requests’ parameter: Figures 9, 10 show the impact of number of query requests on the trust score in full and trust modes. In the trust mode this parameter is not considered in the trust score computation. However, increased number of queries may result in the extensive traffic and therefore, can effect the trust score computation through traffic extensiveness factor. On the other hand, equal increase in the number of requests might create approximately equal amount of traffic and not be reflected in the trust score. This can potentially be used by malicious peers conspired to damage a victim node. Meanwhile, full mode is able to detect an unusual behavior. If large number of requests is distributed throughout a peer’s session then full mode keeps the trust score high. However, if the requests are more localized and anomaly detection does not see continuous increase in the traffic then effect of trust score increase by full mode is negated by the total number of actions. In other words, if a peer starts session with a ma-
2. Change of ’connection duration’ parameter (Figure 7): We see similar results for ’connection duration’ parameter change. Note that, abnormal connection duration is visible only if peer stays online longer than its normal time or disconnects much earlier than usual. 3. Change of ’number of uploaded bytes’ parameter (Figure 8) : Number of uploaded bytes is also not considered in trust mode, therefore changes in this feature does not impact peer trust score. Full mode, as we expected, shows detected deviation from the peer profile in 5
full mode
trust mode
1.8
4
1.6
3.5
1.4
3
1.2
Trust score
Trust score
full mode 4.5
2.5 2
trust mode
1 0.8
1.5
0.6
1
0.4 0.2
0.5
0
0 0
20
40
60
80
0
100
Time step
40
60
80
100
120
Time steps
Figure 6. Trust score pattern with "connection time" parameter change.
Figure 7. Trust score pattern with "connection duration" parameter change.
licious behavior but quickly drops it, its trust score will reflect that.
full mode
20
Although our approach does not provide 100% indication of peer’s maliciousness, it is likely to expose bad peer’s intentions in either network or temporal activity. In other words, it may be possible that a good peer is wrongly punished due to false positive responses of the anomaly detection algorithm, however, it will be difficult for a malicious peer to remain unnoticed.
trust mode
7 6
Trust score
5 4
5 Conclusions and Future Work
3 2
• We presented a novel approach that integrates a peerprofile based anomaly detection technique and trust management schema in P2P environment.
1 0 0
20
40
60
80
100
Time steps
• We proved that our approach is effective. Using simulation we demonstrated that our framework is able to capture peer’s behavior more accurately than a reputationbased approach alone. These results provide strong testimony that the proposed framework can be used in many settings including intrusion detection and e-commerce applications.
Figure 8. Trust score pattern with number of uploaded bytes parameter change.
5. Change of all parameters: Figures 11, 12 illustrate that full mode is always able to detect malicious peer behavior even if this behavior is not flagged as ’bad’ by reputationbased trust mechanism. Similar to ’number of query requests’ parameter increase, if bad actions are spread out through the peers session then trust score in full mode rises rapidly.
• Future direction of this project is application of the approach to hierarchical setting through super-node concept.
References
Majority of our results showed clear difference of trust score between full and trust modes, however, on few occasions we noticed that full mode was not able to detect anomaly due to false negative response of SVM algorithm to anomalous data. Although, the detection rate of one-class SVM is generally high, 100% performance is not desirable since it becomes an indicator of overfitted data and, therefore, inability of algorithm to detect unknown anomalies. Since the accuracy of SVM algorithm has been intensively studied before, we decided not to focus on it in this work.
[1] A. Abimbola, Q. Shi, and M. Merabti. Using intrusion detection to detect malicious peer-to-peer network traffic. In Proc. of PGNet, 2003. [2] C.C. Chang and C.J. Lin. Libsvm: a library for support vector machines (version 2.31). Available from ”http://www.csie.ntu.edu.tw/˜cjlin/libsvm/”. [3] F. Cornelli, E. Damiani, S. di Vimercati, S. Paraboschi, and P. Samarati. Choosing reputable servents in p2p network. In WWW, 2002.
6
full mode
full mode
trust mode
10
0.9
9
0.8
8
0.7 0.6 Trust score
Trust score
7 6 5 4
0.5 0.4 0.3
3
0.2
2
0.1
1 0
0.0
0
20
40
60
80
100
0
20
Time steps
anomaly mode
40
60
80
100
Time steps
Figure 9. Trust score pattern 1 with number of query request parameter change.
Figure 10. Trust score pattern 2 with number of query request parameter change.
anomaly mode
trust mode
12
trust mode
25
10
20
8
Trust score
Trust score
trust mode
6
15 10
4
5
2
0
0 0
20
40
60
80
0
100
20
40
60
80
100
Time steps
Time steps
Figure 11. Trust score pattern with all parameters changed.
Figure 12. Trust score pattern with all parameters changed.
[4] V. Dao and V. Vemuri. Profiling users in the unix os environment. In International ICSC Conference on Intelligent Systems and Applications, 2000.
[13] L. Portnoy, E. Eskin, and S. Stolfo. Intrusion detection with unlabeled data using clustering. In ACM CSS Workshop on Data Mining Applied to Security, 2001.
[5] D.E. Denning. An intrusion-detection model. In IEEE Transactions on Software Engineering, pages 222–232, February 1987.
[14] A. Singh and L. Liu. Trustme: Anonymous management of trust relationships in decentralized p2p systems. In Third International Conference on Peer-to-Peer Computing (P2P’03), 2003.
[6] E. Eskin, A. Arnold, M. Prerau, L. Portnoy, and S. Stolfo. A geometric framework for unsupervised anomaly detection: Detecting intrusions in unlabeled data. In Applications of Data Mining in Computer Security, 2002.
[15] N. Stakhanova, S. Ferrero, J. Wong, and Y. Cai. A reputationbased trust management in peer-to-peer network systems. In International Workshop on Security in Parallel and Distributed Systems, 2004.
[7] M. Gupta, P. Judge, and M.A. Ammar. A reputation system for peer-to-peer networks. In NOSSDAV, 2003.
[16] The Gnutella Protocol Specifications v0.4. Document Revision 1.2. Available from ”http://www.clip2.com”.
[8] KaZaA. Available from ”http://www.kazaa.com/us/index.htm”. [9] T. Lane and C. Brodley. Temporal sequence learning and data reduction for anomaly detection. In 5th ACM Conference on Computer & Communications Security,, 1998. [10] J.A. Marin, D. Ragsdale, and J. Surdu. A hybrid approach to profile creation and intrusion detection. In Proc. of DARPA Information Survivability Conference and Exposition, June 12– 14, 2001. [11] J. McClave and F. Dietrich. Statistics, 4th ed. Dellen Publishing Company, 1988. [12] Napster. Available from ”http://www.napster.com”.
7