the rotation angle by converting the offset to degrees and this information ... Curvature Scale Space (CSS): The CSS descriptor ex- ..... demo.html, May 2005.
TSD: A shape descriptor based on a distribution of tensor scale local orientation Paulo A.V. Miranda, Ricardo da S. Torres, and Alexandre X. Falc˜ao Institute of Computing – State University of Campinas (UNICAMP) CEP 13084-851, Campinas, SP, Brazil {paulo.miranda,rtorres,afalcao}@ic.unicamp.br Abstract We present tensor scale descriptor (TSD) — a shape descriptor for content-based image retrieval, registration, and analysis. TSD exploits the notion of local structure thickness, orientation, and anisotropy as represented by the largest ellipse centered at each image pixel and within the same homogeneous region. The proposed method uses the normalized histogram of the local orientation (the angle of the ellipse) at regions of high anisotropy and thickness within a certain interval. It is shown that TSD is invariant to rotation and to some reasonable level of scale changes. Experimental results with a fish database are presented to illustrate and validate the method.
1 Introduction Recent advances in the image acquisition technologies have increased the demand for effective image searching and browsing tools. Such tools should be able, for example, to retrieve images from large collections, which are similar to a query image. The images contain objects and the standard formats to represent the shape of these objects may be used for this purpose, as shape descriptors. In the MPEG-7 project, for instance, several principles have been adopted to measure the quality of a descriptor, such as its retrieval accuracy, robustness, compactness, general application, computational complexity, and hierarchical representation from coarse to fine [17]. In order to accomplish these goals, a descriptor should be simple, compact, insensitive to noise, affine-invariant, and at same time contain all relevant information to distinguish different images. In this work, we present a shape descriptor based on the tensor scale concept [26, 27, 29] — a morphometric parameter yielding a unified representation of local structure thickness, orientation, and anisotropy. That is, at any image point, its tensor scale is represented by the largest ellipse
(2D), or ellipsoid (3D), centered at that point and within the same homogeneous region. The algorithmic framework to compute tensor scale, as originally proposed [26, 27, 29], is computationally expensive. To address this problem, we propose a simpler and yet effective implementation of the original method. Tensor scale has been demonstrated for image filtering, segmentation, and registration [26, 27, 29]. In this paper, we discuss its applicability to create effective shape descriptors for content-based image retrieval. The key idea is to represent each image by its normalized histogram of the local orientation (the angle of the ellipse) at regions of high anisotropy and thickness within a certain interval. The matching of two images involves correlation, registration, and absolute difference of area between their histograms to produce a similarity measure. This process is invariant to rotation and to some reasonable level of scaling, which does not affect the computation of the ellipses. The rotation angle may be easily found during the matching phase and could be used for image registration as well. After giving the previous relevant study in Section 2, Section 3 presents our implementation of tensor scale. In Section 4, we present the tensor scale descriptor and its validation is done in Section 5. Section 6 states conclusion and discusses future work.
2 Background Scale is a very used concept in image processing. Basically, scale-based approaches have been used in different applications (such as, image classification and retrieval) to represent and process images at various resolutions. Current researches in this area have focused on the promising notion of localized scale, which is space-variant resolution method. Punam et al. have introduced a new local scale method called tensor scale [26, 27, 29]. Their approach is a natural evolution of their previous work based on a spherical
model [26, 28, 30] to a richer model based on ellipses. The elliptical model overcome the major limitation of the spherical model, which is the lack of local structure orientation and anisotropy information. The tensor scale at an image point is a parametric representation of the largest ellipse (ellipsoid in 3D) centered at that point and within the same homogeneous region, according to some predefined criterion. It yields a unified representation of local structure thickness, orientation, and anisotropy, serving as a unique tool to analyze architecture of image structures without explicit segmentation [26, 27, 29]. For a given pixel, the largest ellipse within the same homogeneous region is determined by tracing sample lines from 0 to 180 degrees around that pixel and computing the following steps:
The local edge detection on each segment is based on the P maximum µU(p) and minimum µDN (p) intensity profiles along πi
=
(2)
(p)
(3)
fi (x),
min
fi (x)
x=1,2,...,λ
πi
πi
cation is given as the first (from the pixel p) zero-crossing point of the LoG function, where the intensity gradient is above a threshold. The intensity gradient is computed by convolving the minimum and maximum profiles with the first derivative of a Gaussian. The computed edge locations along all sample lines are used to fit an ellipse centered at the point p. Since two radially opposite points on a given line are expected to be equidistant to p, they need to be repositioned. The method selects the edge point closer to p on each pair of opposite segments and replaces the other by the reflection of the selected point. The computation of the best-fit ellipse is accomplished in two sub-steps.
4. Computation of the best-fit ellipse to the repositioned edge locations. These steps are performed for each image pixel until all ellipses have been computed. Next, we briefly explain these steps as originally proposed in [26, 27, 29]. For a given sample line passing through a given pixel, the method considers the two radially opposite segments from that point (center of the pixel) in order to locate the closest edge points, being one on each segment. The distribution of the sample lines is approximately uniform over the entire angular space (from 0 to 180 degrees) around the pixel. This is important to guarantee invariance to rotation. A unit vector is used to represent the direction of each segment. There are m pairs of these mutually opposite unit 0 vectors, denoted by (~τ1 , ~τ10 ), (~τ2 , ~τ20 ), ..., (~τm , ~τm ). The segment with direction ~τi emanating from a pixel p is denoted (p) by πi : [0, L] → th1 (abrupt transition) or when c > th2 (smooth transition). In the case of binary images, the edge detection phase is trivial. We just stop traversing a pair of opposite segments, when one of them reaches the background. The rest of the algorithm is the same. To improve the ellipse computation phase, we use a more straightforward solution. Instead of using the principal component analysis [13] to compute the ellipse’s orientation θ (which involves determining the eigen-values and eigen-vectors), we define a function g(γ) that gives us the angle θ directly. X 2 2 g(γ) = [x00i − yi00 ], where (16)
not necessary to perform sums F , G, and H for all edge points. We may only consider one point for each pair of 2 2 opposite segments, since yi0 = (−yi0 )2 , x0i = (−x0i )2 , and x0i · yi0 = (−x0i ) · (−yi0 ). Thus, the sums F , G, and H will be half sized. The same observation also applies to the computation of the length of the semi-axes. More specifically, for each opposite pair of segments we may add only once any of the two opposite edge points during A, B, C, D, and E computations.
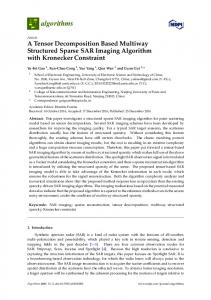
4 Content-based image retrieval using tensor scale Distinct objects often present different tensor scale local orientation distributions of their shape, or even of their texture. The tensor scale descriptor (TSD) is based on this statement. We first compute the tensor scale parameters for the original image and then analyze the local orientation histogram. The computation of the local orientation histogram only considers pixels of high anisotropy and with thickness within a certain interval. This is done because pixels with either low anisotropy or high thickness do not have a well defined orientation and because pixels with low thickness stand over the edges and have their orientation influenced by pixel geometry. The local orientation histogram is circular. The effect of image rotation on it is just the displacement by a constant offset. The matching of two given images is made by taking the absolute difference of area between their histograms, after correcting the displacement between them by correlation. The maximum correlation between two histograms gives us the best offset. Therefore, the process is invariant to rotation. To make the method more insensitive to scale, we use normalized histograms. Figure 1a shows a fly wing image. The tensor scale image of Figure 1a and of its rotation by 15◦ are shown in Figure 1b, together with the circle on the right which represents the HSI color coding. As we may see, the two tensor scale images have a very good agreement. Figure 1c illustrates the matching of their local orientation histograms, after offset correction by correlation. Note that we can find the rotation angle by converting the offset to degrees and this information could be used for registration.
i=1,2,...,2m
x00i
= x0i cos γ − yi0 sin γ
yi00
x0i
=
sin γ +
yi0
cos γ
(17) (18)
(x0i , yi0 ) are the relative coordinates of the edge points with respect to the center p = (xp , yp ) of the ellipse, and (x00i , yi00 ) are the new coordinates after applying a rotation by angle γ (i.e., γ is a candidate for −θ). The ellipse’s orientation is obtained from the value of γ which maximizes the function g. By setting the derivative of this function to zero (g 0 (γ) = 0), it can be shown that γ has the form. h i 2·F arctan G−H γ = , where (19) X2 F = x0i · yi0 , (20) i=1,2,...,2m
G
=
2
(21)
2
(22)
X
yi0 ,
X
x0i
i=1,2,...,2m
H
=
i=1,2,...,2m
We have to observe that g 0 (γ) = 0 may also imply that g is minimum and the difference between the maximum and the minimum values is π/2. This situation can be corrected as follows. if(F < 0.0 and γ < 0.0) γ ← γ + π/2 else if(F > 0.0 and γ > 0.0) γ ← γ − π/2
5 Experimental Results This section compares the tensor scale descriptor (TSD) to commonly used shape descriptors.
5.1 Shape database
(23)
The shape database is a set with one thousand and one hundred fish contours obtained from [31]. Since there is
The above approach is very simple and yet effective. One may also note that due to the symmetry of the ellipse, it is 4
Descriptor Id TSD CCS CSS BAS
Descriptor Name Tensor Scale Descriptor Convex Contour Saliences Curvature Scale Space Beam Angle Statistics
Table 1. List of evaluated descriptors. (a) of these methods have been proposed, but, in this work, we consider conventional implementations. Convex Contour Saliences (CCS): The CCS of a contour is definined as the influence areas of its higher curvature convex points [7, 8]. Previous work [7] has shown that CCS outperformes Multiscale Fractal Dimension [7], Fourier Descriptors [12, 22], Moment Invariants [10, 14], CSS [1, 24] and BAS [3] with respect to the multiscale separability measure [7]. Experiments with Precision × Recall have also shown better results with the CCS as compared to CSS, Fourier Descriptors, and Moment Invariants [8]. Curvature Scale Space (CSS): The CSS descriptor extraction algorithm is described in [1, 24]. The CSS descriptor vector represents a multiscale organization of the curvature zero-crossing points of a planar curve. In this sense, the descriptor dimension varies for different shapes, thus a special matching algorithm is necessary to compare two CSS descriptors [24]. We implemented a C version of the Matlab prototype presented in [23]. Beam Angle Statistics (BAS): The BAS descriptor has been compared with several others [4, 6, 16, 19, 20, 24], including the CSS descriptor. In [3], it was shown that the BAS functions with 40 and 60 samples outperform all of them. The experiments of the present paper use the BAS descriptor with 60 samples. Basically, the BAS descriptor is based on the beams originated from a contour pixel. A beam is defined as the set of lines connecting a contour pixel to the rest of the pixels along the contour. At each contour pixel, the angle between a pair of lines is calculated, and the shape descriptor is defined by using the third-order statistics of all the beam angles in a set of neighborhoods. The similarity between two BAS moment functions is measured by an optimal correspondent subsequence (OCS) algorithm, as shown in [3].
(b) Tensor Scale Descriptor 0.013
original image rotated image
0.012 0.011
Histogram
0.01 0.009 0.008 0.007 0.006 0.005 0.004 0.003
0
20
40
60
80
100
120
140
160
180
Angle
(c) Figure 1. (a) A fly wing image. (b) The tensor scale images of (a) and of its rotation by 15◦ , and a circle representing the HSI color coding. (c) The matching of their local orientation histograms by correlation. no semantic definition of classes for the fish contours in this database, we defined a class as consisting of 10 different manifestations of each contour by rotation and scaling. Then, the problem consists of 1100 classes with 10 shapes each.
5.3 Effectiveness measures Our experiments rely on the creation of a shape-based image retrieval system, which can be characterized as follows. Assume that we have a database containing a large number of images. Given a user-defined query pattern (e.g., a query image), the system must rank the images stored in the image database in increasing order of their distance of the query image (similarity), according to the image content (i.e., the objects are represented by shape properties).
5.2 Evaluated descriptors Table 1 shows the set of implemented shape descriptors. Beam Angle Statistics and Curvature Scale Space have been widely used as shape descriptors [1–3, 24]. Many versions 5
The purpose of our experiments is to evaluate the effectiveness of the similarity-search of different descriptors in retrieving relevant images. Effectiveness evaluation is a very complex task, involving questions related to the definition of a collection of images, a set of query images, a set of relevant images for each query image, and suitable retrieval effectiveness measures. In our case, we use each original image as query image and we consider its manifestations as relevant images. In our experiments, we use two graphical measures: Precision vs. Recall and θ vs. Recall. Precision vs. Recall (P × R) curves are the commonest evaluation measure used in CBIR domain. Precision is defined as the fraction of retrieved images which is relevant to a query. In contrast, recall measures the fraction of the relevant images which has been retrieved. A recall is a non-decreasing function of rank, while precision can be regarded as a function of recall rather than rank. A θ × R curve can be seen as a variation of the P × R. We define θ as the average of the precision values measured whenever a relevant image is retrieved. For 100% of recall, the θ value is equivalent to the average precision. The main difference between the measures is that, unlike precision, θ value is cumulative (i.e., its computation considers not only the precision at a specific recall but also the precision at previous recall levels). In general, both curves (P × R and θ × R) closest to the top of the chart indicates the best performance.
Precision x Recall (ShapeDB) 1
Precision
0.8 0.6 0.4 0.2 0
TSD CCS CSS BAS 0.1
0.2
0.3
0.4
0.5 0.6 Recall
0.7
0.8
0.9
1
Figure 2. Precision versus Recall curve. Theta x Recall (ShapeDB) 1
Theta
0.8 0.6 0.4 0.2
5.4 Experimental results
0
This section discusses our experimental results related to the effectiveness of the proposed Tensor Scale approach. We compare TSD and the CBIR approaches reviewed in Section 5.2, showing that TSD outperforms them. Figures 2 and 3 show respectively the P ×R and θ×R curves obtained for all descriptors. Observe that the TSD presents the best P ×R curve (Figure 2). For the θ × R curve (Figure 3), a similar result can be verified. Again, the TSD outperforms the others. Figure 4 shows examples of similarity retrieval using four different query images (first column) and by taking into account the TSD. Each returned image is accompanied with the distance value with respect to the query image. As we can see, TSD was able to return similar images in the first positions.
TSD CCS CSS BAS 0.1
0.2
0.3
0.4
0.5 0.6 Recall
0.7
0.8
0.9
1
Figure 3. θ versus Recall curve. was evaluated using a fish database (binary images) in order to compare its effectiveness for content-based image retrival with the ones obtained by other well known shape descriptors: Convex Contour Saliences [7, 8], Curvature Scale Space [1, 24], and Beam Angle Stastistics [3]. The effectiveness of the proposed descriptors is evident regarding the Precision vs. Recall and θ vs. Recall curves. The presence of manifestations, obtained by rotating and scaling operations, in the relevant sets suggests that the TSD is more robust to these kind of transformations than the others. We are currently creating an image database of fly wings to support research in Biology. Preliminary tests have shown that TSD on texture is very promising for fast identification of similar species of flies using content-based image retrieval. We also intend to investigate other simple ways of defining local orientation, such as the gradient field over the image [9, 15, 18, 25, 33], and compare them with the TSD.
6 Conclusions and Future Work We have presented a simpler and yet effective implementation of the tensor scale concept and proposed a tensor scale descriptor based on local orientation. The TSD 6
Query Image
1
2
3
4
5
6
7
8
9
0.00
0.15
0.19
0.21
0.21
0.23
0.23
0.23
0.24
0.25
0.00
0.13
0.14
0.15
0.15
0.16
0.16
0.17
0.17
0.18
0.00
0.12
0.12
0.12
0.12
0.13
0.14
0.14
0.14
0.14
0.00
0.20
0.21
0.22
0.23
0.23
0.23
0.24
0.25
0.33
Figure 4. Results of similarity retrieval for four query images (first column), using the TSD.
Acknowledgments
[6] G. Chuang and C.-C. Kuo. Wavelet Descriptor of Planar Curves: Theory and Applications. IEEE Transactions on Pattern Analysis and Machine Intelligence, 5(1):56–70, 1996. [7] R. da S. Torres, A. X. Falc˜ao, and L. da F. Costa. A Graphbased Approach for Multiscale Shape Analysis. Pattern Recognition, 37(6):1163–1174, June 2004. [8] R. da S. Torres, E. M. Picado, A. X. Falc˜ao, and L. da F. Costa. Effective Image Retrieval by Shape Saliences. In Proceedings of the Brazilian Symposium on Computer Graphics and Image Processing, pages 49–55, S˜ao Carlos, SP, Brazil, October 2003. [9] S. di Zeno. A note on the gradient of a multi-image. Computer Vision Graphics and Image Processing, 33(1):166– 125, 1986. [10] S. A. Dudani, K. J. Breeding, and R. B. McGhee. Aircraft Identification by Moment Invariants. IEEE Transactions on Computers, 26(1):39–45, January 1977. [11] J. H. Elder and S. W. Zucker. Local scale control for edge detection and blur estimation. IEEE Transactions on Pattern Analysis and Machine Intelligence, 20(7):699–716, 1998. [12] R. C. Gonzalez and R. E. Woods. Digital Image Processing. Addison-Wesley, Reading, MA, USA, 1992. [13] E. L. Hall. Computer Image Processing and Recognition. New York, NY: Academic Press, 1979. [14] M. K. Hu. Visual Pattern Recognition by Moment Invariants. IRE Transactions on Information Theory, 8(2):179– 187, 1962. [15] M. Kass and A. Witkin. Analyzing oriented patterns. Computer Vision Graphics and Image Processing, 37(3):362– 385, 1987.
The authors thank CNPq (Proc. 302427/04-0; Webmaps and Agroflows projects), FAPESP (Proc. 03/09793-1), and Microsoft Escience Project for the financial support. The authors are grateful to Sadegh Abbasi, Farzin Mokhtarian, and Josef Kittler for the fish database.
References [1] S. Abbasi, F. Mokhtarian, and J. Kittler. Enhancing CSSbased Shape Retrieval for Objects with Shallow Concavities. Image and Vision Computing, 18(3):199–211, February 2000. [2] N. Arica and F. T. Y. Vural. A Perceptual Shape Descriptor. In Proceedings of the International Conference on Pattern Recognition, pages 375–378, Madison, Wisconsin, USA, 2002. [3] N. Arica and F. T. Y. Vural. BAS: A Perceptual Shape Descriptor Based on the Beam Angle Statistics. Pattern Recognition Letters, 24(9-10):1627–1639, June 2003. [4] S. Belongie, J. Malik, and J. Puzicha. Shape Matching and Object Recognition Using Shape Contexts. IEEE Transactions on Pattern Analysis and Machine Intelligence, 24(24):509–522, 2002. [5] J. Canny. A computational approach to edge detection. IEEE Transactions on Pattern Analysis and Machine Intelligence, 8(6):679–698, 1986.
7
[33] J. van de Weijer, L. J. van Vliet, P. W. Verbeek, and M. van Ginkel. Curvature estimation in oriented patters using curvilinear models applied to gradient vector fields. IEEE Transactions on Pattern Analysis and Machine Intelligence, 23:1035–1043, 2002. [34] D. Zhang and G. Lu. Review of shape representation and description techniques. Pattern Recognition, 37(1):1–19, 2004.
[16] A. Khotanzan and Y. H. Hong. Invariant Image Recognition by Zernike Moments. IEEE Transactions on Pattern Analysis and Machine Intelligence, 12(5):489–487, 1990. [17] H. Kim and J. Kim. Region-based shape descriptor invariant to rotation, scale and translation. Signal Process. Image Commun, 16(1-2):87–93, 2000. [18] H. Knutsson. Representing local structures using tensors. in Proceedings of 6th Scandinavian Conference on Image Analysis, pages 244–251, 1989. [19] L. J. Latecki and R. Lakamper. Shape Similarity Measure Based on Correspondence of Visual Parts. IEEE Transactions on Pattern Analysis and Machine Intelligence, 22(10):1185–1190, 2000. [20] L.-J. Lin and S.-Y. Kung. Coding and Comparison of DAGs as a Novel Neural Structure with Applications to On-Line Handwriting Recognition. IEEE Transactions on Signal Processing, 45(11):2701–2708, 1997. [21] D. Marr and E. Hildretch. Theory of edge detection. Proceedings of Royal Society London, 207:187–217, 1980. [22] B. M. Mehtre, M. S. Kankanhalli, and W. F. Lee. Shape Measures for Content Based Image Retrieval: A Comparison. Information Processing and Management, 33(3):319– 337, 1997. [23] C. Y. Ming. Shape-Based Image Retrieval in Iconic Image Databases. Master’s thesis, Chinese University of Hong Kong, June 1999. [24] F. Mokhtarian and S. Abbasi. Shape Similarity Retrieval Under Affine Transforms. Pattern Recognition, 35(1):31– 41, January 2002. [25] B. Rieger and L. J. van Vliet. Curvature of n-dimensional space curve in grey-value images. IEEE Transactions on Image Processing, 11(7):738–745, 2002. [26] P. Saha. Tensor Scale: A Local Morphometric Parameter With Applications to Computer Vision and Image Processing. Technical Report 306, Medical Image Processing Group, Department of Radiology, University of Pennsylvania, September 2003. [27] P. K. Saha, J. C. Gee, Z. Xie, and J. K. Udupa. Tensor scalebased image registration. in Proceedings of SPIE: Medical Imaging, 5032:743–753, 2003. [28] P. K. Saha and J. K. Udupa. Scale-based diffusive image filtering preserving boundary sharpness and fine structures. IEEE Transactions on Medical Imaging, 20(11):1140–1155, 2001. [29] P. K. Saha and J. K. Udupa. Tensor scale-based fuzzy connectedness image segmentation. in Proceedings of SPIE: Medical Imaging, 5032:1580–1590, 2003. [30] P. K. Saha, J. K. Udupa, and D. Odhner. Scale-based fuzzy connected image segmentation: Theory, algorithms, and validation. Computer Vision and Image Understanding, 77(2):145–174, 2000. [31] ShapeDB. www.ee.surrey.ac.uk/research/vssp/imagedb/ demo.html, May 2005. [32] H. D. Tagare and R. J. P. deFigueiredo. On the localization performance measure and optimal edge detection. IEEE Transactions on Pattern Analysis and Machine Intelligence, 12(12):1186–1190, 1990.
8