ABSTRACT: Fluid flow modeling in continuous casting tundish is a normal procedure when ... were done in steady state and in transient casting conditions.
STEELSIM 2007 – September 12-14 2007 – Graz/Seggau, Austria
Tundish Flow Model Tuning and Validation : Steady State and Transient Casting Situations P. Väyrynen1, S. Vapalahti1, S. Louhenkilpi1, L. Chatburn2, M. Clark2, T. Wagner2 1 2
Laboratory of Metallurgy, Helsinki University of Technology, Espoo, Finland Foseco Steel, Borken, Germany
ABSTRACT: Fluid flow modeling in continuous casting tundish is a normal procedure when designing or modifying a tundish. Both physical and mathematical modeling are used for this task, but mathematical modeling is becoming more popular because of advances in computer hardware and software development and because the effect of natural convection is difficult to take into account in physical modeling. This research focuses on tuning and validation of a commercial CFD package to be used in tundish simulations using physical modeling and plant trials. After physical modeling with a 1/3 scale water model was made, simulations of the water model were conducted first using a tundish with no flow modifiers and then to further test the tuned model two different flow modifier designs were simulated. To investigate how modeling works in the actual process, plant trials were made and simulation of a full scale tundish with steel was conducted. Experiments and simulations were done in steady state and in transient casting conditions. Different turbulence models and other important model variables were studied. 1.
INTRODUCTION
To study the fluid flow phenomena and to design tundishes is problematic. Direct observations and empirical investigations during casting are difficult and expensive to make. Usually direct methods are replaced by using physical modelling with water, mathematical modelling or combinations of both. Physical modelling gives significant insights into the flow behaviour in a tundish but due to limitations of the method, like the lack of natural convection, exact knowledge of e.g. inclusion separation is difficult to obtain. In recent years, mathematical modeling has become more popular because of the developments both in computer hardware and software. However, in order to use a mathematical model many issues like used mesh density and turbulence model must be studied. Proper selections and validations must be made before the results of the mathematical simulations can be trusted. 2.
PHYSICAL MODELING OF TUNDISH
Fluid flow in steelmaking system has been a subject of extensive study for many years. Physical modelling, where room temperature water is used as the medium, is widespread application for the study of fluid flow in the tundish, especially in designing flow modifiers. Some methods for estimating how well the tundish fulfils its functions have been developed. Methods used in this project were C- and F-curve analyses. C-curve study helps assess the flow characteristics of steel in the tundish at steady state casting condition. During the experiment water is filled up to the working level and then held at steady state for as long as needed to get the bath stabilized. After the bath is stabilized, C-curve is obtained by injecting a known amount of dye into the model ladle shroud and monitoring the transmittance of light through the exit stream by a colorimeter [1]. Analysis of C-curves provides three key values which describe the flow in the tundish : minimum residence time (high value to maximize inclusion floatation), plug volume (high value to minimize mixing and to reduce mean flow velocity) and dead volume (low value indicates smaller stagnant flow areas) [2]. F-curve study gives an idea of the nature of fluid flow with respect to casting of two different grades of steel in two consecutive heats in the same tundish. In experiment tundish is filled to working level and both inlet and outlet are closed and a known amount of dye is homogenously mixed with the entire volume of water (to represent old steel). Then the outlet is opened at steady state flow rate and the coloured water is drained down to a specific level. After this the inlet is opened to have a double flow rate compared to the outlet and fresh water (representing new steel) is used to fill up back to the working level. After working 147
STEELSIM 2007 – September 12-14 2007 – Graz/Seggau, Austria
level is reached the inlet flow is brought back to steady state flow rate. Dye concentration is monitored at the exit stream in the same method as described above. At the grade change the analysis of the F-curve provides the extent of the mixing length and at the ladle change the information on how fast the flow returns to steady state [1]. In this study red colour liquid dye having similar density as that of water is used as a tracer for both C- and F-curve studies. The tundish model was constructed in clear Perspex using a 1/3 scale factor based on Froude similarity, which allows to scale down any linear dimension by a suitable factor [3]. Volume of the downscaled tundish was about 150 litres. Three different tundish configurations were used in water model experiments : tundish with no flow modifiers, tundish with Turbostop® flow control device and tundish with anti-splash box manufactured by Betker. Presented C- and F-curve results for each physical modeling cases are average results of three separate experiments. Physical modeling part of the project was done by Foseco Steel. 3.
SIMULATIONS OF PHYSICAL MODEL
Procedure to build up a mathematical model of the physical model was straight forward. Tundish geometry was made from same drawings as physical model with small simplifications to inlet and outlet areas. In most of the mathematical model cases slide gate system was left out from the inlet area. Modeling of slide gate would have needed much denser calculation mesh and this would have slowed simulations significantly. The simulation with the slide gate system was made to find out how much it will change the results. In the outlet area simplifications were made to the stopper rod geometry. In the water model only used boundary conditions were velocities of incoming and outgoing flows. All cases were built up using only a single mesh block except for simulation with the slide gate which was done with two mesh blocks. This simulation differed from other simulations also in total mesh size. Because the flow modifiers needed to have more precise mesh around them, mesh sizes differed between the cases (150000 to 250000 cells). The cell aspect ratio was kept approximately the same in all cases and lengths of the cell sides varied between 0.5 to 2.1 centimetres. Heat transfer model was not in use during the water model simulations but only physics models used were gravity and turbulence. All simulations were done by Helsinki University of Technology. 3.1
Steady state
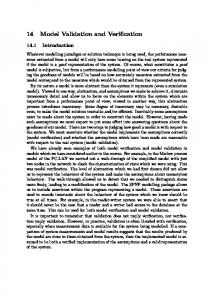
The steady state simulations were done in two parts : in the first part fluid level in the tundish was set to working level height and simulation was started. When only minimal changes in turbulent and kinetic energies were observed, this happened usually after software has simulated approximately 500 seconds, simulation was considered to be steady and it was terminated. In the second part results of the first simulation were used as restart data for the new simulation. This can be considered as steady state experiment of the water model. Colour dye pulse used in C-curve analysis was created in simulation using scalars (numerical quantities moving with fluid flow). C-curve result of the simulation was achieved by monitoring concentration of scalars in the outlet of tundish. 3.1.1 Model tuning General CFD-software are developed so that most of cases could be solved using their default parameters. Since application field can be extremely wide, problems can be expected if trying to solve something little more unusual. Before even starting to think about changing solver parameters it is very important to check that case geometry and other basic information are correct, since these can affect greatly the simulation results. On water model simulation part of this project, these check ups did not totally fix difference between experimental and calculated results. According to those results problem seemed to be inaccurately calculated flow, since C-curve results showed that colour in simulations was moving too fast out of the tundish (Fig. 1). Since flow rates were correct, it was necessary to start looking solution from the model itself. Parameter which would affect flow was considered to be order of momentum advection. As a default the used CFD-software (Flow-3D®) uses a first-order upwind differencing method as the momentum advection algorithm. This method is robust and sufficiently accurate in most situations, although, as in any first-order method, it introduces numerical diffusion into the solution. The algorithm was changed to a higher order method. 148
STEELSIM 2007 – September 12-14 2007 – Graz/Seggau, Austria
The third-order upwind differencing method is much more accurate but it is not as robust as the lower order methods and it does not always produce stable solutions in the presence of free surfaces [4]. As expected flow pattern never reached any totally stable solution, but flow kept fluctuating little bit through simulations. However, in this case results were better after changing to this higher order algorithm. The use of third-order momentum advection algorithm brought up a new problem. Problem was not visible in the steady state simulations but it changed results in the transient situation significantly. After the fluid level had risen to the working level and steady state flow rates switched on, there were no changes at all in the flow pattern. This was unexpected since even in steady state simulations the flow pattern was always in transition. By looking more thoroughly the new results, it was found that dissipation of turbulent energy was very high and this “killed” the flow very effectively. Solution to this problem was to be found from the software’s default values. The parameter which would affect this behaviour in simulation is turbulent mixing length. The default value of this parameter in Flow-3D® is 10 % of the length of the smallest cell side [4]. In attempt to find optimum length, couple different values were tried. The optimum range was found when estimate for fully developed pipe flow was used. In fully developed pipe flow the turbulent mixing length scale is 7 % of the hydraulic diameter, which in the case of a circular pipe is diameter of the pipe (in this case ladle nozzle) [5]. Change in turbulent mixing length did have an effect in both steady state and in transient situations. Until this point only Flow-3D®’s default turbulence model, RNG-model (renormalization-group) had been used. Final model tuning attempt was in testing other possible models available within the software. Other real turbulence models available were normal k-ε model and LES (large eddy simulation) model. Non-turbulent models (inviscid and laminar) were also tested. Results were surprisingly close to each other. Only difference was found in calculation times, especially in transient simulation. Since there was no difference in accuracy, RNG model was selected as turbulent model for future simulations since it was the fastest model for this case. 3.1.2 Validation of tundish with no flow modifiers Validation of the mathematical model in steady state situations was made by comparing the C-curve results of the experiments and scalar concentration curves from the simulations. Even though model tuning had a big impact to result accuracy, the difference between experimental and simulation results is clear (Fig. 1). Simulation results still showed higher concentration peak in the beginning, which would indicate that flows are still faster than in the experiments. Different concentration scales (for experimental and simulated curves) in all pictures is due to calibration of the water model colorimeter.
Fig. 1 : C-curve results before and after model tuning when using tundish with no flow modifiers
Fig. 2 : C-curve results of tundish with no flow modifiers with and without slide gate system
Simulation with slide gate produced only slightly different results (Fig. 2). Minimum residence time is same, but first concentration peak does not rise as high as in the case without the slide gate. This indicates that modeling of geometry is not the cause of the difference between simulations and experiments. The probable causes are experimental dye concentration measurement method, scalar dye diffusion in simulations or turbulence model that is not capable of simulating transition between turbulent and laminar conditions.
149
STEELSIM 2007 – September 12-14 2007 – Graz/Seggau, Austria
3.1.3 Validation of tundishes with flow modifiers Steady state simulations for two different flow modifiers were done to test model further. The same problems as in basic case remained in these cases too. In simulation with Turbostop® flow control device (Fig. 3) and in simulation with Betker anti-splash box (Fig. 4) same kind too high concentration peak can be found from C-curve results as it was found in simulation of tundish with no flow modifiers. However there is again, especially with Turbostop® case, good resemblance with curve shapes. Results from these steady state and transient situation cases show clearly that used CFD-software will not be able to simulate downscaled water model with wanted accuracy.
Fig. 3 : C-curve results for tundish with Turbostop flow control device
3.2
Fig. 4 : C-curve results for tundish with Betker antisplash box
Transient casting conditions
Simulations of transient casting situations were done by using the data from steady state simulations as the initial state. Fluid will, like in physical modeling, go from normal working level to minimum bath level and after that rise back to the working level. Analysis of F-curve results showed similar problems as in steady state situations.
Fig. 5 : F-curve results for tundish with no flow modifiers
Fig. 6 : F-curve results for tundish with Turbostop flow modifier system
Fig. 7 : F-curve results for tundish with Betker anti-splash box
In tundish with no flow modifiers (Fig. 5) and in tundish with Betker anti-splash box (Fig. 7) curves are showing much higher concentrations immediately after the filling sequence starts. In experimental results the beginning of the curve is much smoother. This means that simulations show that old water is replaced much faster than what it should be replaced. In the Turbostop® case (Fig. 6) difference in the beginning of the curve is smaller, but still visible. 150
STEELSIM 2007 – September 12-14 2007 – Graz/Seggau, Austria
Transient casting condition simulation confirms analysis of the steady state results. In this downscaled water model case mathematical model will not give congruent results when compared to experimental results. 4. 4.1
FULL SCALE INDUSTRIAL TUNDISH Steel Plant Experiments
Used tundish has simple rectangular shape and it provides steel only for one mould. When ran at the working level, the tundish holds up approximately 28 tons of steel. Best way to monitor performance of different tundish configurations in the steel plant is to monitor elemental concentrations during the steel grade change. Results from these measurements resemble F-curve results from physical modeling. Measurements were taken from the mould and started immediately when ladle of new steel grade was opened. In the first phase of the casting samples were taken every 0.5 meters of cast steel and later on every 1 meter and every 2 meters. During every grade change at least 10 samples were taken. Sub-entry nozzle in the mould is shaped so that it will produce double roll flow pattern to the mould. This flow pattern will force the incoming steel to the top part of the mould right after it enters giving it less time to mix with the previous steel grade. This gives a concentration reading close to the concentration actually coming from the tundish. Temperature measurements at the steel plant were taken manually using temperature probe. Measurements were taken three times during the cast from the middle of the tundish approximately 40 centimetres below the surface. 4.2
Simulations in steady state
The biggest differences between the full scale and the downscaled tundish simulations can be found in the boundary conditions. First of all the inlet and the outlet velocities are much higher in the full scale model. Secondly heat transfer has been taken into account and fluid is changed from room temperature water to liquid steel. Heat transfer was modeled by using fixed heat flux for every interface [6]. Difference to water model was also the use of the Boussinesq approximation to take into account natural convection in the simulation. Since no elemental analysis could be done during the steady state casting condition, in this project only possible way to validate the model in steady state was to monitor tundish temperatures. Experimental temperature measurements (average temperature of three manual measurements) and simulated temperatures (values saved every 20 seconds) from approximately same location are showed below (Tab. 1). Turbostop Betker
Experimental 1551.33 1561.01
Simulation 1548.82 1558.89
Difference 2.51 2.12
Tab.1 : Temperatures in steady state (all temperatures in Celsius degrees)
Since the possibility to get real incoming temperatures for steel at the steel plant proved to be very difficult, boundary condition temperature in simulation was selected to be estimated temperature of the tundish. This temperature is probably around 5 degrees lower than real incoming temperature, based on the knowledge that temperature drop through the whole tundish is approximately 10 Celsius degrees and wanted overheat of the incoming flow is tried to keep around 30 to 40 degrees. Even when taking this to account results can be considered good. Temperature results of the steady state indicated that heat transfer boundary conditions are good enough and no changes were needed. 4.3
Simulating transient casting conditions Turbostop Betker
Experimental 1542.66 1537.67
Simulation 1539.26 1539.51
Difference 3.40 -1.84
Tab. 2 : Temperatures during transient casting situation (all temperatures in Celsius degrees)
During the grade change situation differences in temperature measurements were approximately same as they were during steady state situations (Tab. 2). In the grade change situations main validation data was elemental analysis. The element to monitor differs depending on what kind of steel grades are cast. In this project it 151
STEELSIM 2007 – September 12-14 2007 – Graz/Seggau, Austria
was found to be best to monitor carbon content, since the change in carbon content between cast grades was clear enough. Since Flow-3D® does not simulate chemical reactions, there was no possibility to follow simulated carbon content. Similar practice with scalars as with water model was used to get simulation results. The elemental analysis was carried out during the first 14 tons cast steel when tundish with Turbostop® flow control device was used (Fig. 8) and longer with Betker anti-splash box (Fig. 9). With Turbostop® simulation curves have slight difference to experimental results in the beginning of the cast, but after that curves follow each other closely. In Betker’s case results differ for some while in the middle of the cast. These differences are however insignificant and accuracy of the simulations is very good in the both cases.
Fig. 8 : Carbon content in steel during grade change situation in tundish with Turbostop flow modifier
Fig. 9 : Carbon content in steel during grade change situation in tundish with Betker anti-splash box
Since all the simulation results (temperature measurements and concentration curves) from full scaled model are accurate when compared to available experimental data, the CFD model can be said to be validated in this case. 5.
DISCUSSION
Validation results of commercial CFD model were diverse. Software did not succeed to simulate downscaled water model accurately, but on the other hand both temperature and transient casting situation results of the full scaled tundish were very good. One possible reason for this behaviour is that the areas of clearly turbulent flow in the water model are much smaller than in actual tundish and this transition of flow type is very difficult for the present turbulence models to calculate accurately. If the poor correlation is cause of this, additional physical modeling should reveal this. New cases, where incoming and outgoing flows will be higher than what were used now, are already scheduled. With higher velocities flow transitions are neglected and this way the mathematical model should give more precise results. According to C- and F-curve comparisons, simulated velocities were too high. Since there was no experimental data of flow field and its velocities from water model, real comparison of the velocities was not possible. In full scaled tundish velocities are higher and density-viscosity ratio of fluid is also much higher. These both differences are affecting to Reynolds number making areas of turbulence much larger and simulation results are more accurate. Scalar dye diffusion and experimental dye concentration method cannot be ruled out as possible sources of errors and they are needed to be investigated further. 6.
REFERENCES
[1] M.Clark, T. Wagner and A. Trousset : Modelling for Tundish Applications, Refractories Engineer, January 2003, pp. 9-12 [2] Y.Sahai and T.Emi : Melt Flow Characterization in Continuous Casting Tundishes, ISIJ Int., Vol. 36 (1996), No. 6, pp. 667-672 [3] D.Mazumdar, G.Yamanoglu, R.Shankarnarayanan and R.I.L.Guthrie : Similarity Consideration in the Physical Modelling of Steel Tundish Systems, Steel Research, 66 (1995), No. 1, pp. 14-19 [4] FLOW-3D® Users Manual, 2006 [5]
D.Kuzmin and S.Turek : Numerical Simulation of Turbulent Bubbly Flow, Proceedings of 3rd International Symposium on Two-Phase Flow Modelling and Experimentation, 22.-24. September 2004, Pisa, Italy, pp. 179-189
[6] S.Chakraborty and Y.Sahai : Effect of Varying Ladle Stream Temperature on the Melt Flow and Heat Transfer in Continuous Casting Tundishes, ISIJ Int., Vol. 31 (1991), No. 9, pp. 960-967
152