Two-Dimensional Phase Unwrapping Using Neural Networks. Wade Schwartzkopf, Thomas E. Milner, Joydeep Ghosh, Brian L. Evans, and Alan C. Bovik.
Two-Dimensional Phase Unwrapping Using Neural Networks Wade Schwartzkopf, Thomas E. Milner, Joydeep Ghosh, Brian L. Evans, and Alan C. Bovik Department of Electrical and Computer Engineering The University of Texas at Austin, Austin, TX 78712-1084 {wade,milner,ghosh,bevans,bovik}@ece.utexas.edu
Abstract Imaging systems that construct an image from phase information in received signals include synthetic aperture radar (SAR) and optical Doppler tomography (ODT) systems. A fundamental problem in the image formation is phase ambiguity; i.e. it is impossible to distinguish between phases that differ by 2π. Phase unwrapping in two dimensions essentially consists of detecting the pixel locations of the phase discontinuities, finding an ordering among the pixel locations for unwrapping the phase, and adding offsets of multiples of 2π. In this paper, we propose a new method for detecting phase discontinuities. The method is based on a supervised feedforward multilayer perceptron neural network. We train and test the neural network on simulated phase images formed in an ODT system. For the ODT phase images, the new method detects the correct unwrapping locations where some conventional methods fail. The key contribution of the paper is a one-pass pixel-parallel low-complexity method for detecting phase discontinuities.
1. Introduction Many popular imaging systems use phase information contained within received signals to produce useful images. Synthetic Aperture Radar (SAR) [1] systems, for example, use several scans from an airplane or satellite to construct a topographic map of large areas of land. Other phase-based methods include Magnetic Resonance Imaging (MRI) [2], acoustic imaging, interferometry, and X-ray crystallography. This paper concerns phase imaging in optical Doppler tomography (ODT) [3] or equivalently color Doppler optical coherence tomography [4] systems. ODT is a broadband interferometric method that uses the phase difference in two received signals to measure the velocity of blood within the microvasculature of tissue. The phase difference between these two signals at a particular B. L. Evans was supported by a US National Science Foundation CAREER Award under grant MIP-9702707. T. E. Milner was supported by the US National Institutes of Health under grant HL59472-03. A. C. Bovik, B. L. Evans, and W. Schwartzkopf are with the Laboratory for Image and Video Engineering, http://signal.ece.utexas.edu/.
location is proportional to the velocity in the image at that location. Currently, ODT velocity images have a spatial resolution of 3-10 µm. The problem inherent in phase imaging is phase ambiguity; i.e. it is impossible to distinguish phases that differ by exactly 2π. Signals of the same magnitude, but with phase equal to 0, 2π, 4π or 2nπ, where n is any integer, are indistinguishable. Since it is impossible to determine the true value of phase, phase values are often assumed to be between –π and π, or some other range of 2π. When the true phase value is placed in a specific 2π range, it is said to be “wrapped.” Phase unwrapping in images is often performed by computationally intensive, off-line systems under user guidance. ODT systems, however, place real-time constraints on the phase unwrapping of the velocity images. In this paper, we introduce a new method for twodimensional phase unwrapping which 1) detects phase jumps using a neural network, 2) determines ordering of jump locations for phase unwrapping, and 3) adds the proper phase offset. The contribution of the paper is in the design of the neural network to detect phase jumps. We use a column scan for the ordering of phase wrapping. The offsets are –2π, 0 and 2π. Other phase discontinuities cannot be compensated.
2. Phase unwrapping in ODT Images Tribolet [5] developed an early phase unwrapping method in one dimension. In 1988, Goldstein’s branch cut algorithm [1] was the first major attempt at unwrapping phase in two dimensions. Goldstein described the concept of residues and the dependence of the unwrapped image on the unwrapping path and these residues. Since then, there have been a number of other attempts including the quality-guided path algorithm [6], the mask cut algorithm [7], and Flynn’s minimum discontinuity approach [8]. In addition, there have been a number of optimization techniques including least squares techniques [9], multigrid methods [10], and Lp-norm techniques [11]. Besides these methods, there are several other approaches including cellular automata [12], polynomial estimation [13], and fractals [14]. There have
also been a few attempts at phase unwrapping with neural networks in one-dimension [17, 18] and two dimensions [15, 16], but the two-dimensional techniques have taken several hours to unwrap even simple images. The purpose of this work was to develop a method of phase unwrapping suitable for ODT. ODT systems have a special set of requirements not found in many phase unwrapping environments. The real-time constraint in modern ODT systems is ten 100×100 images per second. This is opposed to SAR and MRI systems in which phase unwrapping techniques can take days and sometimes require user interaction. Unlike these systems, ODT images must be unwrapped very quickly. Due to the realtime constraint, methods that apply iterative optimization techniques over the entire image are unacceptable for this application. ODT images are typically sparse; i.e., blood flow velocity is zero through most of the image with a few vessels spread throughout the image. Furthermore, blood vessels are generally circular (or elliptical if the vessel is oriented at an angle). The blood flow inside the vessels follows a parabolic distribution with respect to velocity, where the fastest velocity is in the center of the vessel. Because of these characteristics of ODT images, a feedforward neural network was chosen to help solve phase unwrapping problem. Neural networks are a good choice because forward propagation is simple and fast. Neural networks can often learn characteristics of the input data. If trained properly, the network can use information about the consistent structure of ODT images to unwrap more accurately. This approach is also desirable because of a neural network’s ability to generalize input data and ignore noise. This ability is useful in ODT systems, which produce noisy images (see Figure 3). In addition, the limited success of such networks in one dimension [17, 18] motivates their use in two dimensions.
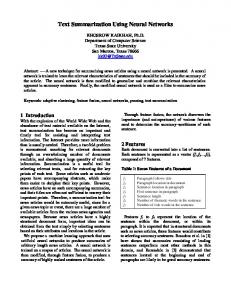
3. Proposed Algorithm We design a multilayer perceptron neural network (25 inputs, 5 hidden units, and 3 outputs) to detect phase jumps. For each pixel in an image, the network will look Neighboring pixels Current pixel
Figure 1: Neural network inputs
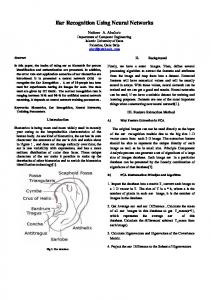
Table 1: Confusion matrix for the neural network
Positive No Jump Negative
Positive 0.89 0.0004 0
No Jump 0.11 0.9988 0.09
Negative 0 0.0008 0.91
at the surrounding pixels and determine the true phase of that pixel based on its wrapped value and the wrapped values of its neighbors. Each of the wrapped values of the neighboring pixels and the wrapped value of the current pixel will be an input into the network. Figure 1 shows the inputs to neural net. This neural network is then trained so that it predicts the relative jump from the pixel above it. Because we know that the phase at the top of ODT images must be zero, the network can start at the top of the image and unwrap the entire image in this way. The outputs of the network follow the method in [18]. The network has three outputs. The first output is the probability that the current pixel is in the 2π range above that of the pixel above it (a positive wrap). The second is the probability that the current pixel is in the same 2π range as the pixel above it (no wrap). And the third output is the probability that the current pixel is in the 2π range below that of the pixel about it (negative wrap). This network was then trained using the conjugate gradient method on 90 simulated ODT images. Because the images were simulated, the true phase values were available for training the network. Each training image contained around 2500 pixels and simulated blood vessels with different sizes, elliptical shapes, and magnitudes of blood flow. This translates to over 200,000 training vectors. A small set of additional images (10 images) was used to validate that the network did not overfit the training data. A number of network parameters were varied to determine which network architecture was most effective for the ODT phase unwrapping problem. Several different neighborhood sizes were tried, but a 5×5 neighborhood seemed to give the best results. Since each pixel in the neighborhood was an input to the network, the final network had 25 inputs. The number of hidden units was also varied, and a number around 5 seemed to give the best results. The hidden units used the hyperbolic tangent sigmoid activation function. Input and output units used linear activation functions. The feedforward neural network could be implemented in real time. At each pixel, the network would require 140 multiplications, 132 additions, and 5 table lookups (for the activation functions of the hidden units). If one assumes 2 instructions for a 256 word table lookup, then each pixel would take 150 DSP instructions; that is, 140
2
multiply-accumulates and 10 table lookup instructions. At 10 frames per second of 100×100 images, 15 million DSP instructions per second would be required.
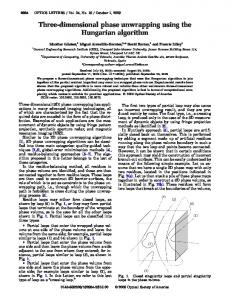
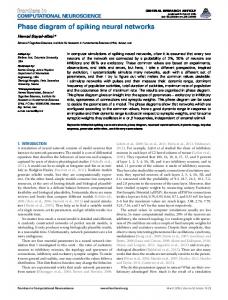
4. Results The algorithm was tested on 100 simulated images of blood vessels of different sizes, shapes, and magnitudes of flow. Figures 2-5 show one of the simulated blood vessels on which the neural network was tested. A threedimensional representation of the actual blood flow in this vessel being simulated is shown in Figure 2, where the height in the image represents the blood velocity at that point. Figure 3 shows the wrapped image of the blood vessel after all values are wrapped into the range [-π, π). Figure 4 shows the pixels around the small vessel and where the positive and negative wraps in this vessel were detected by the neural network. Black pixels represent positive phase wraps in the vertical direction, and white pixels represent negative phase wraps. Figure 5 shows all the pixels that are in a 2π range higher than the rest of the image. This vessel was unwrapped correctly by the neural network. On the 100 simulated images, the neural network correctly identified 90% of the phase jumps. Furthermore, it only detected jumps on 0.1% of the pixels on which no jump occurred. A confusion matrix for the classifier is given in Table 1. This matrix gives the percentage of pixels of the type given in the row that are classified as the type given in the column. Therefore, the fraction of pixels with no jump that were classified as having a positive jump is 0.0004.
5. Conclusions We propose a new phase discontinuity detection method based a feedforward neural network method. The method is pixel-parallel and requires only one pass over the phase image. The more difficult problem of ordering the phase discontinuities for proper phase unwrapping is not addressed in this paper. It has been shown [1] that the order in which the jumps are unwrapped makes a large difference in the final unwrapped image that is obtained. We simply unwrap along the columns of the image. Many phase unwrapping methods go through many iterations of optimization and take hours to complete even on small images. Forward propagation in neural networks is simple, and an entire image can be unwrapped in a fraction of a second. While all previous two-dimensional phase unwrapping methods [1, 6-18] were designed for general phase images, the neural network method can learn specific types of images. Other methods produce comparable results, but many of them take much longer than the proposed method.
In summary, using neural networks has been effective in unwrapping difficult ODT phase images. Another interesting problem would be to see if similar results could be obtained with other imaging techniques such as SAR and MRI by training on images from those systems. The neural network’s speed and accuracy in phase unwrapping specific types of images certainly merit further study. This method of phase unwrapping could prove to be useful for other image processing systems.
6. References [1] R. M. Goldstein, H. A. Zebker, C. L. Werner, “Satellite radar interferometry: two-dimensional phase unwrapping,” Radio Science, vol.23, no.4, pp. 713-20, July-Aug. 1988. [2] S. M. Song, S. Napel, N. J. Pelc, and G. H. Glover, “Phase unwrapping of MR phase images using Poisson equation,” IEEE Trans. Image Proc., vol. 4, no. 2, pp. 667-676, May 1995. [3] M. Milosevic, W. Schwartzkopf, T. E. Milner, B. L. Evans, and A. C. Bovik, “Low-Complexity Velocity Estimation in High-Speed Optical Doppler Tomography Systems”, Proc. IEEE Int. Conf. on Image Proc., Oct. 25-28, 1999, Vol. II, pp. 658-662, Kobe, Japan. [4] M. D. Kulkarni, T. G. van Leeuwen, S. Yazdanfar, J. A. Izatt. “Velocity-estimation accuracy and frame-rate limitations in color Doppler optical coherence tomography,” Optics Letters, vol.23, no. 13, pp. 10571059, July 1, 1998. [5] J. M. Tribolet, “A new phase unwrapping algorithm,” IEEE Trans. on Acoustics, Speech, and Signal Proc., vol. 25, no. 2, pp. 170-177, Feb. 1977. [6] D. J. Bone, “Fourier fringe analysis: the two-dimensional phase unwrapping problem,” Applied Optics, vol. 30, no. 25, pp. 3627-3632, Sep. 1991. [7] C. Prani, M. Giani, and N. Leuratti, “SAR interferometry: A 2-D phase unwrapping technique based on phase and absolute values infromation,” Proc. IEEE Int. Geosci. and Remote Sensing Sym., pp. 2043-2046, May 1990. [8] T. J. Flynn, “Two-dimensional phase unwrapping with minimum weighted discontinuity,” Journal Optical Society of America A, vol. 14, no. 10, pp. 2692-2701, Oct. 1997. [9] H. Takajo and T. Takahashi, “Least-squares phase estimation from phase differences,” Journal Optical Society of America A, vol. 5, no. 11, pp. 1818-1827, Nov. 1988. [10] W. L. Briggs, A Multigrid Tutorial, SIAM, 1987. [11] D. C. Ghiglia and M. D. Pritt, Two-Dimensional Phase Unwrapping: Theory, Algorithms, and Software, Wiley 1998. [12] A. Spik and D. W. Robinson, “Investigation of the cellular automata method for phase unwrapping and its implementation on an array processor,” Optics and Lasers in Engineering, vol. 14, no. 1, pp. 25-37, 1990. [13] B. J. Slocumb and J. Kitchen, “Polynomial phase parameter estimation-phase unwrapping algorithm,” Proc. IEEE Int. Conf. Acoustics, Speech, and Signal Proc, vol. 4, April 1922, 1994, Adelaide, Australia. [14] J. Valero and I. Cumming, “Comparative analysis of phase unwrapping methods using self-affine (fractal) models,”
3
Proc. IEEE Int. Geosci. and Remote Sensing Sym., pp. 336338, May 1996. [15] T. M. Kreis, R. Biedermann, and W. P. O. Juptner, “Evaluation of holographic interference patterns by artificial networks,” Proc. SPIE Conf on Interferometry: Techniques and Analysis, Jul 1995, vol. 2544, pp. 11-24. [16] Z. Wang, D. Yan, F. Liu, and A. He, “Phase unwrapping by random artificial neural networks,” Optical Technology in Fluid, Thermal, and Combustion Flow III, SPIE, San Diego, CA, pp. 28-31, July 1997.
[17] D. J. Tipper, D. R. Burton, and M. J. Lalor, “A Neural Network Approach to the Phase Unwrapping Problem in Fringe Analysis,” Nondestructive Testing and Evaluation, vol 12, pp. 391-400, 1996. [18] S. Hamzah, J. D. Pearson, P. J. Lisboa, and C. A. Hobson, “Phase Unwrapping in 3-D Shape Measurement Using Artificial Neural Networks,” Proc. IEE Conf. Image Proc. and its Applications, no. 443, pt. 2, Jul 14-17, 1997.
Figure 2: Simulated flow in a blood vessel without wrapping
Figure 3: Simulated flow in a blood vessel after wrapping
Figure 4: Location of positive (black) and negativate (white) phase jumps
Figure 5: Pixels in the range [π, 3π)
4