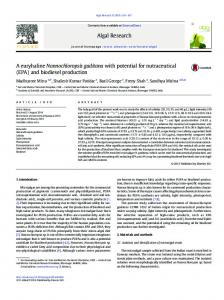
potentially be used with a variety of low-cost vegetable and animal fats without ... Graduate College ...... Estimated U.S. biodiesel production by calendar year.1.
University of Iowa
Iowa Research Online Theses and Dissertations
Summer 2011
Two-step biodiesel production using supercritical methanol and ethanol Ashley D'Ann Koh University of Iowa
Copyright 2011 Ashley D'Ann Koh This dissertation is available at Iowa Research Online: http://ir.uiowa.edu/etd/1239 Recommended Citation Koh, Ashley D'Ann. "Two-step biodiesel production using supercritical methanol and ethanol." PhD (Doctor of Philosophy) thesis, University of Iowa, 2011. http://ir.uiowa.edu/etd/1239.
Follow this and additional works at: http://ir.uiowa.edu/etd Part of the Chemical Engineering Commons
TWO-STEP BIODIESEL PRODUCTION USING SUPERCRITICAL METHANOL AND ETHANOL
by Ashley D'Ann Koh
An Abstract Of a thesis submitted in partial fulfillment of the requirements for the Doctor of Philosophy degree in Chemical and Biochemical Engineering in the Graduate College of The University of Iowa July 2011 Thesis Supervisors: Adjunct Associate Professor Gary A. Aurand Professor Gregory R. Carmichael
1
ABSTRACT Current industrial biodiesel production utilizes an alkali catalyst that can participate in saponification side reactions. The side reactions are reduced by using highly refined vegetable oil feedstocks. Also, the catalyst must be extracted from the final product in a washing step. A catalyst-free alternative for the production of biodiesel was developed. It involves two reaction steps: 1) triglyceride hydrolysis (fat splitting) at subcritical conditions to separate glycerol from fatty acids, and 2) fatty acid esterification in supercritical alcohol to form fatty acid alkyl esters. The catalyst-free process can potentially be used with a variety of low-cost vegetable and animal fats without undesired side reactions. The focus of this project was on the esterification reaction. Experiments were carried out with methanol and ethanol in a batch reaction system at supercritical conditions. High conversions could be attained at short reaction times. It was determined that the reaction followed second-order reversible kinetics. In addition, a novel Raman spectroscopic method was developed for the analysis of esterification reaction products.
Abstract Approved: ____________________________________ Thesis Supervisor ____________________________________ Title and Department ____________________________________ Date ____________________________________ Thesis Supervisor ____________________________________ Title and Department ____________________________________ Date
TWO-STEP BIODIESEL PRODUCTION USING SUPERCRITICAL METHANOL AND ETHANOL
by Ashley D'Ann Koh
A thesis submitted in partial fulfillment of the requirements for the Doctor of Philosophy degree in Chemical and Biochemical Engineering in the Graduate College of The University of Iowa July 2011 Thesis Supervisors: Adjunct Associate Professor Gary A. Aurand Professor Gregory R. Carmichael
Copyright by ASHLEY D'ANN KOH 2011 All Rights Reserved
Graduate College The University of Iowa Iowa City, Iowa
CERTIFICATE OF APPROVAL _______________________ PH.D. THESIS _______________ This is to certify that the Ph.D. thesis of Ashley D'Ann Koh has been approved by the Examining Committee for the thesis requirement for the Doctor of Philosophy degree in Chemical and Biochemical Engineering at the July 2011 graduation. Thesis Committee: ___________________________________ Gary A. Aurand, Thesis Supervisor ___________________________________ Gregory R. Carmichael, Thesis Supervisor ___________________________________ Julie L. P. Jessop ___________________________________ David G. Rethwisch ___________________________________ Horacio F. Olivo
To CMC
ii
ACKNOWLEDGMENTS I would like to thank my thesis advisor, Dr. Gary A. Aurand, for giving me the opportunity to work on this project and for guiding me through its completion. I am thankful to the Iowa Energy Center for funding this project. I would also like to thank my thesis committee members for their valuable suggestions for this project. I am grateful to Dr. Gregory R. Carmichael for providing funding support for my poster presentation at the ACS Spring 2010 National Meeting. I especially want to thank Dr. Julie L. P. Jessop for helping me in the development of the Raman spectroscopic analytical method and for her mentorship. I appreciate all the help that I received from the Aurand research group, especially Taiying Zhang, Kehinde Bankole, and all the undergraduate research assistants that have worked with me. I would like to thank Peter Hatch at the Glass Shop and Frank Turner at the Machine Shop for fabricating materials for my experiments. Special thanks to Linda C. Wheatley and Natalie J. Potter for ensuring that I met all my deadlines on time. Not in the least, I would like to thank my family and friends for their love and support. I want to thank the Angels, Sherrie R. Elzey and Jessica Rodriguez-Navarro, for sharing my laughs and tears. Most of all, I owe this accomplishment to the loving support of my husband, Christopher M. Comer.
iii
TABLE OF CONTENTS LIST OF TABLES ............................................................................................................. vi LIST OF FIGURES .......................................................................................................... vii CHAPTER 1 INTRODUCTION .........................................................................................1 CHAPTER 2 BACKGROUND ...........................................................................................3 2.1. Conventional Biodiesel Production ...........................................................3 2.2 Supercritical Fluids .....................................................................................6 2.3. Non-Catalytic Transesterification ..............................................................8 2.4. Non-Catalytic Two-Step Process .............................................................10 2.4.1. Subcritical Hydrolysis ...................................................................11 2.4.2. Supercritical Esterification ............................................................12 2.5. Analytical Methods ..................................................................................20 CHAPTER 3 OBJECTIVES ..............................................................................................21 CHAPTER 4 EXPERIMENTAL STUDY OF HYDROLYSIS REACTIONS IN FLOW REACTOR SYSTEMS ......................................................................23 4.1. Reactor Configurations ............................................................................23 4.1.1. Continuous Flow Microreactor System .........................................23 4.1.2. Tubular Reactor System ................................................................25 4.2. Survey of Analytical Methods for Hydrolysis and Esterification ...........27 4.2.1. Gas Chromatography-Mass Spectrometry ....................................28 4.2.2. Thin-Layer Chromatography .........................................................28 4.2.3. Nuclear Magnetic Resonance ........................................................30 4.3. Summary ..................................................................................................30 CHAPTER 5 DEVELOPMENT OF RAMAN SPECTROSCOPIC ANALYTICAL METHOD .......................................................................................................32 5.1. Materials and Methods ............................................................................33 5.1.1. Materials ........................................................................................33 5.1.2. Experimental Method ....................................................................33 5.2. Results and Discussion ............................................................................33 5.3. Summary ..................................................................................................38 CHAPTER 6 EXPERIMENTAL STUDY OF ESTERIFICATION REACTIONS IN A BATCH REACTOR ..............................................................................39 6.1. Materials and Methods ............................................................................39 6.1.1. Materials ........................................................................................39 6.1.2. Experimental Method ....................................................................39 6.1.3. Raman Spectroscopy .....................................................................40 6.2. Results and Discussion ............................................................................41 6.2.1. Effects of Temperature, Time, and Alcohol ..................................41 6.2.2. Reaction Kinetics...........................................................................43 6.2.2.1. Second-Order Forward, Second-Order Reverse..................44 iv
6.2.2.2. Second-Order A Forward, Second-Order Reverse ..............50 6.2.2.3 Autocatalytic Model .............................................................54 6.2.2.4. Other Models .......................................................................62 6.2.3. Phase Equilibrium Calculations ....................................................63 6.2.4. Discussion......................................................................................64 6.3. Summary ..................................................................................................66 CHAPTER 7 CONCLUSIONS AND RECOMMENDATIONS ......................................67 REFERENCES ..................................................................................................................71
v
LIST OF TABLES Table 1. Critical data for select substances. .........................................................................7 Table 2. Comparison of typical physical property values for liquids, SCFs, and gases. .....................................................................................................................7 Table 3. Summary of non-catalytic transesterification studies. ...........................................8 Table 4. Kinetic parameters for esterification (molar ratio of methanol to FFA = 7:1). .....................................................................................................................17 Table 5. Calculated kinetic parameters for the reversible second order reaction model...................................................................................................................19 Table 6. Standard mixtures of linoleic acid, ester, and alcohol. ........................................34 Table 7. Predicted percent conversions of known samples from the use of the methyl and ethyl esterification calibration curves (errors are standard error). ..................................................................................................................38 Table 8. Rate constants from the second-order forward, second-order reverse reaction model. ....................................................................................................48 Table 9. Activation energy and pre-exponential factors from the second-order forward, second-order reverse reaction model....................................................49 Table 10. Rate constants from the second-order A forward, second-order reverse reaction model. ..................................................................................................52 Table 11. Activation energy and pre-exponential factors from the second-order A forward, second-order reverse reaction model. .................................................54 Table 12. Keq values for the esterification of linoleic acid. ...............................................55 Table 13. Activation energies and pre-exponential factors from the autocatalytic reaction model. ..................................................................................................58 Table 14. Ea and A values from the second-order reversible reaction model. ...................61 Table 15. Estimated pressure of the reaction system. ........................................................64 Table 16. Advantages and disadvantages of the non-catalytic production of biodiesel.............................................................................................................69
vi
LIST OF FIGURES Figure 1. Estimated U.S. biodiesel production by calendar year. ........................................1 Figure 2. Transesterification reaction used in conventional biodiesel production. .............3 Figure 3. Conventional biodiesel production flow diagram. ...............................................4 Figure 4. Effect of molar ratio of alcohol to oil on methyl ester yields. ..............................5 Figure 5. Phase diagram of a pure substance. ......................................................................6 Figure 6. Arrhenius plot of the non-catalytic transesterification of rapeseed oil in methanol, where: Tc = critical temperature of methanol (240 C). ....................10 Figure 7. Two-step non-catalytic production of biodiesel. ................................................11 Figure 8. Effect of temperature on the yield of methyl esters at 20 MPa (from Minami and Saka): (a) methyl esterification of oleic acid, and (b) transesterification of rapeseed oil. Both reactions were carried out with a volumetric ratio of alcohol to fatty acid or triacylglcreol of 1.8:1......................13 Figure 9. Effect of the molar ratio of methanol to oleic acid on the yield of methyl esters at 270 C and 10 minutes. The dashed line represents data for transesterification (from Kusdiana and Saka). ....................................................14 Figure 10. Comparison of the theoretical yields calculated from the autocatalytic model and experimental data for esterification reactions at 270 C and 20 MPa at various volumetric ratios of methanol to oleic acid. ......................15 Figure 11. Effect of temperature on the yield of methyl esters at 10 MPa, 430 rpm and molar ratio of methanol to FFA of 7:1. .....................................................16 Figure 12. Arrhenius plot for the esterification of fatty acids in supercritical methanol. ..........................................................................................................17 Figure 13. Fit of the reversible second order reaction model with experimental data (from Pinnarat and Savage): (a) liquid phase (low temperature), and (b) supercritical phase. ...........................................................................................18 Figure 14. Arrhenius plot for the forward and reverse reactions. ......................................19 Figure 15. Continuous flow microreactor system. .............................................................24 Figure 16. Continuous flow reactor system. ......................................................................25 Figure 17. Effect of pressure and varying residence times on the conversion of oil to free fatty acids..............................................................................................26 Figure 18. Effect of temperature on the conversion of oil to free fatty acids. The lines are present to aid in trend visualization. ..................................................27
vii
Figure 19. Example of a separation of a vegetal lipid after lipid hydrolysis, where: TG = triacylglycerols, 1,3-DAG = 1,3-diacylglycerols, 1,2-DAG = 1,2diacylglycerols, FFA = free fatty acids, 2-MG = 2-monoacylglycerols, and 1-MG = 1-monacylglycerols. ....................................................................29 Figure 20. Raman spectra of standard solutions of ethanol, ethyl linoleate, and linoleic acid. The molar ratio of ethanol to a mixture of ethyl linoleate and linoleic acid was constant for each solution at 20:1. .................................34 Figure 21. Calibration curve for the Raman spectroscopic analysis of methyl esterification reaction products. .......................................................................35 Figure 22. Calibration curve for the Raman spectroscopic analysis of ethyl esterification reaction products. .......................................................................36 Figure 23. Validation of the calibration curve for methyl esterification. ..........................37 Figure 24. Validation of the calibration curve for ethyl esterification. .............................37 Figure 25. Effect of temperature and reaction time on the conversion to methyl ester. Error bars are 95% confidence intervals. ...............................................42 Figure 26. Effect of temperature and reaction time on the conversion to ethyl ester. Error bars are 95% confidence intervals. .........................................................42 Figure 27. Fit of the second-order forward, second-order reverse reaction model to methyl esterification data. Error bars are 95% confidence intervals. ..............46 Figure 28. Fit of the second-order forward, second-order reverse reaction model to ethyl esterification data. Error bars are 95% confidence intervals. .................47 Figure 29. Arrhenius plot for the second-order forward, second-order reverse reaction model for methyl esterification. .........................................................48 Figure 30. Arrhenius plot for the second-order forward, second-order reverse reaction model for ethyl esterification. ............................................................49 Figure 31. Fit of the second-order A forward, second-order reverse reaction model to methyl esterification data. Error bars are 95% confidence intervals. ..........51 Figure 32. Fit of the second-order A forward, second-order reverse reaction model to ethyl esterification data. Error bars are 95% confidence intervals. .............52 Figure 33. Arrhenius plot for the second-order A forward, second-order reverse reaction model for methyl esterification. .........................................................53 Figure 34. Arrhenius plot for the second-order A forward, second-order reverse reaction model for ethyl esterification. ............................................................53 Figure 35. Linearized plots of the autocatalytic model for methyl esterification. .............56 Figure 36. Linearized plots of the autocatalytic method for ethyl esterification. ..............56
viii
Figure 37. Arrhenius plot for the autocatalytic model for methyl esterification. Error bars are 95% confidence intervals. .........................................................57 Figure 38. Arrhenius plot for the autocatalytic model for ethyl esterification. Error bars are 95% confidence intervals. ..................................................................58 Figure 39. Linearized plots of the second-order reversible model for methyl esterification. ....................................................................................................59 Figure 40. Linearized plots of the second-order reversible model for ethyl esterification. ....................................................................................................60 Figure 41. Arrhenius plot for the second-order reversible model for methyl esterification. Error bars are 95% confidence intervals. ..................................60 Figure 42. Arrhenius plot for the second-order reversible model for ethyl esterification. Error bars are 95% confidence intervals. ..................................61 Figure 43. Fit of the first-order A forward reaction model to methyl esterification data. Error bars are 95% confidence intervals. ................................................62 Figure 44. Fit of the first-order A forward reaction model to ethyl esterification data. Error bars are 95% confidence intervals. ................................................63
ix
1
CHAPTER 1 INTRODUCTION The demand for energy derived from biorenewable resources is ever-increasing due to the volatility of oil prices and mounting concerns over energy security and climate change. Biodiesel, an alternative fuel derived from vegetable oil, has been gaining popularity in recent years, as shown in Figure 1.1
Figure 1. Estimated U.S. biodiesel production by calendar year.1
In the United States, soybean oil is the most common feedstock for biodiesel production.2 Biodiesel is a critical component in the shift to biofuels because it is compatible with existing diesel engines (compression ignition engines) without the need for any modifications,3 and production technology is immediately available.
2
However, current biodiesel production technology requires the use of a corrosive liquid catalyst that is very sensitive to the quality of the feed oil. This catalyst is susceptible to the production of unwanted by-products that can congest reactors and cause production downtime. Consequently, highly refined oil must be used and this increases production costs. Thus, to address this prevailing issue, a non-catalytic method for the production of biodiesel was investigated in this study. Further background information on current industrial biodiesel production will be discussed in the next chapter, as well as the current state of research on the use of sub- and supercritical fluids in biodiesel production. The specific objectives of this project will be outlined in Chapter 3 and the results of each portion of the project will be presented in subsequent chapters.
3
CHAPTER 2 BACKGROUND 2.1. Conventional Biodiesel Production Conventional biodiesel production uses the transesterification reaction, with the aid of a catalyst, to produce biodiesel. The reaction is shown in Figure 2. Triacylglycerols of oil react with an aliphatic alcohol, typically methanol since it is cheapest, in the presence of a catalyst. The most common catalysts used are alkaline, namely, sodium methoxide, sodium hydroxide, or potassium hydroxide. The products of the reaction are fatty acid alkyl esters, otherwise known as biodiesel, and glycerol.
Figure 2. Transesterification reaction used in conventional biodiesel production.
Figure 3 presents a generic process flow diagram of commercial biodiesel production.4 Since transesterification is a reversible reaction, excess alcohol is used to drive the reaction forward. Van Gerpen et al.5 reported that 60–100% excess methanol is generally used to make sure that the reaction reaches completion. The reaction also requires about 1% (based on the weight of oil) of the base catalyst that ultimately ends up
4
in the glycerol layer of the products. Sometimes, a second transesterification reaction is performed, after removal of glycerol, to maximize biodiesel yield.
Figure 3. Conventional biodiesel production flow diagram.4
The reaction time depends on the molar ratio of alcohol to oil and the temperature of the reaction. In Figure 4, Freedman et al.6 showed that 98% conversion to soybean oil methyl esters can be obtained in 1 hour when using a 6:1 molar ratio at a temperature of 60 C.
5
Figure 4. Effect of molar ratio of alcohol to oil on methyl ester yields.6
The biodiesel product and glycerol co-product streams require a significant number of refining steps, shown within the bottom dotted box in Figure 3. At least 25% of the equipment costs is associated with these steps, according to a process model that estimates these costs for a 10 million gal/year facility.7 Furthermore, the quality of the feed oil in this process must be low in moisture, phosphorus, and fatty acids to attain higher process yields and prevent the formation of undesired by-products, particularly soap, which would result in additional refining steps. Thus, highly refined feedstock, such as refined bleached deodorized (RBD) oil is used and it is the most expensive raw material, accounting for 88% of the total annual operating costs.7 Thus, to overcome these issues associated with the use of this catalyst, a non-catalytic method using supercritical alcohols was explored in this research.
6
2.2 Supercritical Fluids Supercritical fluids (SCFs) possess unique solvent properties that allow them to be used in various industrial applications. The most widely known application is in the decaffeination of coffee.8 More recently, SCFs have been used as benign solvents in various production stages in the microelectronics,9 pharmaceutical,10, 11 biomedical,12 and biofuels13 industries. To better understand what SCFs are, the generalized phase diagram of a pure substance in Figure 5 will aid in the visualization of the concepts presented. The critical point is located at the upper end of the vapor pressure curve. At this point, the distinction between liquid and gas disappears.14 Table 1 lists the critical properties of some common solvents.
Figure 5. Phase diagram of a pure substance.
7 Table 1. Critical data for select substances.15 Substance Name
Molecular Weight
Critical Temperature (K)
Critical Pressure (bar)
Critical Density (g/cm3)
Methanol
32.042
512.58
80.96
0.2720
Ethanol
46.069
516.25
63.84
0.2760
Water
18.015
647.13
220.55
0.3220
Carbon dioxide
44.010
304.19
73.82
0.4682
At conditions above the critical point (i.e., critical temperature and pressure), the fluid exists in a supercritical phase where it exhibits properties that are in between those of a liquid and a gas. More specifically, SCFs have a liquid-like density and gas-like transport properties (i.e., diffusivity and viscosity). This can be seen in Table 2, wherein the typical values of these properties are compared between the three fluids. Moreover, the dissolving power of SCFs can be adjusted by manipulating temperature and pressure.
Table 2. Comparison of typical physical property values for liquids, SCFs, and gases.16 Property Density (g/mL) Diffusivity (cm2/s) Viscosity (Pas)
Liquid
SCF
Gas
1
0.3
10-3
5 × 10⁻⁶
10-3
0.1
10-3
10-4
10-5
The numerous advantages to using SCFs in chemical synthesis are summarized in Jessop and Leitner’s book on the topic.17 Environmentally, most substances that are used as SCFs do not contribute to smog nor do they damage the ozone layer. Carbon dioxide and water, specifically, pose no acute ecotoxicity. Also, no liquid waste is produced by carbon dioxide and other volatile SCFs. In addition to their environmental benefits, most SCFs are noncarcinogenic and nontoxic. All these benefits combined with their unique
8
chemical properties make SCFs an attractive alternative to address the current need to use green solvents that are more environmentally friendly. 2.3. Non-Catalytic Transesterification To minimize the downstream refining steps associated with the conventional biodiesel production process, Diasakou et al.18 investigated the thermal non-catalytic transesterification of soybean oil with methanol. Reactions were carried out at temperatures below the critical temperature of methanol (240 C), at 220 C and 235 C, in a batch stirred tank reactor. Since then, several researchers have continued to study the sub- and supercritical transesterification of various seed oils. Pinnarat and Savage19 have reviewed the studies that have been published to date. Table 3 below is adapted from their summary.
Table 3. Summary of non-catalytic transesterification studies.19 Authors
Year
Oil Type
Temperature, Pressure
Molar Ratio (Alcohol:Oil)
Reaction Time
Reactor Type
Conversion
Saka and Kusdiana20
2001
rapeseed
350 °C, 450 bar
42:1
4 min
5 mL Inconel-625
95%
Demirbas21
2002
hazelnut kernel
350 °C
41:1
5 min
100 mL cylindrical autoclave SS
95%
Madras et al.22
2004
sunflower
350 °C, 200 bar
40:1
40 min
8 mL reactor SS
96%
Bunyakiat et al.23
2006
coconut, palm kernel
350 °C, 190 bar
42:1
7 min
tubular flow reactor SS
95%
He et al.24
2007
soybean
280 °C, 250 bar
42:1
30 min
200 mL reactor
90%
He et al.25
2007
soybean soybean
310 °C, 350 bar 100−320 °C (gradually heat)
40:1 40:1
25 min 25 min
75 mL tube reactor 75 mL tube reactor
77% 96%
Silva et al.26
2007
soybean (ethanol)
350 °C, 200 bar
40:1
15 min
24 and 42 mL tubular reactor SS
80%
Demirbas27
2008
cottonseed (methanol) cottonseed (ethanol)
230 °C 230°C 230 °C
41:1 41:1 41:1
8 min 8 min 8 min
cylindrical autoclave SS cylindrical autoclave SS
98% 75% 75%
9
Several of these studies attempted to model the kinetics of the reaction. Diasakou et al.18 applied the model of a three-step reaction mechanism wherein the triacylglycerol is broken down into a diacylglycerol then a monoacylglycerol before fully liberating the glycerol as shown below:
Triacylglycerol + Methanol → Diacylglycerol + Fatty Acid Methyl Ester 1 Diacylglycerol + Methanol → Monoacylglycerol + Fatty Acid Methyl Ester Monoacylglycerol + Methanol → Glycerol + Fatty Acid Methyl Ester
(2) (3)
It was assumed that each step was irreversible due to the high molar ratio of alcohol to oil used. Also, each step was assumed to be of first order with respect to each reacting component. The experimental data was in agreement with the calculated values. Other kinetic studies22,
24, 26, 28
used a simplified model consisting only of the
overall reaction, as shown below:
Triacylglycerol + 3Methanol → Glycerol + 3Fatty Acid Methyl Esters
(4)
Once again, the reaction was assumed to be irreversible due to the high molar ratio of alcohol to oil used and it was also assumed to be first order in the triacylglycerol. Kusdiana and Saka28 observed a discontinuity between the two linear regions in the Arrhenius plot, the subcritical region at low temperature and the supercritical region at high temperature, as shown in Figure 6. He et al.24 also observed a similar discontinuity in the non-catalytic transesterification of soybean oil in methanol. This discontinuity could be attributed to the critical point of the reaction mixture. The separate linear region at temperatures below this point could be limited by methanol solubility at low temperatures.29
10
Figure 6. Arrhenius plot of the non-catalytic transesterification of rapeseed oil in methanol, where: Tc = critical temperature of methanol (240 C).28
A wide range of activation energies were reported due to the variability of reaction conditions across studies. Conflicting reports30, 31 currently exist on the effect of unsaturated fatty acids on the reaction rate. Furthermore, Dasari et al.29 suggest that the metal surfaces of the reactor could increase the reaction rate. Thus, more research is needed to fully understand the effects of each of the different variables on the kinetics of non-catalytic transesterification.19 2.4. Non-Catalytic Two-Step Process High reaction temperatures and molar ratios of alcohol to oil are required for the non-catalytic transesterification of seed oils to biodiesel. Kusdiana and Saka28 determined the optimum temperature for this process to be 350 C while maintaining a molar ratio of 42:1 (alcohol to oil). It is an energy intensive process, particularly with respect to the methanol recycle loop.32 Hence, to lower these reaction conditions, Kusdiana and Saka33
11
suggested a two-step non-catalytic process. First, a hydrolysis step, performed under subcritical water conditions, splits the fatty acids from the glycerol backbone of the triacylglycerol. Second, the free fatty acids are esterified with supercritical methanol to produce biodiesel. The process flow diagram is shown in Figure 7.
Figure 7. Two-step non-catalytic production of biodiesel.33
In contrast to conventional biodiesel production using a homogeneous catalyst, this process has fewer post-reaction refining steps. The reduction in the number of production steps could provide significant cost savings. Also, less waste would be produced since there is no catalyst involved. 2.4.1. Subcritical Hydrolysis The hydrothermal hydrolysis of triacylglycerols is a mature process that dates all the way back to 1854.34 Since then, several processes have been developed,35 namely, the Twitchell process,36 the Colgate-Emery synthesis,37 and the Eisenlohr process.38
12
The Colgate- Emery synthesis is still the predominantly used process in industry today for the splitting of fats and oils.39 Typical operating conditions for this process are 250 C and 5.07 MPa. Under these conditions, a 2 hour reaction can yield 97% fatty acids.40 However, since the oil to water ratio is 2:1, it is regarded more as a steam-based process than a subcritical one.41 Thus, Holliday et al.41 and King et al.35 studied hydrolysis reactions under sub- and supercritical conditions where the density is more liquid-like (>0.5 g/mL). Using a tubular flow reactor, King et al.35 could achieve 90–100% yields of free fatty acids at 330 C to 340 C and oil to water ratios of 1:2.5 and 1:5 in short residence times (10–15 min). Furthermore, the reactor system was equipped with a view cell, allowing for the observation of the phase change during the reaction. The reaction mixture became a single phase at 339 C, indicating the complete miscibility of the oil and water. It was our aim to use subcritical hydrolysis of soybean oil to generate free fatty acids that would subsequently be used in esterification experiments. The capacity of an existing continuous flow microreactor system in the Aurand research laboratory was evaluated for use in this process. 2.4.2. Supercritical Esterification The esterification of fatty acids is typically carried out with the use of acid catalysts.42, 43 The earliest documentation of the use of high temperatures and pressures for these types of reactions includes a number of patents for the production of rosin acid esters.44-46 Few papers have been published on the esterification of fatty acids exclusively with sub- and supercritical alcohols for the purposes of producing biodiesel.33, 47-51 Some studies have also looked into non-catalytic esterification in tandem with solid acid catalysts.52-54
13
Compared to non-catalytic transesterification, non-catalytic esterification of fatty acids can be performed at lower temperatures and pressures, as well as with lower molar ratios of alcohol to fatty acids. Most of the studies cited above have focused on temperatures between 250 C and 320 C. Figure 8 shows the effect of temperature on the yield of methyl esters obtained from non-catalytic esterification and non-catalytic transesterification reactions that were conducted under the same conditions.48 Looking at the data trend for 320 C, a 90% yield of methyl ester can be obtained for the noncatalytic methyl esterification of oleic acid in less than 10 minutes. On the other hand, the non-catalytic transesterification of rapeseed oil only yielded 30% methyl esters in the same amount of time. Moreover, even after 30 minutes reaction time, only a 65% yield was obtained. Thus, esterification occurs much more rapidly than transesterification at lower temperatures.
(a)
(b)
Figure 8. Effect of temperature on the yield of methyl esters at 20 MPa (from Minami and Saka48): (a) methyl esterification of oleic acid, and (b) transesterification of rapeseed oil. Both reactions were carried out with a volumetric ratio of alcohol to fatty acid or triacylglcreol of 1.8:1.
Similarly, the molar ratio of alcohol to fatty acid affects the yield of methyl ester in the same way that temperature does. This can be seen in Figure 9 showing the yield of methyl esters for different molar ratios used in both non-catalytic esterification and
14
transesterification reactions. Remarkably, for non-catalytic esterification, a high yield of methyl ester (>90%) was obtained using a molar ratio of only 3:1. A tenfold increase in molar ratio is required for non-catalytic transesterification to achieve the same yield. Hence, non-catalytic esterification utilizes less alcohol and can provide significant cost savings in terms of raw material consumption and energy usage for recovery.
Figure 9. Effect of the molar ratio of methanol to oleic acid on the yield of methyl esters at 270 C and 10 minutes.33 The dashed line represents data for transesterification (from Kusdiana and Saka28).
Since non-catalytic esterification for biodiesel production is a recent innovation, there is a lack of information on the kinetics of the reaction. Minami and Saka48 studied the kinetics for both the hydrolysis and esterification steps in the two-step process developed by Kusdiana and Saka.33 Tubular flow reactors, made of Hastelloy C-276, were used in their study and they employed an autocatalytic reaction mechanism to model both reactions. The esterification reaction sequence is shown below:
Fatty Acid- + H+ (dissociation of Fatty Acid)
(5)
Fatty Acid + H+ ⇄ Fatty Acid+ (protonation of Fatty Acid)
(6)
Fatty Acid
⇄
15
Fatty Acid+ + Methanol ⇄ Fatty Acid Methyl Ester+ + Water (methyl esterification) (7) Fatty Acid Methyl Ester+ ⇄ Fatty Acid Methyl Ester + H+ (deprotonation)
(8)
In the first step, a fatty acid is dissociated to release a hydrogen ion (a proton). This is followed by the protonation of the carbonyl oxygen of the fatty acid. Alcohol then attacks the protonated carbonyl group, and a protonated ester is formed upon the release of a water molecule. A final proton transfer yields the fatty acid methyl ester. Figure 10 compares this model with the experimental data. The theoretical values calculated using the model appear to agree with the experimental data. However, neither the calculated reaction rate constants nor the activation energies were reported.
Figure 10. Comparison of the theoretical yields calculated from the autocatalytic model and experimental data for esterification reactions at 270 C and 20 MPa at various volumetric ratios of methanol to oleic acid.48
16
Alenezi et al.51 investigated the esterification of a mixture of fatty acids, predominantly oleic acid (88%), with supercritical methanol in a batch stirred-tank reactor made of stainless steel. They used a one-step reversible reaction scheme:
Fatty Acid + Alcohol
⇄
Fatty Acid Methyl Ester + Water
(9)
They found that this reversible second order reaction model fit their data, as shown in Figure 11. The rate constants of the forward and reverse reactions were found using non-linear optimization. An Arrhenius plot, as shown in Figure 12, was generated to obtain the activation energies of the reactions. All the kinetic parameters calculated are shown in Table 4.
Figure 11. Effect of temperature on the yield of methyl esters at 10 MPa, 430 rpm and molar ratio of methanol to FFA of 7:1.51
17
Figure 12. Arrhenius plot for the esterification of fatty acids in supercritical methanol.51
Table 4. Kinetic parameters for esterification (molar ratio of methanol to FFA = 7:1).51 k1 (min-1[mol/mol of fatty acid]-1)
k-1 (min-1[mol/mol of fatty acid]-1)
250 C
0.035
0.037
270 C
0.050
0.054
290 C
0.110
0.054
320 C
0.230
0.063
R2
0.98
0.97
5.0 × 10⁵ min-1[mol/mol of fatty acid]-1
7.9 min-1[mol/mol of fatty acid]-1
72 kJ/mol
23.2 kJ/mol
Temperature
Pre-exponential factor (A) Activation energy (Ea)
Pinnarat and Savage50 also used this reversible second order reaction model to determine the kinetics of the esterification of oleic acid in sub- and supercritical ethanol. Ethanol was used in their reactions because it can be derived from biomass and limited research has been done with this alcohol.55 Additionally, biodiesel properties (e.g. cloud point) could potentially be improved through the use of longer chain alcohols.56
18
They primarily used quartz batch reactors to eliminate any potential catalytic effects from the use of a metal reactor. However, their comparison with 316 stainless steel reactors showed minimal differences in yield between the two reactor materials used. They also looked into the effect of phase behavior on the kinetics of the reaction. Process simulation software, ASPEN Plus version 2006.5, was used to perform vaporliquid calculations to estimate the reaction pressure and the composition and amount of each phase present in the reactor. Figure 13 shows the agreement between the model and their experimental data for single-phase reactions at low temperatures (liquid) and high temperatures (supercritical). The Arrhenius plot is shown in Figure 14 and the all the kinetic parameters determined from the model and the plot are tabulated in Table 5.
Figure 13. Fit of the reversible second order reaction model with experimental data (from Pinnarat and Savage50): (a) liquid phase (low temperature), and (b) supercritical phase.
19
Figure 14. Arrhenius plot for the forward and reverse reactions.50
Table 5. Calculated kinetic parameters for the reversible second order reaction model.50 Volumetric filling factor
Ethanol:Oleic acid molar ratio
k1 (L mol−1 min−1)
k−1 (L mol−1 min−1)
150 C
0.80
7:1
(4.5 ± 1.1)E−04
(2.2 ± 1.6)E−03
200 C
0.80
7:1
(2.8 ± 0.6)E−03
(3.2 ± 1.9)E−03
230 C
0.56
10:1
(5.9 ± 0.8)E−03
(4.4 ± 1.1)E−02
270 C
0.26
35:1
(1.4 ± 0.3)E−02
(8.7 ± 5.9)E−02
290 C
0.26
35:1
(2.4 ± 1)E−02
(1.6 ± 1.6)E−01
Temperature
This model was also tested on two-phase reactions, however the model underpredicted the conversions. Further work is required in understanding the thermodynamics, transport phenomena (especially in varying reactor configurations), and reaction kinetics for the esterification of fatty acids in sub- and supercritical alcohols in order to design an economically feasible process. Given the dearth of research in this area, it was our objective to investigate the kinetics of esterification of linoleic acid, which is the main component of soybean oil, in supercritical methanol and ethanol. Experiments at various temperatures and reaction
20
times were conducted and several kinetic models were investigated to determine the best fit to the data. 2.5. Analytical Methods The numerous methods used in biodiesel analysis have been reviewed by Knothe57 and recently updated by Monteiro et al.58 Gas chromatography (GC) is the most common method for determining biodiesel produced from transesterification. However, this method requires sample derivatization that does not allow the simultaneous detection of free fatty acids and their alkyl esters. Thus, it is not applicable for the analysis of esterification reaction products. Titration is a method that has been reported in some papers to determine the conversion of free fatty acids to esters.52, 59, 60 Based on standard specifications such as the American Oil Chemists’ Society (AOCS) official method Cd 3d-63,61 the acid values of the feed and product are used in a simple calculation to determine conversion. However, this method requires sample volumes that are too large for products from experiments carried out in microreactor systems. Spectroscopic methods can readily characterize both carboxylic acid and ester products62 and they also have been studied for their application in biodiesel reaction monitoring.58 Ghesti et al.63 used Raman spectroscopy to quantify transesterification reaction products by comparing the differences in several bands of the vegetable oil and ethyl ester spectra. They also successfully correlated their results with several Nuclear Magnetic Resonance (NMR) methods.64 Raman spectroscopy is a non-destructive method of analysis and it can be used in real-time, in-line monitoring of reactions, even in microreactors.65 Due to these features and the availability of the instrument, a Raman spectroscopic method was developed for the analysis of reaction products from the esterification of fatty acids.
21
CHAPTER 3 OBJECTIVES The overall aim of this research was to develop an environmentally friendly and economical method of producing biodiesel under sub- and supercritical conditions by first hydrolyzing oil to obtain free fatty acids and then esterifying the free fatty acids to produce the alkyl esters. Since the hydrolysis of fats and oils is a mature industrial technology, focus was placed on the esterification reaction. The kinetics of the reaction were of particular interest because it provides information that is essential in reactor design and scale-up. It also allowed for the comparison with conventional catalytic biodiesel production. Thus, the specific objectives of this research were:
To develop a Raman spectroscopic analytical method to measure the extent of reaction for methyl and ethyl esterification.
To determine the effect of temperature, reaction time, and alcohol on the conversion of the esterification reaction.
To develop an accurate reaction model that predicts the progress of the esterification reaction at short (10 min). First, a Raman spectroscopic method was developed for the analysis of the
esterification products since it did not require any sample modification, and spectral data could be obtained from small sample volumes. A calibration curve was developed with the use of prepared solutions that simulated the progress of the esterification reaction. It was validated by predicting the reaction conversion of samples with known concentrations before use in the analysis of actual reaction products generated from experiments. Second, esterification reactions were carried out in a batch reactor at various temperatures and reaction times. Two alcohols were investigated in this study: 1) methanol, a low cost alcohol most commonly used in commercial biodiesel production,
22
and 2) ethanol, a biorenewable solvent. Experiments conducted at short reaction times (