BMC Proceedings
BioMed Central
Open Access
Proceedings
Two-step intermediate fine mapping with likelihood ratio test statistics: applications to Problems 2 and 3 data of GAW15 Ritwik Sinha and Yuqun Luo* Address: Division of Genetic and Molecular Epidemiology, Department of Epidemiology and Biostatistics, Case Western Reserve University School of Medicine, Wolstein Research Building, 10900 Euclid Avenue, Cleveland, Ohio 44106, USA Email: Ritwik Sinha -
[email protected]; Yuqun Luo* -
[email protected] * Corresponding author
from Genetic Analysis Workshop 15 St. Pete Beach, Florida, USA. 11–15 November 2006 Published: 18 December 2007 BMC Proceedings 2007, 1(Suppl 1):S146 Marsha A Wilcox, John
Genetic S Witte, Qiong Analysis Yang, Workshop Andreas Ziegler, 15: Gene Laura Expression Almasy Analysis and Jean and W MacCluer Approaches to Detecting Proceedings Multiple Functional Loci
http://www.biomedcentral.com/content/pdf/1753-6561-1-S1-info.pdf Heather J Cordell, Mariza de Andrade, Marie-Claude Babron, Christopher W Bartlett, Joseph Beyene, Heike Bickeböller, Robert Culverhouse, Adrienne Cupples, E Warwick Daw, Josée Dupuis, Catherine T Falk, Saurabh Ghosh, Katrina A Goddard, Ellen L Goode, Elizabeth R Hauser, Lisa J Martin, Maria Martinez, Kari E North, Nancy L Saccone, Silke Schmidt, William Tapper, Duncan Thomas, David Tritchler, Veronica J Vieland, Ellen M Wijsman,
This article is available from: http://www.biomedcentral.com/1753-6561/1/S1/S146 © 2007 Sinha and Luo; licensee BioMed Central Ltd. This is an open access article distributed under the terms of the Creative Commons Attribution License (http://creativecommons.org/licenses/by/2.0), which permits unrestricted use, distribution, and reproduction in any medium, provided the original work is properly cited.
Abstract Construction of precise confidence sets of disease gene locations after initial identification of linked regions can improve the efficiency of the ensuing fine mapping effort. We took the confidence set inference, a framework proposed and implemented using the Mean test statistic (CSI-Mean) and improved the efficiency substantially by using a likelihood ratio test statistic (CSI-MLS). The CSI framework requires knowledge of some disease-model-related parameters. In the absence of prior knowledge of these parameters, a two-step procedure may be employed: 1) the parameters are estimated using a coarse map of markers; 2) CSI-Mean or CSI-MLS are applied to construct the confidence sets of the disease gene locations using a finer map of markers, assuming the estimates from Step 1 for the required parameters. In this article we show that the advantages of CSI-MLS over CSI-Mean, previously demonstrated when the required parameters are known, are preserved in this two-step procedure, using both the simulated and real data contributed to Problems 2 and 3 of Genetic Analysis Workshop 15. In addition, our result suggests that microsatellite data, when available, should be used in Step 1. Also explored in detail is the effect of the absence of parental genotypes on the performance of CSI-MLS.
Background With the advent of high-throughput genotyping technologies, traditional gene mapping methods, including linkage approaches, may be improved upon to realize the full potential of the wealth of genotype data available today. In particular, there has been considerable development in recent years in "intermediate fine mapping" approaches [1] in which data with dense marker maps from linkage studies are used to construct confidence sets of the disease gene locations following identification of linked regions.
In addition to enhancing objectivity of the ensuing fine mapping effort by containing the disease gene locations with a pre-specified probability, a precise confidence set will reduce costs in genotyping and multiple testing. A recent study on several competing approaches to intermediate fine mapping shows that the confidence set inference (CSI) framework is particularly promising [1]. In CSI, every genomic location within the identified broad linked region is tested against the null of being the disease Page 1 of 5 (page number not for citation purposes)
BMC Proceedings 2007, 1(Suppl 1):S146
http://www.biomedcentral.com/1753-6561/1/S1/S146
gene location, and the 95% confidence set contains all the genomic locations where the null is not rejected at the 5% level. Papachristou and Lin [2] first proposed the CSI framework and implemented it by reformulating the traditional mean linkage test statistic (CSI-Mean). We recently proposed a more efficient alternative, CSI-MLS [3], by reformulating a likelihood ratio test (LRT) statistic, the maximum LOD score (MLS) [4]. The CSI procedures require knowledge of some disease-model-related parameters. When these parameters are known, CSI-MLS exhibits substantial advantages over CSI-Mean: 1) it provides more precise confidence sets for disease gene locations with correct coverage probabilities; 2) it is computationally more efficient. In the absence of knowledge of these parameters, a two-step procedure that constructs the confidence sets in the second step following the estimation of the required parameters in the first step may be adopted [5]. In this article we show that the advantages of CSI-MLS are preserved in the two-step procedures. Also investigated are the effects of three different strategies in Step 1 and the impact of the absence of parental genotype data.
Methods In the CSI framework using affected-sibling pair (ASP) data, each genomic location (τ) in a broad region with linkage evidence is tested to see whether it is the putative disease causing locus (τ*). In contrast to the traditional null hypothesis of no linkage, a new hypothesis is tested: H0τ : τ = τ* versus HAτ : τ ≠ τ*.
(1)
A 95% confidence set for the disease gene location is constructed to contain all the genomic locations where the above null hypothesis is not rejected at the 5% level. Any traditional linkage test statistic can be reformulated to test hypothesis (1), including the mean test statistic (CSIMean, [2]) and the MLS statistic (CSI-MLS, [3]). Both procedures require knowledge of some disease-model-related parameters, one possibility being zi = P(τ*IBD = i), i = 0, 1, 2, where τ*IBD is the identical by descent (IBD) allele sharing between two affected siblings at the disease locus. CSI-MLS provides more precise confidence sets compared to CSI-Mean when zi values are known [3]. In the realistic case in which these parameters are not known a priori, a two-step procedure that relies on the availability of two sets of marker data on the same set of ASPs can be adopted [5]: 1) identify broad linked regions using one set of markers, termed the coarse map (e.g., microsatellite markers). Genomic locations with a nonparametric linkage statistic (KAC) [6] above 2.33 are identified as showing suggestive linkage. For the linkage peak in each region that exceeds the above cut-off point, obtain the maximum likelihood estimates of the zi parameters. 2) Using a set of denser markers, termed the fine map (e.g.,
single-nucleotide polymorphism (SNP) markers), and restricted to a region of, say, 25 cM on either side of the linkage peak, we constructed confidence sets employing CSI-MLS or CSI-Mean with the parameter estimates from Step 1. Because confidence sets so obtained may not be contiguous, we employed the smoothing scheme suggested by Papachristou and Lin [5]. Traditionally, a whole-genome linkage scan is often pursued with microsatellite markers, and then the preliminary linkage signals are followed up using a denser, usually SNP, map. It was this practice that motivated the two-step CSI procedures. However, with the advent of high-density genome-wide SNP chips, this practice may soon be replaced by a single, dense SNP map on which all individuals are genotyped. The 5 K and 10 K chips have already been successfully employed in linkage analysis. In such situations, we propose using a subset of the SNP markers as the coarse map and another mutually exclusive subset of the SNP markers as the fine map. Within each of these two maps, markers are chosen to be in linkage equilibrium with each other (r2 < 0.02), as linkage disequilibrium between markers can lead to erroneous estimates of multipoint IBD sharing probabilities [7]. We apply our methods to Genetic Analysis Workshop 15 simulated data and the North American Rheumatoid Arthritis Consortium (NARAC) data, with the phenotype being the binary trait of the affection status of rheumatoid arthritis (RA). The microsatellite and SNP data (excluding the dense SNPs for the simulated data) on chromosome 6, containing the HLA-DRB1 locus, are used. Three strategies/settings, two using the microsatellite markers and one using the SNP markers, were compared in terms of their effects on the estimation of the disease-modelrelated parameters and the construction of the confidence sets. The two-step CSI-MLS and CSI-Mean were compared in terms of the precision of the confidence sets that include the DRB1 locus with a pre-determined probability. In what follows, we consider all of the 100 replicates, with a sample size of n (250, 500, or 750) per replicate taken to be the first n families of each replicate. Estimates of means, standard deviations, etc., of the parameters of interest are based on the 100 replicates of the respective sample size. "Answers" were known.
Results Central to the CSI framework is the knowledge of the IBD probabilities at the trait locus, z0, z1, and z2. While these are not available from the "Answers" to the simulated data, a good guess is the MLE at the HLA-DRB1 locus obtained from the chromosome 6 SNP data on all families from all available replicates. The MLE (z0 = 0.101, z1 = 0.441, z2 = 0.458) will be considered to be the true values of the corresponding parameters. The information con-
Page 2 of 5 (page number not for citation purposes)
BMC Proceedings 2007, 1(Suppl 1):S146
http://www.biomedcentral.com/1753-6561/1/S1/S146
tent [8] at the trait locus was 0.97, suggesting that these estimates are very close to the true values. In what follows, we investigate the effect of the coarse map on the Step 1 parameter estimates, followed by a comparison of the performance of CSI-MLS and CSI-Mean in the two-step setting. We also study the influence of the availability of parental genotype information. Finally, both CSI-MLS and CSI-Mean are applied to the NARAC data.
0.03 and -0.03 for MS1, MSINT, and SNP1, respectively) and z2 being overestimated (for 750 ASPs, the bias was 0.01, 0.03 and 0.02 for MS1, MSINT, and SNP1, respectively). Comparison of CSI-MLS and CSI-Mean in the two-step procedure Using the estimates of zi values from Step 1, CSI-Mean and CSI-MLS confidence sets are constructed with a fine map of 350 SNPs on the chromosome. Besides the three settings MS1, MSINT, and SNP1, we added the group TRUE, where the CSI confidence sets were constructed assuming the true parameter values. Mean lengths of the confidence sets, together with the empirical coverage levels, are given in Table 2. The coverage levels under TRUE are close to the nominal 95%, while they are higher than the nominal levels in all other situations. We compared the precision of the confidence sets in terms of their lengths, since the coverage is at least up to the nominal level. Under each setting, the confidence sets get tighter with increased sample size. CSI-MLS provides substantially shorter confidence sets than CSI-Mean, the effect being more pronounced when parental genotypes are not available, when the sample size is large, and when true parameter estimates are not used. For example, the reduction of the mean length is 49% (8.7 cM) with MSINT using 750 ASPs, when parental genotypes are missing. When parental genotypes are available, knowing the true values of the IBD sharing probabilities at the trait locus results in the most precise confidence sets. MSINT provides the most precise confidence sets among the three two-step procedures, with the precision close to optimal. SNP1 comes next, being only slightly less precise than MSINT. However, when parental genotypes are not available, MSINT provides much more precise intervals than all other three scenarios, with TRUE yielding the least precise intervals.
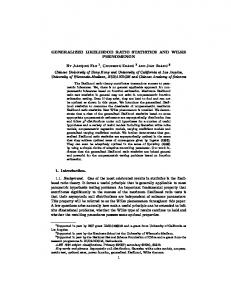
Estimates of (z0, z1, z2) at the disease gene locus Three estimation strategies/settings have been explored in Step 1 of CSI: 1) the MLE is evaluated at the microsatellite marker with the largest KAC score; 2) the MLE is evaluated at the location, possibly between two microsatellite markers, with the highest KAC score; 3) the MLE is evaluated with a set of SNPs that is mutually exclusive with the SNPs used in the second step as the coarse map. The three strategies are referred to as MS1, MSINT, and SNP1, respectively. The microsatellite and the SNP coarse maps contain 41 microsatellites and 292 SNPs, respectively. With parental data, the information content at the disease gene locus is 0.85 for the microsatellite map and 0.88 for the SNP map; without parental data, it is 0.56 for both. The precision of the parameter estimates were evaluated in terms of root mean squared errors (RMSEs). Table 1 provides the RMSEs of the estimates of the disease gene locations (peak of KAC scores) and of the zi values, with and without parental genotypes. All estimates improve with increasing sample size. With parental genotypes, SNP1 yields slightly better estimates of zi values than MS1 and MSINT. This finding agrees well with the information content of the maps. However, when parental genotypes are not available, MS1 yields much more precise estimates than SNP1 and MSINT. This is also reflected in the density plot of the estimates given in Figure 1. There seems to be a systematic bias in the estimates under all three setting, z1 being underestimated (for 750 ASPs, the bias was -0.01, -
Table 1: Root mean squared errors of the estimates of the disease location, z0, z1, and z2
No. ASPs
Strategy
With parental genotypes
Without parental genotypes
Location (cM)
z0
z1
z2
Location (cM)
z0
z1
z2
250
MS1 MSINT SNP1
4.9 3.8 2.4
0.020 0.020 0.018
0.033 0.033 0.031
0.035 0.033 0.033
5.6 4.8 4.7
0.023 0.024 0.028
0.035 0.041 0.041
0.034 0.040 0.036
500
MS1 MSINT SNP1
3.7 1.9 1.3
0.016 0.016 0.014
0.026 0.026 0.025
0.027 0.024 0.023
4.0 2.3 3.4
0.017 0.017 0.020
0.027 0.037 0.038
0.025 0.035 0.028
750
MS1 MSINT SNP1
3.6 1.5 1.3
0.015 0.013 0.012
0.021 0.022 0.020
0.023 0.020 0.019
3.6 1.8 2.9
0.014 0.015 0.019
0.024 0.034 0.036
0.021 0.033 0.026
Page 3 of 5 (page number not for citation purposes)
BMC Proceedings 2007, 1(Suppl 1):S146
http://www.biomedcentral.com/1753-6561/1/S1/S146
provides a confidence set that is 4.6 cM shorter than that provided by CSI-Mean.
Discussion
Figure Density 1of the estimates of z1 and z2 Density of the estimates of z1 and z2. Density of the estimates of z1 and z2, with and without parental genotypes, using 750 ASPs. The vertical lines represent the true values of the parameters.
Application to real data The MSINT strategy appears to be the best in terms of providing precise confidence intervals for the underlying disease locus. Hence, we used this strategy with the CSI-MLS and the CSI-Mean to measure their ability in localizing the HLA-DRB1 locus on chromosome 6, a known causal locus for RA. Our sample comprised 308 of the smallest families (