This regime is referred to as the plastic regime. The study of plastic deformation using large-scale computer simulations will be the focus of this chapter.
CHAPTER 14
Ultra–Large Scale Simulations of Dynamic Materials Failure Markus J. Buehler, Huajian Gao Max Planck Institute for Metals Research, Stuttgart, Germany
CONTENTS 1.
Introduction . . . . . . . . . . . . . . . . . . . . . . . . . . . . . . . . . . . . .
2.
Motivation for the Atomistic Viewpoint: Nanoscale Governs Dynamics of Materials Failure . . . . . . . . . . . . . . . . . . . . . . . . . 4
2
3.
Classical Molecular Dynamics versus ab initio Methods: Potentials and Applications . . . . . . . . . . . . . . . . . . . . . . . . . . . 5
4.
Empirical Interatomic Potentials . . . . . . . . . . . . . . . . . . . . . . 4.1. Pair Potentials . . . . . . . . . . . . . . . . . . . . . . . . . . . . . . . 4.2. Multibody Potentials . . . . . . . . . . . . . . . . . . . . . . . . . .
5.
Physical and Mechanical Properties of Solids . . . . . . . . . . . . . 9 5.1. Unstable Stacking Fault Energy . . . . . . . . . . . . . . . . . . 9 5.2. Fracture Surface Energy . . . . . . . . . . . . . . . . . . . . . . . 10 5.3. Mechanical Properties of Crystals: Elastic Constants, Wave Velocities, Virial Stress, and Strain . . . . . . . . . . . 10
6.
Simulation Techniques . . . . . . . . . . . . . . . . . . . . . . . . . . . . . 6.1. Classical Molecular Dynamics . . . . . . . . . . . . . . . . . . . 6.2. Advanced Molecular Dynamics Methods . . . . . . . . . . . 6.3. Concurrent and Hierarchical Multiscale Methods . . . . . 6.4. Continuum Approaches Incorporating Atomistic Information . . . . . . . . . . . . . . . . . . . . . . . . . 6.5. Discussion . . . . . . . . . . . . . . . . . . . . . . . . . . . . . . . . .
8 8 9
11 11 12 14 18 18
7.
Classical Molecular Dynamics Implemented on Supercomputers . . . . . . . . . . . . . . . . . . . . . . . . . . . . . . . . . . 19
8.
Analysis Techniques: Visualization and Data Processing . . . . . 8.1. Visualization Techniques . . . . . . . . . . . . . . . . . . . . . .
ISBN: 1-58883-042-X/$35.00 Copyright © 2005 by American Scientific Publishers All rights of reproduction in any form reserved.
20 20
Handbook of Theoretical and Computational Nanotechnology Edited by Michael Rieth and Wolfram Schommers Volume X: Pages (1–41)
1
2
Ultra–Large Scale Simulations of Dynamic Materials Failure
8.2.
Postprocessing of Atomistic Simulation Data: Visualization of Crystal Defects . . . . . . . . . . . . . . . . . . 9. Using Very Large Simulations to Study Different Mechanisms of Deformation . . . . . . . . . . . . . . . . . . . . . . . . . 9.1. Brittle Fracture and Defect Dynamics . . . . . . . . . . . . . 9.2. Ductile Failure . . . . . . . . . . . . . . . . . . . . . . . . . . . . . 9.3. Deformation Mechanisms in Materials under Geometric Confinement . . . . . . . . . . . . . . . . . . . . . . . 9.4. Materials Science–Biology Interactions and Modeling of Nanostructures . . . . . . . . . . . . . . . . . . . . . 10. Conclusions and Discussion . . . . . . . . . . . . . . . . . . . . . . . . . References . . . . . . . . . . . . . . . . . . . . . . . . . . . . . . . . . . . . .
21 23 23 28 31 36 37 38
1. INTRODUCTION When materials are deformed, they display a small regime in which deformation is reversible. This is referred to as the elastic regime. Once the forces on the material are increased, deformation becomes irreversible, and the deformation of a body caused by an applied stress remains after the stress is removed. This regime is referred to as the plastic regime. The study of plastic deformation using large-scale computer simulations will be the focus of this chapter. In the classical picture, materials failure can be divided into two generic types: brittle and ductile. In the brittle case, atomic bonds are broken as material separates along a crack front. The type of failure of such materials is often characterized by the simultaneous motion of thousands of small cracks, as observed when glass shatters. This type of failure usually happens rapidly, as following a large impacts cracks propagate at velocities close the speed of sound [18, 44–46]. An enormous amount of research has been carried out over the last hundred years or so and has been summarized in recent books [16, 44]. The origin of fracture research dates back to the early 20th century in studies by Griffith [56] and Irwin [76]. The Griffith criterion provides a quantitative estimate of the condition under which material fails, and it is based on simple energetic and thermodynamic arguments. The Griffith criterion states that materials fail when the mechanical elastic energy released by crack propagation equals the fracture surface energy 2�s : G = 2�s �
(1)
where G is the mechanical energy release rate [44]. This thermodynamic view of fracture was the foundation for the field of fracture mechanics. The continuum mechanics theory of fracture is a relatively well-established framework. In the continuum theory, the stress field in the vicinity of the crack tip is given by the asymptotic solution [12, 44, 157] and exhibits a universal character independent of the details of the applied loading. The loading of cracks can be separated into three different modes. Mode I is opening loading, mode II is shear loading, and mode III is antiplane shear loading. In ductile failure, a catastrophic event such as rapid propagation of thousands of cracks does not occur. Tough materials like metals do not shatter: They bend easily because plastic deformation occurs through the motion of dislocations in the material. Ductility is sometimes defined as the property of a metal that allows it to be drawn into wires or filaments. Since their discovery in the early 1930s, dislocations have helped to explain many of the perplexing physical and mechanical properties of metals, some of which remained mysterious even until this date [128]. One of the topics that were discussed controversially is that the resistance of materials to shear is significantly less than the theoretical strength [54, 89, 128]. This phenomenon can only be explained by the existence of dislocations and their motion. The behavior of dislocations in crystals is very complex and involves multiple mechanisms for generation and annihilation, as it is summarized in [67]. Collective events may occur through interaction among many dislocations or between dislocations and other defects such as grain boundaries. Dislocation motion can be envisioned as similar to the movement of a caterpillar.
Ultra–Large Scale Simulations of Dynamic Materials Failure
3
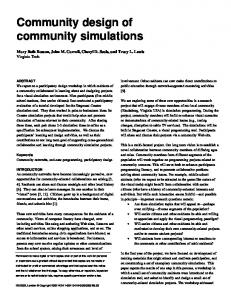
Figure 1 shows the mechanism of dislocation motion through crystals. Moving the dislocation through the crystal is energetically more favorable than shearing the crystal as a whole. Similarly, it is easier to push a ripple through a carpet than to pull the carpet at one end over a sticky floor. The tendency of materials to be ductile or brittle depends on their atomic microstructure. The face-centered-cubic (fcc) packing is known to have a strong propensity toward ductility; body-centered-cubic (bcc) is much less so. Glasses do not have extended crystallinity because atoms are randomly packed. They have no slip-planes and mostly exhibit brittle failure with little ductility. Although atomic bonds are broken by stretching the solid in brittle fracture, the sliding between planes is achieved by shearing the solid in ductile failure. The ease of the atomic slip depends on the atomic arrangement of the slip planes. The more compact, and consequently less bumpy, planes slip better. Ductile versus brittle failure is schematically summarized in Fig. 2. Figure 2a shows brittle materials failure by propagation of cracks, and Fig. 2b depicts ductile failure by generation of dislocations at a crack tip. Although brittle and ductile failure have both been studied extensively, for a long time it remained unclear what separate ductile from brittle failure. What is the origin of such fundamentally different behaviors? It was established that the origin of brittle versus ductile behavior is at the atomic scale. Studies by Rice and Thomson [111] revealed that there exists a competition between ductile (dislocation emission) and brittle (cleavage) mechanisms at the tip of a microcrack. Imperfections such as microcracks are considered the seeds for failure and exist in real materials. The model by Rice and Thomson has been recently extended to include a new material parameter, the unstable stacking fault energy �us [109, 110]. The unstable stacking fault energy describes the resistance of the material to motion of dislocations, whereas the fracture surface energy describes the resistance of materials to fracture. At a crack tip, the unstable stacking fault energy competes with the fracture surface energy �s [44] [see Eq. (1)]. Once these material parameters are known, it is often possible to quantitatively predict material behavior. Recent research results indicate that dislocation-based processes and cleavage are not the only mechanisms for deformation of materials. Materials under geometrical confinement are also referred to as materials in small dimensions. The behavior of these materials is characterized by the interplay of interfaces (e.g., grain boundaries), constraints (e.g., substrates), and free surfaces. Examples for such materials are nanocrystalline materials [152, 153] or ultrathin submicron films [23, 24]. It was shown by computer simulation that in such materials, with grain sizes of tens of nanometers and below, deformation can be completely dominated by grain boundary processes. Even though such material behavior is ductile (as materials can be bent without cleavage), no dislocation motion is required. Because of the small sizes of the grains, dislocations can not be generated, because, for instance, Frank– Read sources are too large to fit within a grain, or because dislocations are energetically very expensive under very small geometrical confinement, as shown in earlier publications [43, 102, 103]. This leads to unexpected mechanisms of deformation, such as motion of partial dislocations.
τ
τ
τ
τ
Figure 1. Mechanism of motion of dislocations. The crystal is sheared apart by motion of an extra half plane from the left to the right. Once the half plane has propagated through the crystal, it has slipped by one atomic plane.
4
Ultra–Large Scale Simulations of Dynamic Materials Failure
brittle crack propagation
(a)
ductile dislocation emission
(b)
Figure 2. (a) Brittle versus (b) ductile materials failure. In brittle failure a large number of cracks propagate through the material, breaking it apart. In ductile failure, such catastrophic event does not occur and the material bends through the motion of dislocations.
This chapter is organized as follows: We present an overview of today’s modeling of materials failure from a very fundamental, atomistic points of view. Such research often involves resource demanding computer simulations. Because ultralarge scale simulations heavily rely on supercomputers, we review the state-of-the-art computing and the associated programming techniques. We show that classical molecular dynamics with empirical potentials are, at this time, the only feasible approach to model the large length scale associated with the plasticity of materials. We continue with a brief discussion of the simulation tools, data processing, and visualization techniques, as these are key to the analysis of simulation results. We discuss a broad selection of research activities, highlight several topics, and provide a more in-depth discussion of selected areas. Specific focus is given to brittle and ductile behavior of materials and to recent progress in plasticity of materials in small dimensions and in particular nanostructured materials.
2. MOTIVATION FOR THE ATOMISTIC VIEWPOINT: NANOSCALE GOVERNS DYNAMICS OF MATERIALS FAILURE Historically, the classical physics of continuum has been the basis for most theoretical and computational tools of engineers. In early stages of computational plasticity, dislocations and cracks were often treated using linear continuum mechanics theory, relying on numerous phenomenological assumptions. Over the last decades, there has been a new realization that understanding nanoscale behavior is required for understanding how materials fail (e.g., [4, 89]). This is partly because of the increasing trend to miniaturization as relevant length scales of materials approach several nanometers in modern technology. Once the dimensions of materials reach submicron length scales, the continuum description of materials is questionable and the full atomistic information is necessary to study materials phenomena.
5
Ultra–Large Scale Simulations of Dynamic Materials Failure
Atomistic simulations have proved to be a unique and powerful way to investigate the complex behavior of dislocations, cracks, and grain boundary processes at a very fundamental level. Atomistic methods are often the core in modern materials modeling. One of the strengths and the reason for the great success of atomistic methods is its very fundamental viewpoint of materials phenomena. The only physical law that is put into the simulations is Newton’s law and a definition of how atoms interact with each other. Despite this very simple basis, very complex phenomena can be simulated. Unlike many continuum mechanics approaches, atomistic techniques require no a priori assumption on the defect dynamics. Drawbacks of atomistic simulations are the difficulty of analyzing results and the large computational resources necessary to perform the simulations. This becomes more evident as the simulation sizes increase to systems with billions of atoms [8]. Once the atomic interactions are chosen, the complete material behavior is determined. Although in some cases it is difficult to find the correct potential for a specific material, atomic interactions can often be chosen such that generic properties common to a large class of materials are incorporated (e.g., ductile materials). This allows us to design “model materials” to study specific materials phenomena. Despite the fact that model building has been in practice in fluid mechanics for many years, the concept of “model materials” in materials science is relatively new [8]. However, atomic interactions can be calculated very accurately for a specific atomic interaction, using quantum mechanics methods such as the density functional theory [123]. Richard Feynman says in his famous Feynman’s Lectures in Physics [40]: If in some cataclysm all scientific knowledge were to be destroyed and only one sentence passed on to the next generation of creatures, what statement would contain the most information in the fewest words? I believe it is the atomic hypothesis that all things are made of atoms—little particles that move around in perpetual motion, attracting each other when they are a little distance apart, but repelling upon being squeezed into one another. In that one sentence, you will see there is an enormous amount of information about the world, if just a little imagination and thinking are applied.
This underlines the that a natural choice for studying materials failure at a fundamental level are atomistic simulations. The atomistic level provides a most fundamental, sometimes referred to as the ab initio, description of the failure processes [4]. Many materials phenomena are multiscale phenomena. For a fundamental understanding, simulations should ideally capture the elementary physics of single atoms and reach length scales of thousands of atomic layers at the same time. Recently, an increasing number of researchers have grown to consider the computer as a tool to do science, similar to how experimentalists use their lab to perform experiments. Computer simulations have been sometimes referred to as “computer experiments.” Designing smart computer experiments is the key to a successful simulation.
3. CLASSICAL MOLECULAR DYNAMICS VERSUS AB INITIO METHODS: POTENTIALS AND APPLICATIONS Adapting the atomistic viewpoint, a fundamental description of the materials can be obtained. However, characterization of the interatomic interactions remains an important issue, as these are the core of atomistic modeling and simulation methods. The major differences between various atomistic methods are how atomic interactions are calculated. With the expression for the potential energy �i of a particle given by the chosen potential, the total energy of the system Etot can be obtained by summing over all particles. The force vector f for each particle is obtained by the gradient of the total energy with respect to a given particle location in space: f = −�Etot
(2)
where Etot =
N � i=1
�i
(3)
6
Ultra–Large Scale Simulations of Dynamic Materials Failure
and N is the total number of particles. During the last decades, numerous potentials with different levels of accuracy have been proposed, each having its problems and strengths. The approaches range from accurate quantum-mechanics based treatments (e.g., first-principle density functional theory methods, or tight-binding potentials) [29], to multibody potentials (e.g., embedded atom approaches as proposed in [42]) to the most simple and computationally least-expensive pair potentials (e.g., Lennard–Jones [LJ]) [9, 32]. The first molecular dynamics study was a LJ model of Argon 1964 [108]. In density functional theory and related methods, the full quantum mechanical equations are solved to calculate the force on particles and are therefore numerically most expensive. Because the full quantum mechanical information is incorporated, the complete chemistry of atoms can be modeled (e.g., chemical reactions). Multibody potentials are often constructed based on quantum mechanical understanding of the binding, which is then devised into an empirical equation (e.g., electrons are not treated explicitly in embedded atom potentials (EAM) potentials but appear as electron density instead). Pair potentials assume that the force between atoms only depends on the distance between neighboring atoms. One of the recent developments is ab initio molecular dynamics, as reported by the group around Parrinello (Car–Parinello molecular dynamics) [29, 91]. In this method, only valence electrons are treated explicitly, and the interaction with the core electrons is treated based on pseudopotentials. Most quantum mechanics methods scale as O�N 3 � or worse (the Car– Parinello method, depending on the algorithm chosen, can scale slightly better), whereas molecular dynamics methods based on empirical potentials scale linearly with the number of particles as O�N �. Any scaling other than linear is a severe computational burden and basically inhibits usage of the method for very large simulations. An overview over the most prominent materials simulation techniques is shown in Fig. 3. In the plot we indicate which length- and timescale quantum mechanics–based methods, classical molecular dynamics methods, and numerical continuum mechanics methods can reach. Quantum mechanics–based treatments are still limited to very short time- and length scales, on the order of a few nanometers and picoseconds. Once empirical interactions are assumed in classical molecular dynamics schemes, the length- and timescales achieved are dramatically increased, approaching micrometers and nanoseconds [8]. Continuum mechanics–based simulation tools can treat virtually any length scale, but they lack a proper description at small scales and are therefore often not suitable to describe materials failure processes in full detail (see discussion in Section 2). Figure 4 shows typical length and timescales for time sec 102 Classical continuum theories
100 10–2 10–4
Mesoscopic theories
10–6 10–8 10–10
Classical molecular dynamics
2004 Quantum mechanics based methods 10–10
10–10 ..10–6
100
length m
Figure 3. Overview of different atomistic simulation tools. The plot summarizes quantum mechanics–based simulation approaches (e.g., [29]), classical molecular dynamics [9] as well as continuum mechanics based methods (e.g., Refs. [14, 80]).
7
Ultra–Large Scale Simulations of Dynamic Materials Failure time sec 102 100
Biological and biomimetic materials
10–2 10–4
Proteins
10–6
Nanotechnology
Microtechnology
10–8
NEMS Nanoelectronics
MEMS Elecronics
10–10
Organs
Tissues
Cells
10–10
Structural materials e.g. foams
10–10 ..10–6
100
length m
Figure 4. Typical length and timescales for a number of technological areas where materials modeling and simulation are essential. By overlaying this plot on Fig. 3, it can be seen that there are presently no suitable methods to treat much of the nano- and biomaterials technology within realistic length and timescales. Taken from H. Gao [47].
a number of technological areas in which materials modeling and simulation are essential. An overlay of this plot on Fig. 3 shows that new development of simulation tools is also important for technological applications, as for instance in the development of NEMS and MEMS. For length scales ranging from tens of nanometers to microns, classical molecular dynamics methods are the only feasible simulation technique at this time. Although the role of electrons is completely hidden, for many materials phenomena, modern potentials yield reasonable results compared to quantum mechanics–based treatments [93]. The success of classical molecular dynamics approach is further demonstrated in Fig. 5. Over the last decades, the computer power available for atomistic simulations has dramatically increased. Figure 5 summarizes the increase in computer power over the past and illustrates how big systems could be treated using classical molecular dynamics. The need for military applications has strongly driven the development of supercomputers (e.g., ASCI
Computer power
"Petaflop" computers
Earth Simulator (Japan) 40 TFLOP ASCI White (CA, USA) 12 TFLOP 109 atoms
"Teraflop" IBM Almaden Spark "Gigaflop"
105 atoms
102 atoms
108 atoms
106 atoms
Year 1965
1975
1985
1995
2003
2012
Figure 5. Development of computational power and the application in molecular dynamics simulations over the last few decades [4]. Petaflop computers expected by the end of the current decade will allow simulations with hundreds of billions of atoms.
8
Ultra–Large Scale Simulations of Dynamic Materials Failure
computers, which are among the most powerful supercomputers of the world, are being used to maintain the U.S. stockpile of nuclear weapons). The most important conclusion from the discussion of the different methods is that the only feasible approach to study mechanical properties of materials at length scales up to micrometers is classical molecular dynamics. The remainder of this chapter will be focused on the classical atomistic methods with empirical potentials.
4. EMPIRICAL INTERATOMIC POTENTIALS Here we describe some of the most common empirical potentials.
4.1. Pair Potentials Pair potentials are the simplest choice for describing atomic interactions. For some materials, interatomic interactions are best described by pair potentials. Prominent example are noble gases (e.g., Argon) [108] and Coulomb interactions. Pair potentials have also proven to be a good model for more complex materials such as SiO2 [133]. The potential energy of an atom is given by �i �r� =
Ni �
�ij �rij �
(4)
j=1
where Ni is the number of neighbors of atom i. Usually, the number of neighbors is limited to the second- or third-nearest neighbors. Popular pair potentials for the simulation of metals include the Morse potential [97] and the LJ potential, which are described, for instance, in Refs. [9, 32, 148]. The LJ 12-6 potential is a very good model for the nobel gases like argon and is defined as �� �12 � �6 � Ni � � � (5) 4�0 − �ij �rij � = rij rij j=1 Alternatively, the LJ potential can also be fitted to the elastic constants and lattice spacing of metals, but the result has significant shortcomings with respect to the stacking fault energy and the elasticity of metals. The term with power 12 represents atomic repulsion, and the term with power 6 represents attractive interactions. The parameter � scales the length, and �0 the energy of atomic bonds. Often, pair potentials are cut off smoothly with a spline cutoff function (see, e.g., Refs. [148] or [61]). Another popular pair potential is the Morse potential, defined as �ij �rij � = D 1 − exp −��rij − r0 � 2
(6)
Fit of this potential to different metals (as well as different forms of the Morse potential) can be found, for instance, in [83]. The parameter r0 stands for the nearest-neighbor lattice spacing, and D and � are additional fitting parameters. The Morse potential is computationally more expensive than the LJ potential because of the exponential term (however, this is more realistic for many materials). An indication of when to use pair potentials can be the requirement of saving computational resources. Another important advantage is that fewer parameters are involved (simplifying parameter studies and fit to different materials). For example the LJ potential has only two parameters, and the Morse potential has only three. The potentials given by Eqs. (5) and (6) are strongly nonlinear functions of the radius r. In some cases it is advantageous to linearize the potentials around the equilibrium position and to define the so-called harmonic potential 1 �ij �rij � = a0 + k�rij − r0 �2 2
(7)
where k is the spring constant, and r0 the equilibrium spacing, and a0 is a constant parameter. An important drawback of pair potentials is that elastic properties of metals can not be
9
Ultra–Large Scale Simulations of Dynamic Materials Failure
modeled correctly. An implication of the fact that the energy of an atom depends only on pair interactions is that the so-called Cauchy relation holds, c1122 = c1212 [13]. This condition is not valid in most real materials.
4.2. Multibody Potentials The idea behind multibody potentials is to incorporate more specific information on the bonds between atoms than simply the distance between two neighbors. In such potentials, the energy of bonds therefore depends not only on the distance of atoms but also on its local environment. This allows us to include quantum mechanical effects such as the influence of the electron gas in metals. In the case of metals, interactions of atoms can be quite accurately described using EAM or n-body potentials (e.g., [42, 93] or variations of the classical EAM potential [13, 31]). Other very similar multibody potentials are based on the effective medium theory (EMT) [150, 151]. Good models for metals like copper and nickel have been published, whereas other metals (e.g., Al) are more difficult to model with such approaches [161, 163]. The elastic constants can be fitted much better to real materials when the Cauchy relation is violated. The EAM potential for metals is typically given in the form �ij �r� =
Ni �
�ij �rij � +
�� i
i=1
f ���
(8)
j
where � is the local electron density. The potential features a contribution by a two-body term (repulsion and attraction of atoms) in conjunction with a multibody term, which accounts for the local electronic environment of the atom. For other materials like silicon, bond-order multibody potentials have been proposed (e.g., Tersoff potential [129], or Stillinger–Weber potential [124]; see also discussion in Ref. [70]). This accounts for the fact that in many materials, the order of the bonding has a significant effect on the strength of the material. Recent studies have been carried out using the MEAM potential parameterized for silicon [126]. Multibody potentials also allow the elastic properties of metals to be better fitted (e.g., [13]). In most empirical potentials, it is common that only the small-strain elastic properties are fitted. This could sometimes lead to problems in modeling strongly nonlinear phenomena such as brittle fracture.
5. PHYSICAL AND MECHANICAL PROPERTIES OF SOLIDS Methods to devise physical and mechanical properties of solids from interatomic potentials are critical to evaluate the results.
5.1. Unstable Stacking Fault Energy The unstable stacking fault energy �us is an important quantity describing the resistance of the material to nucleation of dislocations. Dislocations in fcc crystals split into two partial dislocations. The stacking fault energy �sf is an important quantity that determines the separation of such partial dislocations. The separation of the partials is inversely proportional to the stacking fault energy dsep ∼
1 �sf
(9)
In Ref. [161], the generalized stacking fault energy curves are calculated for different EAM potentials of fcc metals. The authors show that the resulting curves show similar characteristics but vary in their agreement with the experimental estimates of the intrinsic stacking fault energy. The curves have been used to obtain estimates of the unstable stacking fault energy �us [109]. Figure 6 shows such curves calculated from atomistic simulation and also
10
Ultra–Large Scale Simulations of Dynamic Materials Failure
0.07 M&F V&C O&J BAM
0.06
[111]
γus
Energy/atom (eV)
0.05 [112] C B A C B
0.04 0.03 0.02
γsf
0.01
A A
0 B
0
0.5
1
1.5
Displacement in [112] direction (in 10–10 m)
A
(a)
(b)
Figure 6. Calculation of generalized stacking fault curves for different potentials fitted to nickel. We consider potentials by Oh and Johnson [104] (O&J), Angelo et al. [10] (AFB), Mishin et al. [92] (M&F) as well as Voter and Chen [143, 146]. Plot (a) illustrates the calculation method of the GSF curve by sliding two parts of the crystal along the 112 direction. Plot (b) shows the GSF curves for the four different potentials.
indicates how �us and �sf are calculated from such curves. Figure 6a shows the calculation method of the GSF curve by sliding two parts of the crystal along the 112 direction, and Fig. 6b shows the GSF curves for four different potentials [10, 92, 104, 143, 146]. Note that the best agreement of �sf to first principle calculation results are obtained from the potential proposed by Mishin et al. [92] and Angelo et al. [10]. This finding is in agreement with the results reported in Ref. [161]. Because of the nature of the stacking fault, the generalized stacking fault energy curve depends on non-nearest-neighbor interactions. This is important to consider when models based on pair potentials are developed. In [161] it is further shown that the EAM models produce the same value for the dimensionless constant �us /��slip bp � as the simpler LJ interatomic potential. This indicates that the LJ pair potential should produce the same behavior as EAM models for a given type of plastic deformation [8].
5.2. Fracture Surface Energy The fracture surface energy �s is an important quantity for the nucleation and propagation of cracks. It is defined as the energy required to generate a unit distance of a pair of new surfaces. The Griffith criterion predicts that the crack tip begins to propagate when the crack tip energy release rate G reaches the fracture surface energy 2�s [56] [see Eq. (1)]. Classical theory predicts that cracks tend to propagate along direction of lowest fracture surface energy. In crystalline materials, however, it is crucial to also consider hyperelastic effects near the crack tip related to the failure strain in different crystal orientation [1].
5.3. Mechanical Properties of Crystals: Elastic Constants, Wave Velocities, Virial Stress, and Strain Mechanical properties of solids are often related to the elastic properties, as many theories of materials failure are based on such theories (e.g., in theories of fracture [44] and dislocations [67]). To compare atomistic simulation results to the continuum theory of elasticity, it is crucial that the elastic properties can be accurately determined. Finding elastic properties for a given atomistic microstructure is a homogenization problem. The lattice is a periodic, rapidly varying function, whereas elastic properties are associated with a continuum. A possible numerical approach to determine elastic properties from the atomistic level is via the Cauchy–Born rule using techniques proposed by Gao and coworkers [80, 81], referred to as the virtual internal bound (VIB) method.
Ultra–Large Scale Simulations of Dynamic Materials Failure
11
Additional definitions of virial stress [158] and strain [163] further allow a coupling of the atomistic scale with continuum theories [131, 158]. This allows for an immediate comparison of the different levels of detail. The correct coupling of quantities like stress or strain still remains an important issue in research. The virial stress is given by [131, 158] � � 1� 1 �� �ij = rr� − (10) 2 �� � r �r i j r=r�� where ri is the projection of the interatomic distance vector r along coordinate i. We only consider the force part, excluding the part containing the effect of the velocity of atoms (the kinetic part). It was recently shown [158] that the stress-including the kinetic contribution is not equivalent to the mechanical Cauchy stress. The strain field is a measure of geometric deformation of the atomic lattice [163]. The local atomic strain is calculated by comparing the local deviation of the lattice from a reference configuration. Usually, the reference configuration is taken to be the undeformed lattice. In the atomistic simulations, the information about the position of every atom is readily available, either in the current or in the reference configuration. We define the following tensor for atom l qijl =
N � �x kl �x kl � 1 � i j N k=1 r02
(11)
where �xikl = xil − xik and �xj = xjl − xjk . The quantity N refers to the number of nearest neighbors considered. The left Cauchy–Green strain tensor is given by bijl
N � �x kl �x kl � N l 1� i j = qij = 2 � � k=1 r0
(12)
where � is a prefactor depending on the lattice considered. For a two-dimensional, triangular lattice with nearest neighbor interaction � = 3, � = 2 for a square lattice with nearestneighbor interaction and � = 4/3 for a face-centered cubic lattice. This definition provides an expression for a measure of deformation defined using continuum mechanics and in terms of atomic positions. The Eulerian strain tensor of atom l is√obtained from Eq. (12), eijl = 21 ��ij − bijl �. One can calculate the engineering strain � = b − 1. Unlike the virial stress, the atomic strain is valid instantaneously in space and time. However, the expression is only strictly applicable away from surfaces and interfaces. As an example, Fig. 7 shows elastic properties associated with the LJ potential for both uniaxial and triaxial loading. It can be seen from the plots that the elastic properties strongly depend on the crystal orientation. Under uniaxial tension with Poisson relaxation (i.e., �yy = �zz = 0), for loading in the [110] direction, the material is very weak and fails at very low strains of around 10%. In contrast, when the crystal is loaded in the [100] direction, the solid can be stretched up to 23% before it fails. Another interesting point to mention is when the crystal is loaded in the [100] direction there is no Poisson relaxation; that is, �yy = �zz = 0. Then, the failure strains of all three loading directions are considered comparable. Such behavior could become important in the design of nanowires.
6. SIMULATION TECHNIQUES 6.1. Classical Molecular Dynamics The simplest tool for atomistic studies is classical molecular dynamics [9], which is very easy to describe. Molecular dynamics predicts the motion of a large number of atoms governed by their mutual interatomic interaction, and it requires numerical integration of the equations of motion. The governing equation for an atom i is simply Fi = mai
(13)
12
Ultra–Large Scale Simulations of Dynamic Materials Failure uniaxial tension w/Poisson relaxation 7
uniaxial tension no Poisson relaxation 6
[100]
6 [111]
5
[110] 4
4
stress σxx 3
stress σxx 3
[110]
2
2
1
σyy=σzz=0
0 –1
[100]
[111]
5
1
1.05
1.1
1.15
1.2
1 0
1.25
1
1.05
1.1
1.2
1.25
1.3
triaxial tension
4.5
[110]
4
[111]
3.5
[100]
3
stress σxx
1.15
strain εxx
strain εxx
2.5
σxx=σyy=σzz
2 1.5 1 0.5 0
1
1.02
1.04
1.06
1.08
1.1
1.12
strain εxx Figure 7. Elastic properties of LJ solid for different modes of loading and different crystal orientations (uniaxial tension with Poisson relaxation, uniaxial tension without Poisson relaxation and triaxial loading).
where Fi is the force vector on atom i and ai is the acceleration of atom i. This equation can be effectively solved using a Verlet algorithm [9]. The Verlet algorithm has proven to be extremely accurate in terms of conserving energy, which is critical for statistical systems with a large number of particles. In the numerical scheme, the most time-consuming part is calculation of the interatomic forces (well over 90% of the time is spent in this routine).
6.2. Advanced Molecular Dynamics Methods In the classical molecular dynamics schemes, it is in principle possible to simulate arbitrarily large systems, provided sufficiently large computers are available. However, the timescale remains confined to several nanoseconds. Surprisingly, this is also true for very small systems (independent of how large the computers we use are). The reason is that very small systems can not be effectively parallelized. Also, time can not easily be parallelized. Therefore, surprisingly, there exists little tradeoff between desired simulation time and desired simulation size. This problem is referred to as the timescale dilemma of molecular dynamics [52, 132, 147]. Many systems of interest spend a lot of time in local free energy minima before a transition to another state occurs. In such cases, the free-energy surface has several local minima separated by large barriers. This is computationally highly inefficient for simulations with classical molecular dynamics methods. An alternative to classical molecular dynamics schemes is using Monte Carlo techniques such as the Metropolis algorithm. Note that in kinetic Monte Carlo schemes, all events
13
Ultra–Large Scale Simulations of Dynamic Materials Failure
and associated activation energy that take place during the simulation should be known in advance. For that purpose, the state space for the atoms has to be discretized on a lattice. Besides having to know all events, another drawback of such methods is that no real dynamics are obtained. To overcome the timescale dilemma and still obtain real dynamics while not knowing the events before the simulation, a number of different advanced simulation techniques have been developed in recent years (for a more extensive list of references see Ref. [85]). They are based on a variety of ideas, such as flattening the free-energy surface, parallel sampling for state transitions, finding the saddle points or trajectory-based schemes. Such techniques could find useful applications in problems in nanodimensions. Timespans of microseconds, seconds, or even years may be possible with these methods. Examples of such techniques are the parallel-replica (PR) method [96, 145], the hyperdynamics method [144], and the temperature-accelerated dynamics (TAD) method [95]. These methods have been developed by the group around Voter [147] (further references could be found therein) and allow for calculating the real-time trajectory of atomistic systems over long time spans. Other methods have been proposed by the group around Parrinello, who, for instance, developed a nonMarkovian coarse-grain dynamics method [85]. The method finds fast ways out of local free energy minima by adding a bias potential wherever the system has been previously, thus quickly “filling up” local minima [130]. This is schematically shown in Fig. 8. The methods discussed in these paragraphs could be useful for modeling deformation of nanosized structures and materials over long timespans, such as biological structures (e.g., mechanical deformation of proteins and properties at surfaces). A drawback in many of these methods is that schemes to detect state transitions need to be known. Also, the methods are often only effective for a particular class of problems and conditions. We give an example of using the TAD method in calculating the surface diffusivity of copper. We briefly review the method. The simulation is sped up by simulating the system at a temperature higher than the actual temperature of interest. Therefore, in this method two temperatures are critical: The low temperature at which the dynamics of the system is studied, and a high temperature at which the system is sampled for state transitions during a critical sampling time. This critical sampling time can be estimated based on theoretical considerations in transition-state theory [147]. For every state transition, the time at low temperature is estimated on the basis of the activation energy of the event. Among all state transitions detected during the critical sampling time, only the state transition that would have occurred at low temperature is selected to evolve the system, and the process is repeated. To calculate the surface diffusivity of copper, we consider a single atom on top of a flat [100] surface. The atom is constrained to move at the surface. The total simulation time approaches �t = 3 × 10⁻⁴ seconds. This is a very long timescale compared to classical
A
B Figure 8. Schematic of using a bias potential to fill up local minima to accelerate the state transition A → B.
14
Ultra–Large Scale Simulations of Dynamic Materials Failure
molecular dynamics timescales. The surface diffusivity is calculated according to ��xi �t� − xi �t0 ��2 � t→� 6t
Ds = lim
(14)
(in two-dimensional systems, the 6 is replaced by 4). The simulation is carried out at a temperature of T ≈ 400 K with N = 385 atoms. The high temperature in the TAD method is chosen to be 950 K. The integration time step is �t = 2 × 10⁻¹⁵ seconds. We calculate the diffusivity to be D = 7�5283 × 10−14
(15)
This value is comparable to experimental data D ≈ 11 × 10−14 [78]. In Fig. 9 we show the diffusive displacement over a time interval 0 < t < 2�5 × 10⁻⁴ seconds from which the diffusivity is calculated. We show another example of how the temperature-accelerated method could be used. Here we consider the atomic activities near a surface step in a [100] copper surface. The most important result of this study is that over time, two states A and B interchange. We find that atoms at the surface step tend to hop away from the perfect step. This defines two states �A�, the perfect step, and �B�, when the atom is hopped away from the step. Figure 10 shows the time-averaged stability of the two states as a function of temperature. It can be observed that for low temperatures, the living time of state �B� is much smaller compared to that of state �A�. State �A� is observed to be stable up to several hundred seconds. Figure 11 shows the two states in a three-dimensional atomic plot. Table 1 summarizes the different activation energies. The activation energies to get from state �A� to state �B� are different. This immediately explains why state �B� is not as stable as state �A�.
6.3. Concurrent and Hierarchical Multiscale Methods It is not always necessary to calculate the full atomistic information in the whole simulation domain. Some researchers have articulated the need for multiscale methods [6, 28, 58, 82, 121, 127] by combining atomistic simulations with continuum mechanics methods (e.g., finite elements). A variety of different methods has to be developed to achieve this. The primary motivation is to save computational time and, by doing that, to extend the scale accessible to the simulations. It is common to distinguish between hierarchical multiscale methods and onthe-fly concurrent multiscale methods. In on-the-fly multiscale methods, the computational domain is divided into different regions, where different simulation methods are applied. A critical issue in all such methods is the correct mechanical and thermodynamical coupling among different regions in a concurrent approach and different methods in a hierarchical approach. diffusive displacement of particle (dx, dy, dz) 15
dx dy dz
time (seconds)
10
5
0
–5
–10
0
0.5
1.0
time (seconds)
1.5
2.0
2.5 10–4
Figure 9. Diffusive displacement of a copper atom on a [100] surface over time, at the temperature T = 400 K.
15
Ultra–Large Scale Simulations of Dynamic Materials Failure
∆t between states (sec)
105
state A state B
100
10–5
10–10 100
200
300
400
500
600
700
800
900
temperature K Figure 10. Surface diffusion at a surface step on a [100] copper surface. The plot shows the average stability of the two states A and B.
Progress in this field was reported by Gumbsch and Beltz [59] in 1995. They discuss simulations performed with a hybrid atomistic-finite element (FEAt) model, and compared the results with the continuum-based Peirls–Nabarro model for different crack orientations in a nickel crystal. The researchers demonstrated the basic assumptions of the continuum model for dislocation nucleation (i.e., stable incipient slip configurations are formed before dislocation nucleation) and found relatively good agreement of the FEAt model with the Peierls model for critical loading associated with dislocation nucleation. In the FEAt model, the region with atomistic detail is determined before computation and cannot be updated during the simulation. A quasi-continuum (QC) model for quasi-static simulations was developed by Tadmor and coworkers [121, 122, 127], starting in 1996. This method has the advantage of an adaptive formulation of the atomistic region during simulation. The dislocation core region is treated fully atomistically, whereas most of the bulk region is treated as a continuum. The method is mostly limited to quasi-static conditions at zero temperature. For higher dislocation densities, the computational effort approaches that of a fully atomistic treatment. Figure 12 shows an example problem in which the quasi-continuum method is used to study plasticity in aluminum. A crack is embedded into a nonlinear finite element region.
A
B
A
B
Figure 11. Surface diffusion at a surface step on a [100] copper surface. The plot shows a time sequence of surface diffusion, and also indicates states A and B.
16
Ultra–Large Scale Simulations of Dynamic Materials Failure Table 1. Activation energy for different state transitions. State Transition (from → to)
Activation Energy (eV)
A→B B→A
0.609 0.217
100
100
50
50
Y
Y
As the loading is increased, dislocations are nucleated at the crack tip. At a critical strain of �yy ≈ 4�4%, the first partial dislocation is nucleated, and the final strain is �yy ≈ 5�7%. It can be seen how the atomic region is expanded as plasticity occurs. Figure 13 shows a closer view at the crack tip in the last frame of Fig. 12. The two dislocations are marked by �a� and �b�. Also, the crack propagates and further cleavage is observed, as indicated by the arrow �c�. We use an EAM potential for aluminum in this study [38]. The QC method could also find useful applications in studies of thin films constrained by substrates. A set of results for this case is shown in Figs. 14–16. Here we investigate a thin copper film with a (111) surface on a rigid substrate. The interatomic interactions are modeled by Voter and Chen’s EAM potential for copper [143, 146]. We consider a crack orthogonal to the surface. Such a crack could, for instance, be created by grain boundary cracking or constrained grain boundary diffusion [19, 23, 50]. Figure 14a shows different snapshots as the lateral mode I opening loading of the film is increased (the black line indicates the interface of substrate and thin film). The atomic region adapts and expands, as dislocations gliding on glide planes parallel to the film surface are nucleated and flow into the film material. Figure 14b shows a zoom into the crack tip region. Figure 15 shows the displacement field ux in the film, clearly indicating the constrained imposed by the substrate. Finally, Fig. 16 shows the single atoms near the crack tip. It can be observed how the crack is blunt after nucleation of parallel glide dislocations. Abraham et al. [2, 6] (1998–2000) proposed a method to couple quantum mechanics (QM), molecular dynamics, and FEM in a concurrent, seamless way. The method is referred to as MAAD, which is short for macro atomistic ab initio dynamics. As a sample problem, a finite-length penny-shaped crack in silicon was treated. So far, the method is only suitable for covalently bonded systems. A similar approach is being developed for metals [106]. Further reports of multiscale simulations of nanosystems describe hybrid FE, molecular dynamics, and QM calculations [98] for a silicon crystal. The authors report several studies in this work, among them a simulation of oxidation of a silicon [100] surface. Another active field of research in the multiscale area is hierarchical methods. In such an approach, molecular dynamics simulation results or results obtained from first principle calculations serve as input parameters for higher-order simulations. A prominent example in materials science is mesoscopic simulations. In mesoscopic methods, dislocations are treated as particles embedded in a linear elastic continuum. An important issue in these approaches is to identify proper coupling variables to transition between the different scales. Probably
0
–50
0
–50
[112] 0 [111]
100
X
–100 0
100
X
Figure 12. Application of the quasi-continuum method to a study of failure of aluminum. The figure shows a crack embedded in a nonlinear finite element region. As the strain is increased, dislocations nucleate at the crack tip.
17
Ultra–Large Scale Simulations of Dynamic Materials Failure
(b)
(c)
(a)
Figure 13. Failure of aluminum studied using the quasi-continuum method. Close-up view of the crack tip region of the example given in Fig. 12. Additional crack propagation is observed.
y [111]
(a)
x [110]
rigid substrate
(b) Figure 14. Application of the quasi-continuum method in a study of dislocations in thin films. Plot (a) shows the finite element mesh and the crack with the atomistic region. The coordinate system is x = 110 and y = 111 . Plot (b): Close-up view of the crack tip region of the example given in Fig. 14a. One can clearly see the nucleation of parallel glide dislocations.
rigid substrate
Figure 15. The plot shows the displacement field ux , clearly indicating the constraint by the rigid substrate so that ui = 0.
18
Ultra–Large Scale Simulations of Dynamic Materials Failure
Figure 16. Shows single atoms near the crack tip. One can see how the crack is blunt after nucleation of parallel glide dislocations.
the most popular example of hierarchical simulation methods is discrete dislocation dynamics (see, e.g., [87, 100, 119, 142]). Here, dislocations interact according to their linear-elastic fields and move according to empirical laws for dislocation mobility. All nonelastic reactions between dislocations that potentially occur have to be put into the simulation set-up as rules and laws. This information can, for instance, be obtained from atomistic simulations. A recent example for hierarchical multiscale modeling is a study by Horstemeyer et al. [72]. The authors investigated the shear strength of crystals based on a multiscale analysis, incorporating molecular dynamics, crystal plasticity, and macroscopic internal state theory applied to the same system. The objective of the studies was to compare different levels of description and to determine coupling parameters. Further studies of climb dislocations in diffusional creep in thin films [62] and mesoscopic treatment of grain boundaries during grain growth processes [63, 94] have also used hierarchical simulation approaches. We note that such coupling of length scales is just at its beginning and much research remains to be done in the future.
6.4. Continuum Approaches Incorporating Atomistic Information Recently, a VIB model has been proposed as a bridge of continuum models with cohesive surfaces and atomistic models with interatomic potentials [80]. The VIB method differs from an atomistic model in the sense that a phenomenological “cohesive force law” is adapted to act between material particles, which are not necessarily atoms. A randomized network of cohesive bonds is statistically incorporated into the constitutive response of the material based on the Cauchy–Born rule. This is achieved by equating the strain energy function on the continuum level to the potential energy stored in the cohesive bonds because of an imposed deformation. Other features of the VIB model [80] could be found elsewhere. The method has been used to study crack propagation in brittle materials and is able to reproduce many experimental phenomena such as crack tip instabilities or branching of cracks at low velocities. An important implication of the VIB method is that it provides a direct link between the atomic microstructure and its elastic properties for any given potential. The method was recently extended to model viscoelastic materials behavior [99]. The fact that this method is able to perform simulations on entirely different length scales makes it interesting for numerous applications, particularly in engineering, where more complex situations have to be modeled.
6.5. Discussion We have presented a selection of four different popular simulation tools that all incorporate atomic information. Classical molecular dynamics is the simplest approach among all of them. It can reach length-scales up to micrometers, but is still severely limited with respect to the timescale. Techniques for fast time sampling can achieve “parallelization of time,” but are
Ultra–Large Scale Simulations of Dynamic Materials Failure
19
difficult to apply in general problems. Multiscale methods are a promising field, but seamlessly coupling the different length and timescales where different simulation approaches are applied in real time within the domain remains challenging. Hierarchical methods avoid some of the problems, but they seem limited in terms of applicability. For example, a new phenomenon or mechanism might occur in the real system at a larger scale, but it is not resolved because a higher-order technique is applied in the whole domain. Continuum mechanics methods such as VIB have difficulties describing atomistic and atomic-scale processes because the size of the finite elements is often on the order of several hundred micrometers—far too large to capture many atomic scale processes and phenomena. In the remainder of this chapter, we will limit our attention to simulation work of dynamic materials failure based on classical molecular dynamics.
7. CLASSICAL MOLECULAR DYNAMICS IMPLEMENTED ON SUPERCOMPUTERS Large-scale molecular dynamics simulations often require an enormous amount of computer power. Here we focus on the implementation of classical molecular dynamics on modern supercomputers, made out of hundreds of single computers. It was only a few decades ago that computer scientists were concerned that the speed of scientific computers could not go much beyond gigaflops (a billion arithmetic operations per second). It was predicted that this plateau would be reached by the year 2000. Computer scientists now expect petaflop computers by the middle or end of the current decade [8, 141]. Based on the concept of concurrent computing, modern parallel computers are made out of hundreds or thousands of small computers (e.g., personal computers) working simultaneously on different parts of the same problem. Information between these small computers is shared by communicating, which is achieved by messagepassing procedures (MPI) [57]. Parallel molecular dynamics is relatively straightforward to implement with great efficiency in a message-passing environment. It is important to have an effective algorithm for handling the summations of N interacting particles. If summations had to be carried out for each particle over all particles, the problem would scale with N 2 . This is a computational catastrophe for large systems. However, if the interactions between particles are short ranged, the problem can be reduced so that the execution time scales linearly with the number of particles (i.e., execution time scales with N ). The computational space is divided up into cells such that in searching for neighbors interacting with a given particle, only the cell in which it is located and the next-nearest neighbors have to be considered. Because placing the particles in the correct cells scales linearly with N , the problem originally scaling with N 2 can therefore be reduced to N . With a parallel computer whose number of processors increases with the number of cells (the number of particles per cell does not change), the computational burden remains constant. The speed-up factor S is defined by the ratio of execution time for one processor over the execution time for p processors. The perfectly efficient parallel computer would exhibit linear speedup. This would mean that the computation time for p processors is 1/p times the execution time on one processor. However, the speed-up depends strongly on the fraction of the work done in parallel. We refer the reader to Plimpton’s algorithms for molecular dynamics with short-range forces [105]. One of the major concerns in atomistic modeling has always been the need for huge computational resources. Computational material scientists could only handle a few hundred atoms in the 1960s, and this number increased up to 100,000 in the mid-80s. With the advent of teraflop (one trillion floating point operations per second) computing using massively parallelized concurrent computers, systems with over 1,000,000,000 atoms can be simulated today [8, 114]. This allows for three-dimensional simulations of systems reaching micrometer size, a length scale associated with the behavior of dislocations. Even a few years ago, it was not anticipated that molecular dynamics simulations could be performed with systems of micrometer size. We emphasize that the “size” of the simulations does not determine how “useful” a simulation is by itself. Instead, the most important issue and measure for a successful simulation
20
Ultra–Large Scale Simulations of Dynamic Materials Failure
is always the physics that can be extracted from the simulation. This objective should dictate the system size. In many cases, such as for dislocation–dislocation interaction, system sizes on the order of micrometers are needed (dislocation interaction is associated with a characteristic length scale of micrometers). This example illustrates that there is still a need for the development of simulation techniques and more computer power. Future development using cheap off-the-shelf technology based on LINUX clusters to build supercomputers (instead of using very expensive UNIX-based supercomputers) is promising, as indicated by recent publications [152, 153]. The state-of-the art size of molecular dynamics simulations is well into the billions. In a recent publication by the group around Trebin and coworkers [114], a molecular dynamics simulation with over five billion particles was conducted over a very short time interval. More recently, Abraham and coworkers succeeded in a dislocation dynamics study of over one billion particles over a time span sufficiently long to build a complex entangled dislocation network in a crystal of a size that approached micrometers [8]. This simulation will be discussed in more detail later.
8. ANALYSIS TECHNIQUES: VISUALIZATION AND DATA PROCESSING Large-scale atomistic computer simulations can produce terabytes of data, as the location, velocity, energy, and stress tensor of each atom need to be stored (a molecular dynamics data set for a billion atoms occupies around 100 GBytes of disk space). To interpret and understand the simulation results, it is essential to have analysis tools available that are capable of filtering out the useful information [8, 120]. Data processing and visualization is an important step in the analysis to extract useful information from the simulation. For example, the collective motion and interaction of defects determine macroscopic properties such as the toughness of a material. Techniques to extract such information from positions of atoms are critical and yet must still be developed in most cases to achieve such goals. Some of the techniques of postprocessing data and visualization techniques will be discussed in the following paragraphs.
8.1. Visualization Techniques One of the long-standing dreams of computer simulation scientists is three-dimensional virtual reality to analyze the results. Imagine walking through the data as a viewer of atomicscale size [98, 120]. Scientists would then be able to identify interesting points, and to study these closer as the simulation proceeded. At the Collaboratory for Advanced Computing and Simulations (CACS) at the University of Southern California, an “Atomsviewer System” is currently being developed that visualizes large-scale data sets from huge computer simulations (http://cacs.usc.edu) [98, 120]. The main feature of this system is the ability to view materials processes simultaneously from different perspectives. To visualize this huge amount of data, new techniques are being developed. One approach is to process only the data the viewer at the current perspective will actually see [98, 120]. This is achieved using the octree data structure. The main idea is that although the dataset may be very large, the viewer only sees a very small portion of the data at any instant in time. The octree data structure is a data management method to extract the data in the viewer’s field of view [98]. This method is relatively coarse, and it has been shown that 60% of all atoms are still invisible because they are hidden behind other particles. Additional techniques such as a probabilistic approach referred to as occlusion culling remove hidden atoms and thus further reduce the workload for visualization. The whole visualization process is set up on a PC cluster through parallel and distributed computing. Another important aspect of scientific visualization is the generation of movies. In recent years, it has been increasingly appreciated that, “a picture is worth a thousand words, and a movie is worth a thousand pictures” [8]. Animations of simulations help to guide the eye to discover new scientific phenomena. Historically this has been particularly taken advantage of in the biophysics community, where visualization of complex biostructures (e.g., proteins) is key in the understanding and interpreting of simulation results. Interestingly, some
Ultra–Large Scale Simulations of Dynamic Materials Failure
21
researchers have started to implement techniques that allow real-time interaction of users with particles in the simulation. For example, the biophysics group around Klaus Schulten has set up a system in which scientists can interact with the simulation by using a tool to manipulate molecules [125]. The researchers implemented a system called interactive molecular dynamics (IMD). This system allows manipulation of molecules in molecular dynamics simulations with real-time force feedback, as well as graphical display. Communication is achieved through an efficient socket connection between the visualization program (VMD) and a molecular dynamics program (NAMD) running on single or multiple machines. In this method, a natural force feedback interface for molecular steering is provided by a haptic device [125].
8.2. Postprocessing of Atomistic Simulation Data: Visualization of Crystal Defects Quantities like strain, stress, or potential energy of atoms are important classical quantities to be visualized, in particular with respect to continuum mechanics theories. However, it is often advantageous to postprocess the data and to derive new quantities, providing more information to the defect structure. Here we discuss a few examples for the analysis of crystal defects in metals. To visualize crystal defects, the easiest approach is to use the energy method. This method has frequently been used to “see” into the interior of the solid (e.g., [5, 8]). In this method, only those atoms with potential energy greater than or equal to a critical energy U0 above the bulk energy Ub are shown. The energy method has been very effective for displaying dislocations, microcracks, and other imperfections in crystal packing. This reduces the number of atoms being displayed by approximately two orders of magnitude in three dimensions. Assuming a crystal defect is identified as a dislocation, it can be analyzed in more detail based on a geometric analysis of the lattice close to the dislocation core, allowing us to determine the Burgers vector and the slip plane. For that purpose, one can rotate the atomic lattice such that one is looking onto a 111 -plane, with the horizontal �x� axis oriented into a �110� direction, and the vertical �y� axis aligned with a �111� direction. To help visualizing dislocations, stretching the atomic lattice by a factor of five to 10 in the �110� direction is helpful. A systematic rotation of the atomic lattice to investigate all possible Burgers vectors is then necessary. Instead of analyzing a part of the atomic lattice containing many dislocations, one can choose a domain of the atomic lattice that contains only one dislocation. This approach requires a very detailed understanding of the lattice and dislocations [67, 75]. This way of analysis is like analysis of transmitting electron microscopy images from “real” laboratory experiments. A more advanced analysis can be performed using the centrosymmetry technique proposed by Kelchner and coworkers [79]. This method makes use of the fact that centrosymmetric crystals remain centrosymmetric after homogeneous deformation. Each atom has pairs of equal and opposite bonds with its nearest neighbors. During deformation, bonds will change direction or length, but they remain equal and opposite within the same pair. This rule breaks down when a defect is close to an atom under consideration. The centrosymmetry method is particularly helpful to separate different types of defects from one another and to display stacking faults (in contrast, using the energy method it is difficult to observe stacking faults). The centrosymmetry parameter for an atom is defined as [79] � 3 �2 � 6 �� � � � � � ci = r + r k� j k� j+6 � � j=1
(16)
k=1
where rk� j is the kth component of the bond vector (k = 1, 2, and 3, corresponding to the directions x, y, and z) of atom i with its neighbor atom j, and rk� j+6 is the same quantity with respect to the opposite neighbor. We summarize the interpretation of ci in Table 2 (assuming that the nearest-neighbor distance does not change near a defect). For the analysis, it is reasonable to display ranges of these parameters. The method can also be applied at
22
Ultra–Large Scale Simulations of Dynamic Materials Failure Table 2. Centrosymmetry parameter ci for various types of defects in copper. Defect
ci (in Å 2 )
Perfect lattice Partial dislocation Stacking fault Surface atom
Range �ci (in Å 2 ) ci < 0�1 0�1 < ci < 5 5 < ci < 18 ci > 18
0.00 1.86 6.49 22.06
Note. In the visualization scheme, we choose intervals of ci to separate different defects from each other.
elevated temperature, which is not possible using the energy method because of the thermal fluctuation of atoms. An example using this centrosymmetry technique is shown in Fig. 17. The plots show a simulation of copper with an EAM potential [93] in the same geometry as discussed in Ref. [8]. Although the centrosymmetry technique can distinguish well between different defects, it does not provide information about the Burgers vector of dislocations. The slip vector approach was first introduced by Zimmerman and coworkers in an application of molecular dynamics studies of nanoindentation [162]. This parameter also contains information about the slip plane and Burgers vector. The slip vector of an atom � is defined as si� = −
n� ��
1 � x − Xi�� ns � =� i
(17)
where ns is the number of slipped atoms, xi�� is the vector difference of atoms � and � at the current configuration, and Xi�� is the vector difference of atoms � and � at the reference configuration at zero stress and no mechanical deformation. The slip vector approach can be used for any material microstructure, unlike the centrosymmetry parameter, which can only be used for centrosymmetric microstructures. Other researchers have used a common-neighbor analysis to analyze their results [39, 71, 117]. In this method, the number of nearest neighbors is calculated, which allows us surface partial dislocation stacking fault
Figure 17. Centrosymmetry analysis of a complex defect structure. The left picture shows the whole simulation domain of a simulation comprising around 35 million atoms. In this plot, only partial dislocations and surfaces are shown. In the right plot, a closer view on the defect structure is depicted. Here we also show the stacking fault regions.
23
Ultra–Large Scale Simulations of Dynamic Materials Failure
to distinguish between different defects. Additional analysis to analyze more complex structures such as grain boundaries (GB) is possible based on the medium-range-order (MRO) analysis. This method is capable of determining the local crystallinity class. The MRO analysis has been applied in the analysis of simulations of nanocrystalline materials, where an exact characterization of the GB is important (e.g., [37, 136, 139]).
9. USING VERY LARGE SIMULATIONS TO STUDY DIFFERENT MECHANISMS OF DEFORMATION So far we have mostly focused on methods rather than concrete research applications. Here we discuss some recent examples in materials science where large-scale atomistic simulations have proven to be an extremely useful tool.
9.1. Brittle Fracture and Defect Dynamics Studying rapidly propagating cracks using atomistic methods is particularly attractive because cracks propagate at speeds of kilometers per second, which corresponds to nanometers/picosecond. This scale is readily accessible with classical molecular dynamics methods. Much of the research of dynamic fracture focused on understanding the atomic details of crack propagation and its relation to macroscopic theories [44] as well as experiments of fracture. The first part of this review describes simulation work that mostly treats generic “brittle model materials” rather than specific materials. Later, we focus on simulations that discuss fracture in specific materials. Dynamic fracture is a very complex multiscale process, as is seen in Fig. 18. Interatomic bonding and microstructure determine the material properties as, for instance, the fracture surface energy. Breaking of atomic bonds occurs at length scales of nanometers, and material nonlinearities govern in a regime of tens of nanometers. All these scales affect the macroscopic fracture process. The earliest molecular dynamics simulations of fracture were carried out almost 30 years ago by Ashurst and Hoover [11]. Many features of dynamic fracture were described in that paper, although their simulation size was extremely small (only 64 × 16 atoms with crack lengths around 10 atoms). A classical paper by Abraham and coworkers published in 1994 stimulated much further research [3]. In this work, the authors reported molecular dynamics simulations of fracture in systems up to 500,000 atoms, which was a significant number at that time. In the atomistic calculations, a LJ potential, as described in Eq. (5), was used. 10–8 m material nonlinearities 10–6 m macroscale
10–9 m breaking of atomic bonds nanoscale 10–10 m atomic scale Figure 18. Fracture is a complex multiscale phenomenon. Interatomic bonding and microstructure determines the material properties, as for instance, the fracture surface energy. Breaking of atomic bonds occurs at length scales of nanometers, and material nonlinearities govern in a regime of tens of nanometers. All these scales affect the macroscopic fracture process.
24
Ultra–Large Scale Simulations of Dynamic Materials Failure
In addition, the results in [3, 5] were striking because the molecular dynamics simulations reproduced phenomena that were discovered in experiments only a few years earlier [41]. The most important observation was the so-called “mirror-mist-hackle” transition. It was observed that the crack face morphology changes as the crack speed increases. The phenomenon is also referred to as dynamic instability of cracks. Up to a speed of about one-third of the Rayleigh wave speed, the crack surface is atomically flat (mirror regime). For higher crack speeds, the crack starts to roughen (mist regime) and eventually becomes very rough (hackle regime), accompanied by dislocation emission. This is shown in Fig. 19. Such phenomena were observed at the same velocities in experiments [41]. Because the molecular dynamics simulations are performed in a perfect lattice, it was concluded that these dynamic instabilities are a universal property of cracks. The instabilities were subject to numerous other studies (e.g. [90]) in following years. A question that has attracted numerous researchers is that of the limiting the speed of cracks [44]. In Fig. 20 we summarize the admitted propagating speeds for cracks under mode I and mode II loading. The limiting speed for mode I cracks is the Rayleigh wave speed. For mode II, cracks velocities below the Rayleigh speed and those between the shear wave speed and the longitudinal wave speeds are admissible. Between these two regimes, there is an impenetrable velocity gap, which led to the uncertainty that mode II cracks would also be limited by the Rayleigh wave speed. In contrast, experiments have recently shown that shear-loaded (mode II) cracks can move at intersonic velocities through a mother–daughter mechanism [112, 113]. Molecular dynamics simulations by Abraham and Gao (2001) reproduced this observation and provided a quantitative continuum mechanics analysis of this mechanism [48]. A short distance ahead of the crack, a shear stress peak develops that causes nucleation of a daughter crack at a velocity beyond the shear wave speed. This topic is an example in which atomistic simulations could immediately be coupled to experiments. This also led to the development of the fundamental solution of intersonic mode II cracks by Huang and Gao [73]. The fundamental solution was then used to construct the solution for a suddenly stopping intersonic crack [74], which in turn has motivated recent molecular dynamics simulations of suddenly stopping intersonic cracks [21]. In the atomistic calculations, harmonic potentials as described in Eq. (7) were used. Additional studies focused on the inertia properties of cracks, with good results in good comparison with theory and experiment [15]. Other research [21, 22, 27, 48] reported simultaneous continuum mechanics and atomistic studies of rapidly propagating cracks. The main objective of these studies was to investigate whether the linear continuum theory could be applied to nanoscale dynamic phenomena. mirror
mist
hackle
Figure 19. Dynamic fracture in a Lennard–Jones material, showing the mirror–mist–hackle transformation [3, 5, 17].
25
Ultra–Large Scale Simulations of Dynamic Materials Failure
sub-Rayleigh
transsonic
supersonic
Mode II
max. crack speed
Mode I Cr
Mode I
Cs
Cl
Mode II permitted crack speed
Figure 20. Admitted propagation speeds for mode I and mode II cracks, according to classical continuum mechanics theories [44].
The studies included the limiting speed of cracks and Griffith analysis [21, 48], as well as comparison of the crack tip deformation fields [22]. The results indicate that continuum mechanics concepts could be applied to describe crack dynamics even at nanoscale, underlining the striking power of continuum theory. When the material behavior is nonlinear (also referred to as hyperelasticity), crack dynamics can be much different [7, 18]. Although totally unexpected from the classical understanding, it was demonstrated that cracks can move at supersonic velocities [7, 18]. In the same spirit, it was elaborated that hyperelastic softening causes the crack velocity to significantly decrease [3, 45]. However, no quantitative understanding of hyperelasticity in dynamic fracture was achieved until recently, when the concept of energy length scale was introduced [18]. We used a biharmonic potential to construct a model material with bilinear elastic properties. The biharmonic potential was defined as 1 �ij �rij � = a0 + k0 �rij − r0 �2 2
rij < ron
(18)
1 �ij �rij � = a1 + k1 �rij − r1 �2 2
rij ≥ ron
(19)
and
where a1 =
1 1 k0 �ron − r0 �2 − k1 �ron − r1 �2 2 2
(20)
1 �r + r0 � 2 on
(21)
and r1 =
are parameters chosen to satisfy continuation conditions, and k0 and k1 are the small-strain and large-strain spring constants, respectively (for further details, see Ref. [18]). Development of such potentials is an example of the “model material”-approach. This particular model material allowed us to define a clear hyperelastic region around the crack tip in which elastic properties are associated with large strain. This is exemplified in Fig. 21 for a crack propagating at super-Rayleigh speed [24] (the region shows a section of the simulation slab). The blue region indicates the hyperelastic region, and the yellow regime is associated with small-strain elastic properties. In Ref. [18], it was shown that hyperelasticity can be crucial for dynamic fracture because even a highly confined hyperelastic zone near a moving crack tip can significantly alter local energy flux and change the dynamics of the crack propagation [18]. Based on the molecular dynamics simulation results, the authors showed that there exists a critical length scale associated with energy flow near the crack tip. If the extension of the hyperelastic zone becomes comparable to the energy length scale, hyperelasticity completely governs the dynamics of fracture. However, if the hyperelastic zone is small compared to the energy length scale, linear elastic properties and classical theories of fracture govern crack dynamics. In Fig. 22, the different length scales in the vicinity of a dynamic crack are shown schematically. Figure 22a shows the classical understanding, and Fig. 22b shows the picture with the new concept of the characteristic energy length �. The fracture process zone in which
26
Ultra–Large Scale Simulations of Dynamic Materials Failure
soft stiff
Figure 21. Super-Rayleigh crack in a biharmonic lattice [24]. The blue, dark region refers to material that is stretched so large that the material properties are associated with large strain. The yellow, bright region can be treated using linear elasticity.
atomic bonds are broken is usually very small and extends only a few Angstroms in perfectly brittle systems. The K-dominance zone in which linear elastic fracture mechanics dominates is relatively large. In between the fracture process zone and the K-dominance zone is the region in which material response is hyperelastic. With the new energy length scale, as shown in Fig. 22b, the role of the energy length scale becomes apparent: It is in between the K-dominance zone and the hyperelastic region. If the size of the hyperelastic region becomes comparable to the energy length scale, hyperelasticity governs dynamic fracture. If the region is much smaller, hyperelasticity can be neglected. Figure 23 shows supersonic mode II crack propagation, which occurs as a consequence of a local hyperelastic stiffening zone [7, 18]. Materials in small dimensions have also attracted interest in the area of dynamic fracture. Studies of this kind involve crack dynamics at interfaces of different materials (e.g., in composite materials). Interfaces play an important role in the dynamics of earthquakes. Therefore, cracks at interfaces have been significantly studied in recent years [51]. Other studies revealed that shear-dominated cracks at the interface of dissimilar materials can move at intersonic and even supersonic velocities [7, 20]. When shear-dominated cracks propagate along interfaces between two dissimilar materials, multiple mother–daughter mechanisms are observed [7, 20]. Such mechanisms are referred to as mother–daughter–granddaughter mechanisms [7]. A crack under shear loading propagating along an interface between dissimilar materials eventually approaches a speed equal to the longitudinal wave speed of the stiffer of the two materials. Figure 24 shows a mode II crack propagating along an interface between two different materials. In the model, two harmonic solids with different spring constants are bonded together with a weak layer [48]. Figure 24a shows the potential energy field. Crack �A� refers to the mother crack, �B� to the daughter crack, and �C� to the granddaughter crack. Figure 24b shows the change in propagation speed when the crack speed approaches the longitudinal wave speed of the stiffer material. The change in crack speed along dissimilar materials is discrete in this case. This phenomenon is reminiscent of the mother–daughter mechanism in mode II cracks in homogeneous materials. Other studies of brittle fracture were based on lattice models of dynamic fracture [88, 90]. These models have the advantage that crack dynamics can be solved in closed form for some classical
new
fracture process zone hyperelastic zone K dominance zone characteristic energy length
(a)
(b)
Figure 22. Different length scales in the vicinity of a dynamic crack. Subplot (a) shows the classical picture, and subplot (b) shows the picture with the new concept of the characteristic energy length �.
27
Ultra–Large Scale Simulations of Dynamic Materials Failure
Figure 23. Sequence of snapshots of supersonic mode II fracture.
simplified cases [88]. In contrast to the large-scale molecular dynamics models described above, lattice models are usually small and can be run on workstations. In Ref. [70], the authors report an overview over atomistic and continuum mechanics theories of dynamic fracture, emphasizing the importance of the atomic scale in understanding
B
A
C
(a)
mother-daughter cr
cs
cl
upper part
max speed
lower part cr cs
cl
daughter-granddaughter
(b) Figure 24. Mode II crack along an interface between two dissimilar materials [20]. The crack propagates supersonically with respect to the wave speeds in the soft material. A daughter–granddaughter mechanism is observed for the crack to jump to the longitudinal wave speed of the stiff material.
28
Ultra–Large Scale Simulations of Dynamic Materials Failure
materials phenomena. They discuss scaling arguments allowing us to study crack dynamics in small atomic systems and scaling it up to larger length scales comparable to experiment. A study of fracture in tetravalent silicon based on the Stillinger–Weber (SW) potential is discussed. The authors state that the SW potential has problems describing brittle fracture in silicon well, as the experimentally preferred fracture planes (111) and (110) could not be reproduced. The authors further discuss other possible potentials for silicon in terms of their applicability to the model fracture of silicon. A velocity gap is discussed, implying that at zero temperature there is a minimum speed at which cracks can propagate. Various simulations of fracture of silicon are summarized [69]. In Ref. [88], further issues of atomic brittle fracture are discussed, such as lattice trapping. In addition, the author showed a relation of crack velocity and loading indicating that there are regimes of forbidden velocities, so that the crack speed increases discretely with increase of loading. In another publication, they compared the crack velocity, as a function of energy release rate calculated by molecular dynamics, to experimental results [65]. The group around Vashishta [140] reported large-scale atomistic studies of dynamic fracture involving 10–100 million atoms. They studied fracture of silicon nitride, fracture of graphite, and fracture in gallium arsenide. They also reported studies of fiberreinforced ceramic composites (silicon nitride reinforced with silica-coated carbide fibers). More recently, the research group reported molecular dynamics simulations with up to one billion atoms [120, 141]. In a recent review, further approaches of dynamic fracture were summarized [115]. Gumbsch and coworkers [61] report a series of MD simulations to evaluate the influence of several aspects of the dynamic crack tip instability based on various potentials. The authors also report a velocity gap for crack speeds. They use a particular type of boundary conditions, leaving the crack in an elliptical-shaped boundary with viscous damping at the outside to avoid reflection of waves from the boundary. Because its shape is similar to a stadium, it was referred to as “stadium damping” by Gumbsch and coworkers [61]. The crack propagates within an NVE ensemble in an elliptical “stadium” that is characterized by center and stadium. Outside this inner ellipse viscous damping or NVT temperature control is applied. This setup is chosen because stress waves reflecting from the boundaries can severely influence the dynamics of cracks, leading to crack arrest. The authors find that the limiting speed of cracks is between 30% and 40%, depending on the potential. It was reported that cracks release the excess energy by emitting strong acoustic waves during the breaking of every single atomic bond. Further, the authors did not observe crack branching because the velocity was too low for this phenomenon to be observed.
9.2. Ductile Failure The length and time range accessible to molecular dynamics is suitable for studying dislocation nucleation from defects such as cracks, as well as complicated dislocation reactions. The method also intrinsically captures dynamics of other topological defects, such as vacancies or grain boundaries and its interaction with dislocations. This is an advantage over mesoscopic methods, which require picking parameters and rules for defect interaction. Also, using EAM potentials (e.g., Ref. [42]), good models for many metals can be obtained. With sufficient computer resources, it is possible to study the collective behavior of a large number of dislocations in systems with high dislocation density. In addition, systems under large strain rates can be readily simulated. In discrete dislocation dynamics methods, such conditions are difficult to achieve. Two distinct length scales are involved in the mechanics of networks of crystal defects. The micrometer-length scale is characteristic of the mutual elastic interaction among dislocations, but dislocation cores and the formation of junctions and other reaction products are characterized by the length scale of several Burgers vectors (several Angstroms or atomic length scale) [67]. The two length scales span several orders of magnitude, indicating the computational challenge associated with modeling. The rapidly advancing computing capabilities of supercomputers approaching teraflops and beyond now allow simulations ranging from nanoscale to microscale within one simulation [8]. In this section we will review some
Ultra–Large Scale Simulations of Dynamic Materials Failure
29
of the activities and the historical development of atomistic simulations of dislocations and dislocation interactions in metals, and we illustrate that progress in this field is highly coupled to advances in computer resources. Early studies by Hoagland et al. [68] and deCelis et al. [36] treated only a few hundred atoms. The researchers studied the competition of ductile versus brittle behaviors of solids using quasi-static methods and investigated how and under which conditions dislocations are generated at a crack tip. Such microcracks can be found in virtually any real materials (referred to as material flaws) and serve as seeds for defect generation (see also Fig. 2 and the associated discussion). The studies were small in size, and only a few dislocations could be simulated. Because of the lack of dynamic response and the system size limitations, the treatments were valid only until the first dislocation travelled a small fraction of the sample size away from the crack tip. Computational resources rapidly developed during the 1990s. Cleri et al. [32] studied the atomic-scale mechanism of crack-tip plasticity using around 80,000 atoms. They investigated dislocation emission from a crack tip by extracting the atomic-level displacement and stress fields, so as to link the molecular dynamics results to continuum mechanics descriptions of brittle versus ductile behavior in crack propagation [109–111]. Zhou and coworkers [159] performed large-scale MD simulations and carried out simulations of up to 35 million atoms to study ductile failure. In these simulations, the atoms interact with Morse pair potentials as well as more realistic EAM potentials. Zhou et al. observed the emission of dislocation loops from the crack front and found that the sequence of dislocation emission events strongly depends on the crystallographic orientation of the crack front. They assumed that systems comprising 3.5 million atoms are sufficient to study the early stages of dislocation nucleation (since they observed the same feature independent of the system size). In 1997, Abraham and coworkers [5] performed simulations using 100 million atoms and showed generation of “flower-of-loop” dislocations at a moving crack tip. It was observed that generation of dislocation loops in a rapidly propagating crack occurs above a critical crack speed, indicating a dynamic brittle-to-ductile transition. Other studies focused on the creation, motion, and reaction of very few dislocations in fcc lattice, with the objective of understanding the fundamental principles. Research activity was centered on atomistic details of the dislocation core making use of the EAM method [34, 53]. Zhou and Hoolian [160] performed molecular dynamics simulations of up to 3.5 million atoms interacting with EAM potentials (they used up to 35 million atoms with pair potentials). They studied the intersection of extended dislocations in copper and observed that the intersection process begins with junction formation, followed by an unzipping event and partial dislocation bowing and cutting. These are unique studies, the results of which can be immediately applied in mesoscopic simulations. Additional research was carried out to investigate the screw dislocation structure and interaction in a nickel fcc lattice by Qi et al. [107], using a QM–Sutton–Chen many-body potential. The researchers studied the core geometry of partial dislocations, as well as the motion and annihilation of oppositely signed dislocations, and discussed cross-slip and associated energy barriers. Atomistic simulations have also been applied to study the interaction of dislocations with other defects. In 2002, the system size reached one billion atoms on the world’s fastest computer (ASCI White at Lawrence Livermore National Laboratory) [8]. In this work, a work-hardening simulation has been described. (A movie of the work-hardening simulation may be viewed and downloaded from the following Web address: http://www.almaden.ibm.com/st/Simulate/. We encourage the reader to view this movie in conjunction with the reading of this section.) Figure 25 shows the geometry and crystal orientation. The coordinate system x� y� z corresponds to the crystallographic orientation x = 110 , y = 110 , and z = 001 . A LJ potential [see Eq. (5)] was used in the simulation. From two virgin cracks, a spaghetti-like network of atomic strings is flying from the vertices of the two opposing crack edges. A large number of mobile dislocations are created at each crack edge and rapidly flow through the stretched solid in a wiggly manner. This enables the stressed solid to be rapidly filled with dislocations, giving rise to work hardening under a steady load. For the fcc solid, dislocations are easily created at the apex of the two microcracks where the stress is at its maximum. Because the stacking fault energy for the model potential is very small, the mobile wiggly dislocations
30
Ultra–Large Scale Simulations of Dynamic Materials Failure x
(110) crack surface
z
[110] [110]
y Figure 25. Large-scale 1-billion atom simulation of work-hardening as reported in [8]. The plot shows the simulation geometry and crystal orientation.
are mostly partial dislocations. In the final stages, a coarse grain skeleton of rigid defects becomes apparent from a distant view. Figures 26 and 27 show several details and snapshots as the simulation proceeds [8, 26]. Figure 28 shows a representative dislocation reaction leading to creation of defect junctions by dislocation cutting processes [26]. It was concluded that the main hardening mechanism in the simulation is formation of sessile defects, such as Lomer–Cottrel locks. The glide resistance of dislocations between neighboring crystal grains resulting from the presence of a GB was investigated by Koning et al. [84], who reported slip transmission of dislocation loops near a series of tilt GBs in nickel. These authors successfully applied a line-tension model to determine important geometrical parameters that are relevant in the description of the process. Other research focused on the generation of vacancies in metals [117]. In this paper it was shown that during deformation of metals under very high strain rates, large number of vacancies are generated. Other interests in recent years have been focused on nanoindentation problems, which are key to understanding nanoscale effects associated with plastic deformation [55, 79, 86, 162]. This is because the nucleation of dislocations and their interactions are important to the initial stages of crystal plasticity. In nanoindentation, a discrete, quantized stress-displacement curve is observed (cf. e.g., Ref. [86]), which is in contrast to the results of microindentation experiments, where the force versus displacement curve is continuous. This behavior is explained by single-dislocation nucleation events at the nanoscale. Studies of nanoindentation were also performed in direct comparison with experimental results [35]. As in the case of cracks, it has also attracted attention to investigate how fast dislocations can propagate in metals. The classical theory predicts that the shear wave speed is the limiting speed for dislocations. In contrast to the classical theories, Gumbsch and Gao [60] reported dislocations moving at intersonic and supersonic velocities.
Figure 26. Large-scale 1-billion atom simulation of work-hardening as reported in Ref. [8]. The plot shows a few more detailed views of the complex defect structure.
31
Ultra–Large Scale Simulations of Dynamic Materials Failure 1
2
1
2
3
4
3
4
Figure 27. Large-scale 1-billion atom simulation of work-hardening as reported in Ref. [8]. The plot shows consecutive snapshots of the evolution of the dislocation structure in the simulation.
9.3. Deformation Mechanisms in Materials under Geometric Confinement The recent trend of interest in materials in small dimensions has triggered a large amount of simulation work. A prominent example of such materials is nanostructured materials (e.g., nanocrystalline metals). Significant effort in the last years has been put into the understanding of the properties of such materials, which may be partly motivated by the observation that the smaller the grain size, the stronger the material. The yield strength increases according to 1 �Y ∼ √ d
(22)
where d is the grain size. This is referred to as Hall–Petch behavior and can be derived based on considerations of dislocation pileups in the grains. It is now generally accepted that in nanostructured materials the role of grain boundaries becomes increasingly important, leading to previously unknown deformation mechanisms. One of the reasons for this is that classical mechanisms for dislocation generation (e.g., Frank–Read-sources) can not operate in nanocrystals. In addition, defects such as grain boundaries interact in complicated ways
1 1
2
2
1
1 2
2
Figure 28. First dislocation cutting reactions. The plots show how two dislocations (denoted by “1” and “2”) from opposite cracks intersect and create reaction products. When a second reaction takes place at dislocation “2” involving a third dislocation, the dislocation motion is severely hindered, which is seen in the bowing out of the dislocations. Many of such reactions occur during the simulation, causing the generation of a complex defect network.
32
Ultra–Large Scale Simulations of Dynamic Materials Failure
with other defects. Grain boundaries provide sources and sinks for dislocations, but their role in doing so is still not well understood. Despite the prediction by Eq. (22), the strength of nanomaterials does not increase continuously with decreasing grain size. Below a critical grain size, experiments have shown that the strength decreases again. This is referred to as inverse Hall–Petch effect [101, 153]. In this regime, it was proposed that the yield stress scales as √ (23) �Y ∼ d although physical foundation of such material behavior is yet to be explored. Such behavior indicates that there may exist a maximum of strength for a certain grain size, described as “the strongest size” by Sidney Yip in 1998 [156]. One of the major objectives of recent research is to quantify this critical condition and understand the underlying principles. Studies of nanostructured materials were reported by several groups (see, e.g., Refs. [77, 135, 136, 139, 152, 153, 155]). Studying deformation of nanocrystalline materials with molecular dynamics usually requires significant computer power. However, classical molecular dynamics methods have proven to be very powerful, as the simulation conditions can be chosen to be in a window well-accessible to molecular dynamics simulations. In most of the molecular dynamics studies, polycrystalline samples at nanoscale were created (e.g., by a Voronoi construction), annealed, relaxed, and then put under tensile loading. In the following paragraphs, we summarize the main results in this field obtained for different geometries, materials, and simulation conditions (e.g., temperature, loading). Figure 29 shows a nanocrystalline sample as used by the group around Swygenhoven [64]. The figure shows a computer-generated nanocrystalline Ni sample, with about 125 grains with an average grain size of about 6 nm. The model comprises about 1.25 million atoms. Atoms in non-fcc configuration are rendered nongray. Gray represents fcc atoms, green represents other 12-coordinated atoms, and non-12-coordinated atoms are drawn in blue (figure reprinted with permission from Hasnaoui et al. [64]). Coble creep is a well-known mechanism for creep of polycrystalline materials [33]. The characteristic time for stress relaxation is given by � ∼ d3
(24)
Figure 29. The figure shows a computer-generated nanocrystalline Ni sample, with about 125 grains with an average grain size of about 6 nm. The model comprises about 1.25 million atoms. Atoms in non-fcc configuration are rendered nongray. Gray represents fcc atoms, green represents other 12-coordinated, atoms and non-12-coordinated atoms are drawn in blue. Reprinted with permission from [64], A. Hasnaoui et al., Science 300, 1550 (2003). © 2003, American Association for the Advancement of Science.
Ultra–Large Scale Simulations of Dynamic Materials Failure
33
where d is the grain diameter. This scaling indicates that under certain conditions, diffusive mechanisms at grain boundaries may play a dominating role in nanomaterials. In a recent publication by the group around Dieter Wolf, this was investigated using molecular dynamics simulations at elevated temperature to render the process of diffusion accessible to the molecular dynamics time scale [149, 152]. Note that a similar approach has been taken by Buehler and coworker in studies of constrained diffusional creep in thin films [23]. The authors [149, 152] use a fully three-dimensional model of palladium, with 16 grains having a truncated-octahedral shape arranged on a three-dimensionally periodic bcc lattice. Grain sizes range from d ≈ 3�8 nm to d ≈ 15 nm, and the grain boundary misorientations are chosen such that only high-energy grain boundaries are present in the model. An EAM potential was used to model the atomic interactions. They find that grain boundary processes indeed play a dominating role and conclude that grain boundary diffusion accounts for plasticity. This result could be valid even at room temperature, once microcracking and dislocation nucleation are suppressed. Dislocation mechanisms were shut down because of the small grain size and moderate loading of the sample. The authors derive a generalized Coble-creep equation and show that the grain-size dependence of the strain rate decreases from the 1/d 3 scaling law appropriate for large grain size toward a 1/d 2 scaling law, as expected in the limit of a very small grain size (critical grain size d ≈ 7 nm). It is also concluded that grain boundary diffusion creep must be accommodated by grain boundary sliding (also referred to as Lifshitz sliding) to avoid microcracking. For further discussion see Ref. [149]. Experimental reports of the inverse Hall–Petch behavior inspired numerous simulation studies by Schiotz and coworkers [116, 118] and Swygenhoven and coworkers [37, 134, 135, 137, 138]. In contrast to the above research of Coble creep, these simulations are all preformed at low temperatures, making it basically impossible to observe any Coble creep at the present timescale. In these studies, very large stresses in the range of 1–3 GPa were applied. Schiotz et al. [116, 118] determined the yield stress �Y as a function of the grain size d. In contrast, the group around Swygenhoven focused attention on the strain rate. Both groups concluded that the deformation mechanism is controlled by grain boundary processes and that the material softens with decreasing grain size (inverse Hall–Petch effect). Nucleation of numerous partial dislocation was observed in their simulations. Schiotz and coworkers [116, 118] considered nanocrystalline copper with grain sizes from 3.3 to 6.6 nm and showed that grain boundary sliding occurs together with grain rotation. When the grain size was larger than about 5 nm, nucleation of partial dislocation was identified under very large stresses. Similar observations were also reported by Swygenhoven and coworkers [137, 138] in simulations of nickel at average grain sizes of about 5 nm at a temperature of 70 K. The results were confirmed with simulations at higher temperature and for larger grain sizes [135]. The authors suggested that GB sliding occurs through atom shuffling and stress-induced athermal grain boundary diffusion. In a later paper by Wolf et al. [149], the missing issue of the rate-limiting deformation mechanism was addressed. The authors suggest that the accommodation mechanism in the simulations described by Swygenhoven’s and Schiotz’s group is the same as that in Coble creep, with the difference that there is no activation energy for this athermal process. Therefore, the Coble creep equation should apply. They verified this proposal by an analysis of the data in [137], proving that the data points for the three smallest grain sizes fall on a straight line with a slope 2.73 ˙ in a log–log plot of the �/� versus the grain size d (Fig. 4 in Ref. [149]). It was concluded that the athermal mode of Coble creep is a result of the fact that the simulations are carried out in a regime in which molecular dynamics can not be used. The fact that Coble creep still dominates may indicate that grain boundary diffusion is a very robust mechanism for stress relaxation [149]. Recent work by Hasnaoui et al. [64] discussed the influence of the grain boundary misorientation on the ductility of nanocrysalline materials. In Fig. 30 we reproduce some results of their work. It was shown that at specific low-energy grain boundaries (e.g., twins), several neighboring grains can be effectively immobilized, creating structures that offer significant resistance to plastic deformation. Figure 30a shows the section of the computational sample is shown. The tensile direction is along the (red) x axis. The white arrows indicate the
34
Ultra–Large Scale Simulations of Dynamic Materials Failure Z
Y
2.5 Å
7
110
7
0Å
110
Z
x
Y (a)
(b)
Figure 30. (a) A cut section of the simulation cell, where atoms are colored according to their local symmetry. It can be observed that grains 110 and 7 move collectively. (b) The atoms colored according to their displacement. Grains 110 and 7 are separated by a low-angle grain boundary, which is resistant to sliding. Reprinted with permission from [64], A. Hasnaoui et al., Science 300, 1550 (2003). © 2003, American Association for the Advancement of Science.
direction of the sliding relative to the grain boundary between grains 7 and 110. It could be seen that grains 7 and 110 form a stable structure around which several other grains rotate. Figure 30b shows another section of the sample that also features grains 7 and 110. The color indicates the magnitude of the displacement, clearly showing that grains 7 and 110 (together with a few surrounding grains) form a stable entity within the other grains that are resisting to plastic deformation. The authors finally discuss the possibility to design more ductile nanostructured materials that feature less low-energy grain boundaries and that therefore lead to a more homogeneous deformation. Other studies were carried out on dislocation processes of nanocrystalline aluminum [154]. The authors demonstrate that twinning may play a very important role in the deformation of nanocrystalline aluminum. The simulations demonstrate that molecular dynamics simulations have advanced to predict deformation mechanisms of materials at a level of detail not yet accessible to experimental techniques. Results of their simulations are shown in Fig. 31. (a)
(b) 5
Grain 1
Grain 3
4 3
7
2 1 Grain 2
Grain 4
6
1. 2. 3. 4. 5.
ABCABCABCABCABCABCABC ABCABABCABCABCABCABC ABCABACABCABCABCABC ABCABACBCABCABCABC ABCABACBCBCABCABC
Figure 31. Deformation mechanism in nanocrystalline aluminum, obtained by large-scale molecular dynamics simulation. Reprinted with permission from [154], Yamakov et al., Nat. Mater. 1 (2002). © 2002, Macmillan Magazines.
35
Ultra–Large Scale Simulations of Dynamic Materials Failure
Figure 31a shows a snapshot for a grain diameter of 70 nm at about 10% plastic strain. Figure 31b shows a snapshot at about 12% strain for a grain diameter of only 45 nm. The plot reveals that numerous processes involving GB–dislocation and dislocation–dislocation interactions have taken place. Observation of twinning is quite surprising because of the small grain size and the high stacking fault energy of aluminum [163]. The predictions by these simulations have recently been verified experimentally [30]. Experimentalists conclude that twinning in aluminum only occurs in nanocrystalline materials and is not observed in coarse-grained Al. The findings support the idea that in the nanograin-regime, a transition occurs from normal slip to by partial dislocations dominated activities. The critical stress for nucleation of dislocations in nanocrystalline aluminum was estimated to be �c ≈ 2�3 GPa. Some of the experimental results are shown in Fig. 32. Figure 32a shows a transmission electron microscopy micrograph of deformation twins around an indent in nanocrystalline aluminum. The inset shows the indent with the fourfold geometry. Figure 32b depicts a HRTEM micrograph showing a deformation twin in Fig. 32a with parallel boundaries. This atomic resolution image corresponds to the [110] direction and illustrates the mirror symmetry between the twin and the matrix. The inset shows a FFT pattern confirming the twin relationship between the band and the matrix (figure reprinted with permission from Chen et al. [30]). Research has focused not only on polycrystalline nanoscale materials but also on the mechanics of single crystals with nanometer extension. Such structures may become increasingly important, for example, as interconnects in complex integrated circuits or bioelectrical devices. Studies of defect-free single nanocrystals under tension (the crystals had dimensions of several nanometers) have been carried out by Komanduri et al. [83]. Because of the small structural size of the nanocrystals, the dislocations glide quickly through the specimen leaving surface steps, and repeated glide admits plastic deformation. Similar research of mechanical properties of copper were carried out by Heino and coworkers [66]. Because of the increasingly important thin film technology, the plastic behavior of geometrically confined systems has been in the focus of recent research, and atomistic methods are being used to study the plastic behavior. In atomistic simulations [23, 25], diffusional creep involving dislocation climb leading to formation of diffusion wedges and associated glissile dislocation mechanisms was studied in multimillion molecular dynamics simulations carried out over several nanoseconds. They have extracted critical conditions for dislocation nucleation from their molecular dynamics results, and used the suggestions of the molecular dynamics results to develop a continuum model for dislocation nucleation from diffusion wedges in the spirit of the Rice–Thomson model [111]. In addition, the molecular dynamics A
B 1.6 µm
30 nm
5 nm
Figure 32. (A) Transmission electron microscopy micrograph of deformation twins around an indent in nanocrystalline aluminum. The inset shows the indent with the fourfold geometry. (B) HRTEM micrograph showing a deformation twin in (A) with parallel boundaries. This atomic resolution image corresponds to the [110] direction and illustrates the mirror symmetry between the twin and the matrix. The inset shows a FFT pattern confirming the twin relationship between the band and the matrix. Reprinted with permission from [30], M. W. Chen et al., Science 300, 1275 (2003). © 2003, American Association for the Advancement of Science.
36
Ultra–Large Scale Simulations of Dynamic Materials Failure
Figure 33. Spontaneous encapsulation of a DNA molecule into a carbon nanotube. Courtesy Yong Kong, MPI-MF [49].
simulation results are being used in a hierarchical multiscale simulation scheme at the mesoscopic scale. We refer the reader to another chapter in the handbook that is focused on the mechanics of submicron thin copper films.
9.4. Materials Science–Biology Interactions and Modeling of Nanostructures In recent years, a trend to combine studies of classical materials science areas with biological applications became apparent. Numerous studies focused on modeling of carbon nanotubes. In a recent paper by Gao et al. [49], interaction of DNA with carbon nanotubes was studied. The authors showed that on a critical radius, the DNA is spontaneously encapsulated into the carbon nanotube. A snapshot of such simulations is shown in Fig. 33. Other studies focused on the mechanical properties of carbon nanotubes (see, e.g., [27, 151] ). When the CNTs approach sizes close to micrometer dimensions, large-scale computers become suitable tools for investigation. In Fig. 34 we show several snapshots of CNTs under compression, as reported in Ref. [27]. The plot shows an overview of deformation mechanisms of SWNTs in compression. In Ref. [27], this was referred to as a shell–rod–wire transition as a function of the length-to-diameter aspect ratio of the CNT. The plot shows different modes of deformation: buckling of the cylindrical shell structure, rodlike behavior with localized buckling along the length of the tube, and a flexible macromolecule. Statistical
(a) rod
(b)
shell
wire (c) Figure 34. Overview of deformation mechanisms of SWNTs in compression: Shell–rod–wire transition as a function of the length-to-diameter aspect ratio of the CNT [27]. The plot shows different modes of deformation: (a) buckling of the cylindrical shell structure, (b) rodlike behavior with localized buckling along the length of the tube, and (c) a flexible macromolecule.
Ultra–Large Scale Simulations of Dynamic Materials Failure
37
Figure 35. Snapshot of a self-folded CNT. The structure is in thermodynamic equilibrium [27].
mechanics and entropic forces may play a role in the third class—the wirelike behavior of nanotubes with very large aspect ratios. Statistical theories of macromolecules may be used to analyze the dynamics of such nanostructures. Thermodynamical properties of very long and thin CNTs could be an interesting subject for further study. The observation of a “self-folding” mechanism [27] in which different parts of the same CNT are brought into adhesive contact indicates that CNTs become very flexible at very large aspect ratios. In this case, different parts of the CNTs attract each other because of the van der Waals interaction. It could be interesting to further study such self-folding under entropical forces. A folded CNT is shown in Fig. 35.
10. CONCLUSIONS AND DISCUSSION In this chapter, we reviewed ultra–large scale simulations of dynamic materials failure, including topics such as brittle fracture and ductile bending, mechanical properties of nanostructured materials, mechanics and dynamics of nanotubes, and bio-nano-interactions (e.g., nanotube-DNA). Some of the topics contain the words “tera-nano-bio,” which could be potential keywords of mechanics in the 21st century. Mechanics in the new millennium could be characterized by strong interdisciplinary orientation, bringing together variety of fields. Molecular dynamics simulations such as discussed in this chapter may play an important role in future development of mechanics. Classical molecular dynamics was the focus of this chapter, and we have shown that the method has gone a long way since the earliest molecular dynamics simulations of fracture almost 30 years ago by Ashurst and Hoover [11], reaching several billion atoms nowadays and complex bio-nano problems [49]. Because molecular dynamics methods in conjunction with teraflop computing have become applicable to system sizes of micrometers with several billions of particles in the new millennium, it could also be the method of choice to study atomic plasticity for many practical problems arising in nano- and microengineering. It is foreseeable that, without relying on complicated models to extend the length scales by coupling techniques, molecular dynamics simulations could provide a uniform approach with unique strength for certain class of problems. As a matter of fact, ongoing miniaturization of technology has led to a situation in which the problems of interest almost directly fall within the scope in which molecular dynamics simulations are feasible. Recent research advances illustrate that it is possible to study diffusion-assisted plasticity, and interaction of diffusion and dislocation based mechanisms [23, 152, 153], with today’s supercomputers. The fact that these fields are not considered the “classical” area of molecular dynamics techniques illustrates that there may indeed be room for further substantial development of the molecular dynamics method in the near future. With the ongoing development of advanced molecular dynamics simulation techniques, such as the TAD method [147], the atomic scale may also be able to reach the timescale of seconds or longer.
38
Ultra–Large Scale Simulations of Dynamic Materials Failure
We have also discussed that there is a trend in the last decade to develop techniques that provide seamless coupling of different length scales and methods. However, a major drawback of such multiscale methods is their lack of proper thermodynamic coupling between different length scales. Also, many of the methods are very difficult to be applied to general problems. Mostly such techniques are used to study academic problems suitable for the numerical approach of choice. For such techniques to become more popular, the general applicability is one of the important remaining issues. Finally, we remark that there is a tendency for different scientific disciplines to be reunified. After the split into numerous different disciplines (physics, mechanics, chemistry) over a few centuries, in the new millennium the disciplinary barriers appear to be falling apart. Interdisciplinary approaches may provide key impact and stimuli pushing the technological and scientific frontiers. We believe that molecular dynamics and supercomputers could play a key role in the 21st century.
ACKNOWLEDGMENTS We acknowledge Dr. Farid F. Abraham for many inspiring discussions on simulating materials failure with atomistic methods. The simulations reported in this chapter were carried out at the Max Planck Society Supercomputer Center in Munich, Germany. We gratefully acknowledge this. We also acknowledge helpful discussions with Art F. Voter. We are grateful to the Los Alamos National Laboratory of the United States for providing us with some of their atomistic simulation codes.
REFERENCES 1. 2. 3. 4. 5. 6. 7. 8. 9. 10. 11. 12. 13. 14. 15. 16. 17. 18. 19. 20. 21. 22. 23. 24. 25. 26. 27. 28. 29. 30. 31.
F. F. Abraham, Phys. Rev. Lett. 77, 869 (1996). F. F. Abraham, N. Bernstein, J. Q. Broughton, and D. Hess, MRS Bull. 25, 27 (2000). F. F. Abraham, D. Brodbeck, R. A. Rafey, and W. E. Rudge, Phys. Rev. Lett. 73, 272 (1994). F. F. Abraham, D. Brodbeck, W. E. Rudge, J. Q. Broughton, D. Schneider, B. Land, D. Lifka, J. Gerner, M. Rosenkranz, J. Skivira, and H. Gao, Modelling Simul. Mater. Sci. Eng. 6, 639 (1998). F. F. Abraham, D. Brodbeck, W. E. Rudge, and X. Xu, J. Mech. Phys. Solids 45, 1595 (1997). F. F. Abraham, J. Q. Broughton, N. Bernstein, and E. Kaxiras, Comp. Phys. 12, 538 (1998). F. F. Abraham, R. Walkup, H. Gao, M. Duchaineau, T. D. de La Rubia, and M. Seager, Proc. Natl. Acad. Sci. 99, 5788 (2002). F. F. Abraham, R. Walkup, H. Gao, M. Duchaineau, T. D. de La Rubia, and M. Seager, Proc. Natl. Acad. Sci. 99, 5783 (2002). M. P. Allen and D. J. Tildesley, “Computer Simulation of Liquids.” Oxford University Press, 1989. J. E. Angelo, N. R. Moody, and M. I. Baskes, Modelling Simul. Mater. Sci. Eng. 3, 289 (1995). W. T. Ashurst and W. G. Hoover, Phys. Rev. B 14, 1465 (1976). B. R. Baker, J. Appl. Mech. 29, 567 (1962). M. I. Baskes, Phys. Rev. B 29, 6443 (1984). K. J. Bathe, “Finite Element Procedures in Engineering Analysis.” Prentice-Hall, 1982. V. K. Kinra and B. Q. Vu, Eng. Fracture Mech. 15, 107 (1981). K. B. Broberg, “Cracks and Fracture.” Academic Press, 1990. M. J. Buehler, F. F. Abraham, and H. Gao, Springer Lecture Notes (unpublished). M. J. Buehler, F. F. Abraham, and H. Gao, Nature 426, 141 (2003). M. J. Buehler, T. J. Balk, H. Gao, and E. Arzt, “Handbook of Theoretical and Computational Nanotechnology.” American Scientific Publishers, 2004. M. J. Buehler and H. Gao, Phys. Zeit 35, (2004). M. J. Buehler, H. Gao, and Y. Huang, Comp. Mat. Sci. 28, 385 (2003). M. J. Buehler, H. Gao, and Y. Huang, Theoret. Appl. Fracture Mech. (2003) (unpublished). M. J. Buehler, A. Hartmaier, and H. Gao, J. Mech. Phys. Solids 51, 2105 (2003). M. J. Buehler, A. Hartmaier, and H. Gao, Mat. Res. Soc. Proc. 779, W4.7 (2003). M. J. Buehler, A. Hartmaier, and H. Gao, Modelling and Simulation in Materials Science and Engineering, 2003 (unpublished). M. J. Buehler, A. Hartmaier, H. Gao, F. F. Abraham, and M. Duchaineau, Comp. Meth. Appl. Mech. Eng. 2004 (unpublished). M. J. Buehler, Y. Kong, and H. Gao, J. Eng. Mat. Tech. 2003 (unpublished). V. Bulatov, F. F. Abraham, L. Kubin, B. Devincre, and S. Yip, Nature 391, 669 (1998). R. Car and M. Parrinello, Phys. Rev. Lett. 55, 2471 (1985). M. W. Chen, E. Ma, K. J. Hemker, Y. Wang, H. Sheng, and C. Xuemei, Science 300, 1275 (2003). F. J. Cherne, M. I. Baskes, and P. A. Deymier, Phys. Rev. A 65, 024209 (2002).
Ultra–Large Scale Simulations of Dynamic Materials Failure 32. 33. 34. 35. 36. 37. 38. 39. 40. 41. 42. 43. 44. 45. 46. 47. 48. 49. 50. 51. 52. 53. 54. 55. 56. 57. 58. 59. 60. 61. 62. 63. 64. 65. 66. 67. 68. 69. 70. 71. 72. 73. 74. 75. 76. 77. 78. 79. 80. 81. 82. 83. 84. 85. 86. 87. 88. 89. 90. 91. 92. 93.
39
F. Cleri, S. Yip, D. Wolf, and S. Philpot, Phys. Rev. Lett. 79, 1309 (1997). R. L. Coble, J. Appl. Phys. 41, 1679 (1963). J. Cserti, M. Khantha, V. Vitek, and D. P. Pope, Mat. Sci. Eng. A 152, 95 (1998). O. R. de la Fuente, J. A. Zimmerman, M. A. Gonzalez, J. de la Figuera, J. C. Hamilton, W. W. Pai, and J. M. Rojo, Phys. Rev. Lett. 88, 036101 (2001). B. deCelis, A. S. Argon, and S. Yip, J. Appl. Phys. 54, 4864 (1983). P. M. Derlet, A. Hasnaoui, and H. van Swygenhoven, Scripta Mater. 49, 629 (2003). F. Ercolessi and J. B. Adams, Europhys. Lett. 28, 583 (1994). D. Faken and H. Jonsson, Comp. Mater. Sci. 2, 279 (1994). R. P. Feynman, “Feynman Lectures on Physics.” Addison-Wesley, 1970. J. Fineberg, S. P. Gross, M. Marder, and H. L. Swinney, Phys. Rev. Lett. 67, 457 (1991). M. W. Finnis and J. E. Sinclair, Phil. Mag. A 50, 45 (1984). L. B. Freund, J. Appl. Mech. 54, 553 (1987). L. B. Freund, “Dynamic Fracture Mechanics.” Cambridge University Press, 1990. H. Gao, J. Mech. Phys. Solids 44, 1453 (1996). H. Gao, Philos. Mag. Lett. 76, 307 (1997). H. Gao, in “European White Book on Fundamental Research in Materials Science,” pp. 144–148, 2001. H. Gao, Y. Huang, and F. F. Abraham, J. Mech. Phys. Solids 49, 2113 (2001). H. Gao, Y. Kong, D. Cui, and C. S. Ozkan, Nano Lett. 3, 471 (2003). H. Gao, L. Zhang, W. D. Nix, C. V. Thompson, and E. Arzt, Acta Mater. 47, 2865 (1999). E. Gerde and M. Marder, Nature 413, 285 (2001). T. C. Germann and A. F. Voter, Proceedings of the Comput. Nanosci. and Nanotech. 3, 140 (2002). A. Girshick, D. G. Pettifor, and V. Vitek, Phil. Mag. A 77, 999 (1998). J. E. Gordon, “The New Science of Strong Materials.” Princeton University Press, Princeton, NJ, 1984. A. Gouldstone, K. J. Van Vliet, and S. Suresh, Nature 411, 656 (2001). A. A. Griffith, Philos. Trans. Roy. Soc. A 221, 163 (1920). W. Gropp, W. Lusk, and A. Skjellum, “Using MPI,” 2nd ed. MIT Press, 1999. P. Gumbsch, Z. Metallkd. 87, 341 (1996). P. Gumbsch and G. E. Beltz, Model. Sim. Math. Sci. Eng. 3, 597 (1995). P. Gumbsch and H. Gao, Science 283, 965 (1999). P. Gumbsch, S. J. Zhou, and B. L. Holian, Phys. Rev. B 55, 3445 (1997). A. Hartmaier, M. J. Buehler, and H. Gao, Diffusion Defect Forum 2003. A. J. Haslam, D. Moldovan, S. R. Phillpot, D. Wolf, and H. Gleiter, Comput. Mat. Sci. 23, 15 (2003). A. Hasnaoui, H. van Swygenhoven, and P. M. Derlet, Science 300, 1550 (2003). J. A. Hauch, D. Holland, M. Marder, and H. L. Swinney, Phys. Rev. Lett. 82, 3823 (1999). P. Heino, H. Häkkinen, and K. Kaski, Europhys. Lett. 41, 273 (1998). J. P. Hirth and J. Lothe, “Theory of Dislocations.” Wiley-Interscience, 1982. R. G. Hoagland, P. C. Gehlen, and J. P. Hirth, Phil. Mag. 34 (1976). D. Holland and M. Marder, Phys. Rev. Lett. 80, 746 (1998). D. Holland and M. Marder, Adv. Mat. 11, 793 (1999). J. D. Honeycutt and H. C. Andersen, J. Phys. Chem. 91, 4950 (1987). M. F. Horstemeyer, M. I. Baskes, V. C. Prandtl, J. Philliber, and S. Vonderheid, Modelling Simulation Mat. Sci. 11, 265 (2003). Y. Huang and H. Gao, J. Appl. Mech. 68, 169 (2001). Y. Huang and H. Gao, J. Appl. Mech. 69, 76 (2002). D. Hull and D. J. Bacon, “Introduction to Dislocations.” Butterworth Heinemann, 2002. G. R. Irwin, “Fracture Dynamics.” American Society of Metals, 1948. K. W. Jacobsen and J. Schiotz, Nature Mat. 1, 15 (2002). I. Kaur and W. Gust, “Handbook of Grain and Interface Boundary Diffusion Data.” Ziegler Press, Stuttgart, 1989. C. Kelchner, S. J. Plimpton, and J. C. Hamilton, Phys. Rev. B 58, 11085 (1998). P. Klein and H. Gao, Eng. Fract. Mech. 61, 21 (1998). P. A. Klein, J. W. Foulk, E. P. Chen, S. A. Wimmer, and H. J. Gao, Theoret. Appl. Fract. Mech. 37, 99 (2001). S. Kohlhoff, P. Gumbsch, and H. F. Fischmeister, Phil. Mag. A 64, 851 (1991). R. Komanduri, N. Chandrasekaran, and L. M. Raff, Int. J. Mech. Sci. 43, 2237 (2001). M. Koning, R. Miller, V. V. Bulatov, and F. F. Abraham, Phil. Mag. A 82, 2511 (2002). A. Laioa and M. Parrinello, Proc. Natl. Acad. Sci. 99, 12562 (2002). J. Li, K. J. van Vliet, T. Zhu, S. Yip, and S. Suresh, Nature 418, 307 (2002). R. Madec, B. Devincre, L. Kubin, T. Hoc, and D. Rodney, Science 301, 1879 (2003). M. Marder, Comput. Sci. Eng. 1, 48 (1999). M. Marder and J. Fineberg, Phys. Today 49, 24 (1996). M. Marder and S. Gross, J. Mech. Phys. Solids 43, 1 (1995). D. Marx and J. Hutter, “Modern Methods and Algorithms in Quantum Chemistry,” p. 1. Forschungzentrum Jülich, NIC Series, 2000. Y. Mishin, D. Farkas, M. J. Mehl, and D. A. Papaconstantopoulos, Phys. Rev. B 59, 3393407 (1998). Y. Mishin, M. J. Mehl, D. A. Papaconstantopoulos, A. F. Voter, and J. D. Kress, Phys. Rev. B 63, 224106 (2001).
40 94. 95. 96. 97. 98. 99. 100. 101. 102. 103. 104. 105. 106. 107. 108. 109. 110. 111. 112. 113. 114. 115. 116. 117. 118. 119. 120. 121. 122. 123. 124. 125. 126. 127. 128. 129. 130. 131. 132. 133. 134. 135. 136. 137. 138. 139. 140. 141. 142. 143. 144. 145. 146. 147. 148. 149. 150. 151. 152. 153. 154. 155. 156.
Ultra–Large Scale Simulations of Dynamic Materials Failure D. Moldovan, D. Wolf, S. R. Phillpot, and A. J. Haslam, Phi. Mag. A 82, 1271 (2002). F. Montalenti, M. R. Sorensen, and A. F. Voter, Phys. Rev. Lett. 87, 126101 (2001). F. Montalenti, A. F. Voter, and R. Ferrando, Phys. Rev. B 66, 205404 (2002). P. M. Morse, Phys. Rev. 34, 57 (1929). A. Nakano, M. E. Bachlechner, R. K. Kalia, E. Lidorikis, P. Vashishta, and G. Z. Voyiadijs, Comp. Sci. Eng. 56 (2001). T. D. Nguyen, S. Govindjee, P. A. Klein, and H. Gao, Computer Meth. Appl. Mech. Eng. (2003). L. Nicola, E. Van der Giessen, and A. Needleman, J. Appl. Phys. 93, 5920 (2003). T. G. Nieh and J. Wadsworth, Scripta Met. 25 (1991). W. D. Nix, Metal. Trans. A 20, 2217 (1989). W. D. Nix, Scripta Mater. 39, 545 (2001). D. J. Oh and R. A. Johnson, J. Mater. Res. 3, 471 (1988). S. Plimpton, J. Comp. Phys. 117, 1 (1995). E. Kaxiras (private communication). Y. Qi, A. Strachan, T. Cagin, and W. A. Goddard III, Mat. Sci. Eng. A 145, 309 (2001). A. Rahman, Phys. Rev. 136, A405 (1964). J. R. Rice, J. Mech. Phys. Solids 40, 239 (1992). J. R. Rice and G. B. Beltz, J. Mech. Phys. Solids 42, 333 (1994). J. R. Rice and R. M. Thomson, Phil. Mag. 29, 73 (1974). A. J. Rosakis, Adv. Phys. 51, 1189 (2002). A. J. Rosakis, O. Samudrala, and D. Coker, Science 284, 1337 (1999). J. Roth, F. Gähler, and H.-R. Trebin, Int. J. Mod. Phys. C 11, 317 (2000). C. L. Rountree, R. K. Kalia, E. Lidorikis, A. Nakano, L. van Brutzel, and P. Vashishta, Ann. Rev. Mat. Res. 32, 377 (2002). J. Schiotz, D. DiTolla, and K. W. Yacobsen, Nature 391, 561 (1998). J. Schiotz, T. Leffers, and B. N. Singh, Philos. Mag. Lett. 81, 301 (2001). J. Schiotz, T. Vegge, D. DiTolla, and K. W. Yacobsen, Phys. Rev. B 60, 11971 (1999). K. W. Schwarz, J. Appl. Phys. 85, 108 (1999). A. Sharma, R. K. Kalia, and P. Vashishta, Comp. Sci. Eng. 26 (2003). V. Shenoy, R. Miller, E. B. Tadmor, D. Rodney, R. Phillips, and M. Ortiz, J. Mech. Phys. Sol. 73, 611 (1999). V. B. Shenoy, R. Miller, E. B. Tadmor, R. Phillips, and M. Ortiz, Phys. Rev. Lett. 80, 742 (1998). M. Springborg, “Density-Functional Methods in Chemistry and Materials Science.” Wiley Research Series in Theoretical Chemistry, 1997. F. Stillinger and T. A. Weber, Phys. Rev. B 31, 5262 (1985). J. Stone, J. Gullingsrud, P. Grayson, and K. Schulten, in “2001 ACM Symposium on Interactive 3D Graphics,” pp. 191–194, 2001. J. G. Swadener, M. I. Baskes, and M. Nastasi, Phys. Rev. Lett. 89, 085503 (2002). E. B. Tadmor, M. Ortiz, and R. Phillips, Philos. Mag. A 73, 1529 (1996). G. I. Taylor, Proc. Roy. Soc. A 145, 362 (1934). J. Tersoff, Phys. Rev. Lett. 61, 2879 (1988). T. Torba, A. E. Torda, and W. F. van Gunsteren, J. Comp. 8, 695 (1994). D. H. Tsai, J. Chem. Phys. 70, 1375 (1979). B. P. Uberuaga, S. J. Stuart, and A. F. Voter, Proc. Comp. Nanosci. Nanotech. 128 (2002). B. van Beest, G. Kramer, and R. van Santen, Phys. Rev. Lett. 64, 1955 (1990). H. van Swygenhoven and A. Caro, Phys. Rev. B 58, 11246 (1998). H. van Swygenhoven and P. M. Derlet, Phys. Rev. B 64, 224105 (2001). H. van Swygenhoven, P. M. Derlet, and A. Hasnaoui, Phys. Rev. B 66, 024101 (2002). H. van Swygenhoven, M. Spaczer, and A. Caro, Acta Mat. 47, 3117 (1999). H. van Swygenhoven, M. Spaczer, A. Caro, and D. Farkas, Phys. Rev. B 60, 22 (1999). H. van Swygenhoven, M. Spaczer, A. Caro, and D. Farkas, Phys. Rev. B 60, 22 (2002). P. Vashishta, R. K. Kalia, and A. Nakano, Comp. Sci. Eng. 56 (1999). P. Vashishta, R. K. Kalia, and A. Nakano, J. Nanoparticle Res. 5, 119 (2003). B. von Blanckenhagen, P. Gumbsch, and E. Arzt, 9, 157 (2001). A. F. Voter, “Principles,” Vol. 1, p. 7790. Wiley, New York, 1984. A. F. Voter, Phys. Rev. Lett. 78, 3908 (1997). A. F. Voter, Phys. Rev. B 57, 985 (1998). A. F. Voter and S. P. Chen, Mater. Res. Soc. Symp. Proc. 82, 175180 (1987). A. F. Voter, F. Montalenti, and T. C. Germann, Ann. Rev. Mat. Res. 32, 321 (2002). N. J. Wagner, B. L. Holian, and A. F. Voter, Phys. Rev. A 45, 8457 (1992). D. Wolf, V. Yamakov, S. R. Phillpot, and A. K. Mukherjee, Z. Metallk. 94, 1052 (2003). K. W. Yacobsen, K. S., and M. J. Puska, Phys. Rev. B 35, 7423 (1987). K. W. Yacobsen, P. Stoltze, and J. K. Norskov, Surf. Sci. 366, 394 (1996). V. Yamakov, D. Wolf, S. R. Phillpot, and H. Gleiter, Acta Mater. 50, 61 (2002). V. Yamakov, D. Wolf, S. R. Phillpot, and H. Gleiter, Phil. Mag. Lett. 83, 385 (2003). V. Yamakov, D. Wolf, S. R. Phillpot, A. K. Mukherjee, and H. Gleiter, Nat. Mater. 1, 1 (2002). V. Yamakov, D. Wolf, M. Salazar, S. R. Phillpot, and H. Gleiter, Acta Mater. 49, 2713 (2001). S. Yip, Nature 391, 532 (1998).
Ultra–Large Scale Simulations of Dynamic Materials Failure 157. 158. 159. 160. 161. 162.
41
E. H. Yoffe, Philos. Mag. 42, 739 (1951). M. Zhou, Phil. Mag. A 82 (2002). S. J. Zhou, D. M. Beazly, P. S. Lomdahl, and B. L. Holian, Phys. Rev. Lett. 78, 479 (1997). S. J. Zhou, D. L. Preston, P. S. Lomdahl, and D. M. Beazley, Science 279, 1525 (1998). J. A. Zimmerman, H. Gao, and F. F. Abraham, Modelling Simul. Mater. Sci. Eng. 8, 103 (2000). J. A. Zimmerman, C. L. Kelchner, P. A. Klein, J. C. Hamilton, and S. M. Foiles, Phys. Rev. Lett. 87, 165507 (2001). 163. J. Zimmermann, Ph.D. thesis, Stanford University, 1999.