2015 IEEE 33rd VLSI Test Symposium (VTS)
!
Ultrafast Stimulus Error Removal Algorithm for ADC ! Linearity Test Tao Chen, Degang Chen Department of Electrical and Computer Engineering Iowa State University, Ames, IA, USA
[email protected] [email protected] Abstract— Linearity test of an analog-to-digital converter (ADC) can be very challenging because it requires a signal generator substantially more linear than the ADC under test. For high performance ADCs, the overall manufacturing cost could be dominated by the long test time and the high-precision test instruments. This paper introduces the ultrafast stimulus error removal and segmented model identification of linearity errors (USER-SMILE) method for high resolution ADC linearity test, allowing the stimulus signal's linearity requirement to be significantly relaxed and the test time to be reduced by orders of magnitude compared to the state-of-art histogram method. The USER-SMILE algorithm uses two nonlinear but functionally related input signals as ADC excitations and uses a stimulus error removal technique to recover test accuracy. The USERSMILE algorithm also uses the ultrafast segmented model identification of linearity errors (uSMILE) approach to dramatically reduce test time while achieving test accuracy and coverage superior to the histogram method. The USER-SMILE algorithm is validated by extensive simulation with different types of ADCs, different resolution levels, and different types of input signals including nonlinear ramps, nonlinear sine waves and even random input signals. Statistical simulation results show that for a 16-bit SAR ADC, with two 1 hit/code nonlinear ramp signals, the INL test error is within +/- 0.4LSB. Keywords—Analog-to-digital converter; integral nonlinearity; histogram; ultrafast stimulus error removal and segmented model identification of linearity errors (USER-SMILE); built-in-self-test
I. INTRODUCTION The analog-to-digital converter (ADC) is one of the most important analog and mixed signal (AMS) products [1]. Accurate linearity test of ADC can be very challenging, especially for high resolution ADCs [2]. As the manufacturing cost goes down, the test cost becomes more and more dominant in the overall cost. The ADC test cost is mainly due to the test equipment cost and the test time. To test the ADC nonlinearity, the state-of-art histogram method uses a highly linear signal generated from the high-precision automated test equipment (ATE) [3-6]. The signal source is required to be substantially more linear than the device under test (DUT). It becomes more and more difficult to generate linear source as the ADC resolution goes high. Furthermore, the histogram method requires much more samples than the number of transitions in the ADC. As the industry standard, the histogram test usually uses tens or even hundreds hits per code to accurately test the The work is supported in part by Freescale Semiconductor and Semiconductor Research Corporation. 978-1-4799-7597-6/15/$31.00 ©2015 IEEE
ADC nonlinearity, which results in a very long data acquisition time. For high resolution ADC (higher than 16-bit), it is usually not practical to fully test the ADC linearity in production test due to the extremely long test time. The stringent requirement on the input signal linearity and the extremely long time test become the challenges in the AMS test. Significant works have been done to overcome these challenges. Recently, researchers have developed different ways to address the stringent linearity requirement of the input signal. In [7], the author employed the delta-sigma modulation technique to generate the highly linear input signal. However, it is not easy to design such a signal generator as the ADC’s resolution or speed goes high. The design complexity often increases the cost. In the contrast, some researchers have put efforts on algorithms to relax the stimulus linearity requirement. In [8-10], stimulus error identification and removal (SEIR) algorithm is proposed to test precision ADC using nonlinear stimulus. It has been proved that 7-bit linear ramp signal can be used to test high resolution ADC and achieve more than 16 bits accuracy. A constant offset is required to identify the nonlinear components in the signal source. As the requirement on the input signal linearity is relaxed, built-in-self-test for ADC full code INL/DNL test becomes practical. However, SEIR is based on the histogram method, which means the data acquisition time is still very long. Other than relaxing the input signal requirement, lots of efforts have been made to reduce the test time. In [11, 12], a method was proposed to use fast Fourier transform (FFT) test to estimate the ADC’s INL. In [13], the INL can be estimated with a combined spectral and histogram method. A system identification approach is proposed in [14] to evaluate the nonlinearity of a pipeline ADC. In [15], the author uses the polynomial fitting method with low resolution input signal to test the ADC nonlinearity. In [16], Goyal, et al introduced a selective code measurement method to reduce the test time of SAR ADCs. However, all above methods or similar ones reduce the test time by sacrificing other test aspects, so that they cannot achieve similar coverage or test accuracy than the histogram method. Therefore, the application is very limited. An ultrafast segmented model identification of linearity errors (uSMILE) [17] algorithm was proposed recently to take a system identification approach to capture both linear and nonlinear errors in the ADC. With the concept of the segmented non-parametric model, the algorithm can reduce the
! x t
test data by a factor of over 100 and achieve a test accuracy superior to the histogram method. However, it still requires highly !linear input signal source. In summary, the existing solutions have at least one of the following issues: long test time, highly linear stimulus, low accuracy or coverage. Currently there is no valid solution to resolve all these issues at the same time. Test time is an important factor in AMS test and accurate input signal cannot be easily implemented on chip. There is a strong need to test the ADC using an easy-to-implement signal generator with much less test time. In this paper, a new algorithm combing the concept of SEIR and uSMILE is proposed for accurate linearity test with dramatically reduced test time and also relaxes the requirement on source linearity. Two nonlinear input signals with constant offset between them are applied to the ADC. Two sets of ADC output codes will be generated. Segmented non-parametric model is used to represent the final INL. Rather than directly finding the INL of the ADC, the INL is indirectly evaluated from the difference of the segmented INL by subtracting the two sets of the output codes. The test accuracy and coverage is superior to the state-of-art histogram method. The following of this paper is organized as follows. Section II reviews two fundamental algorithms: the SEIR and the uSMILE algorithm. Section III presents the proposed algorithm. Section IV shows the simulation results. And section V concludes the paper. The SEIR algorithm relaxes the linearity requirement on the input signal by injecting a constant offset in the input signal. The uSMILE algorithm significantly reduces the test time with the segmented non-parametric model. These two algorithms are the basis of the USER-SMILE algorithm and will be reviewed below. A. SEIR Define the nonlinear ramp signal to be x t and normalize 0 tN 1 and is the transition level the time so that t for output from code k-1 to code k. Then it can be expressed as T
T t
TN
F t
(1)
where F t is the nonlinear component of the ramp signal. The nonlinear component can be estimated using a set of basis ∑ a F t . The INL measured by nonlinear function F t ramp will be: INL
N
2 t
k
INL
F t
(2)
is the estimated INL using nonlinear ramp and where INL is the corrected INL after removing the nonlinear component in the input signal. 2
x t
x t
T
T T
α
(4)
Then, x t and x t can be expressed with transition points and the nonlinear components as:
T
T t
TN
T t T t
TN TN
F t F t
(5) α
(6)
F t F t
, ,
,
α
,
(7) Since the number of equations is much larger than the number of the unknowns, least square can be used to estimate the unknowns. The coefficients of F and the constant offset α can be obtained from equation (8). a ,a ,a ,
arg min ∑
, aM, α
∑a F t
,
N
2 t F t
,
t
,
α
,
(8) Then, the nonlinear component of the input ramp signal has been identified. The INL can be reconstructed by removing the or nonlinear component from input signal. Either INL INL can be used for the evaluated INL. N
INL
N
2 t
2 t
∑M a F t ∑M a F t
k
k
(9)
α
(10)
B. uSMILE Different from the SEIR, the uSMILE algorithm was proposed to significantly reduce the test time as well as achieve better accuracy. By a system identification approach with a segmented non-parametric model, the algorithm is able to capture the nonlinearity of the ADC with much less test data. The segmented non-parametric model in the INL curve is to break down the INL into different segments. For example, an INL curve can be broken into 64 segments if 6 MSB bits are used. For each MSB segment, this short INL curve can be further broken into smaller segments (for example, 5 ISB bits). Similarly, the ISB can be broken into LSB (for example, 5 LSB bits). For each segment, there is a corresponding error term. , where is the Define the MSB error term to be code of the MSB bits. Then, the errors for 64 segments are (0), (1), …, (63) corresponding to the MSB code. and are defined for ISB and LSB errors Similarly, respectively and they are also called “segmented INL” in the following of this paper. The final INL value for code C will be: (11)
(3)
For two ramp signal, x t and x t have a constant offset α.
T t
TN
For the transition level from code k-1 to code k, we can get T x t , x t , . Replace x t , and x t , with equation (1), equation (7) is obtained.
INL
II. BACKGROUND
x t
x t
T
For an input signal, there will be an ideal expected output . Due to the ADC nonlinearity, the actual output code becomes . Then, the input output relationship can be created: (12) where q is the noise.
! In order to estimate the INL with the segmented nonparametric model, the linear input signal information is used. With a! pure sine wave as the ADC’s input signal, a linear ADC will get a linear sine wave in the output. However, due to the nonlinearity existing in the ADC, the output will have harmonics and other components. From the actual ADC’s output code, the DC and fundamental components can be extracted in the frequency domain and an ideal ADC is constructed using the DC and fundamental only. In other words, after removing the DC and fundamental in the frequency domain, everything else are just noise and nonlinear components in the actual ADC. After identifying the MSB, ISB and LSB errors, the final full-code INL can be constructed.
·
(18) with α and re-arrange the
Replace the equation: α
III. USER-SMILE This section proposes the USER-SMILE algorithm to identify the INL/DNL using nonlinear input signal and with much less test data, and achieve better test coverage and accuracy than the histogram test. Two identical input signals with constant offset between them are applied to the ADC. In the USER-SMILE, by subtracting the two sets of output data, the input signal information is no longer needed. Any error or nonlinearity in the stimulus is completely removed. At this point, there’s no assumption on the input signal linearity. Some other restrictions on the input signal will be discussed later. Apply two input signals V constant offset α. V
V
and V
to the ADC with a
α
(13) and C
The converted output codes from ADC are C Then, equation (14) and (15) are obtained:
.
V
w
T
q
C
· VLSB
INL
q
(14)
V
w
T
q
C
· VLSB
INL
q
(15)
where the noise w and w are the input-referred noise and T is the transition voltage for output code from C to C+1. And q in the equation is the quantization noise. With the segmented non-parametric model, the INL can be broken into MSB segments, ISB segments and LSB segments. The total nonlinearity error for code C can be written into the same format in equation (11). Then, the equation (14) and (15) can be expressed as: ·
· ·
· (16)
·
· ·
· (17)
By subtracting the two equations (16) and (17), we can get equation (18):
/ (19) Assume that the input-referred noise is at a certain level and the quantization noise will be “whitened”. So the term can be considered as one random noise. For this overdetermined system, the least square algorithm can be used to find the unknowns , and . With least square method, the noise term will be effectively averaged out. Then, the full code INL can be constructed. Some crucial parts in the algorithm are discussed below: A. Segmented non-parametric model USER-SMILE leverages the segmented non-parametric model in the uSMILE algorithm. It treats the ADC itself as a black box and accurately models the actual INL curve. Any linear errors (mismatch and gain) and nonlinear error (voltage coefficients or code dependent parasitics) can be captured. Any advantages and restrictions in the segmented non-parametric model are also applied to the USER-SMILE algorithm. Therefore, with the segmented non-parametric model, the USER-SMILE algorithm can significantly reduce the test time. For a 16-bit ADC with 6-5-5 segmentation (6 MSB bits, 5 ISB bit and 5 LSB bits), only 128 unknowns need to be solved and the results can accurately reflect the actual INL. However, there are also some limitations. The segmented non-parametric model is intended for high resolution ADCs whose architecture facilitates a segmented structure of the INL curve. So, the USER-SMILE method is not intended for flash ADC or delta sigma ADC. For other types of ADCs such as SAR ADC, Cyclic ADC, Pipeline ADC, the USER-SMILE algorithm works well. B. Stimulus Requirement It is usually difficult to design a fast and highly linear signal generator on chip. If we can relax the requirement on the stimulus, the signal generator design complexity and cost can be significantly reduced. By subtracting the two equations (16) and (17), the information of input signal is no longer needed. And there is no assumption on the signal linearity or the signal shape. However, there’s still some constrains to the stimulus. Take an extreme case: if we use a fixed voltage to test the ADC, the ADC is always producing a similar code. There is no way to
! get the information of other codes. So, to achieve good estimation accuracy, the input signal should cover as most codes. !Each segment (in MSB, ISB and LSB) needs to have sufficient coverage.
0.5
-1 -1.5
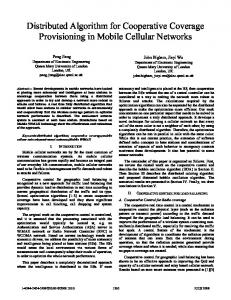
To verify the algorithm, extensive simulations have been done on different ADC architectures (SAR, Pipeline, and Cyclic) with various resolutions. The simulation results show that the algorithm works well with different architectures. SAR ADC is particularly studied due to its wide usage, high resolution and low power. A 16-bit SAR ADC is modeled with random capacitor mismatches. The true INL is constructed from the transition voltage. In all the following simulations, 0.5 LSB input-referred noise is added. With two 1 hit/code nonlinear ramp signals, the INL (end point fitting) estimation is shown in Fig.1 (a). The true INL of the ADC is plotted with the red line. In this ADC, the INL is about 1 LSB. The estimated INL from the USER-SMILE is plotted in the blue line. From the plot, we can see that the blue line matches the red line very well. The estimation error is defined to be the difference between the estimated full-code INL with the true INL. Fig.1 (b) shows the estimation error in USER-SMILE. The maximum estimation error is about +/0.15 LSB. It shows that the USER-SMILE method produces good estimation accuracy over all the codes.
0
1
2
3
4
5
6
Code
7 4
x 10
(a) INL Plot of USER-SMILE and True INL
The algorithm needs to know the exact value of the offset. Due to variation, the actual offset value may be different with the simulated value. In this case, the offset α can be simply estimated by the average difference between the output and . codes
IV. SIMULATIONS
0 -0.5
C. Constant Offset As showed in the previous derivation, a constant offset is required. Different methods have been proposed before for offset injections and good constancy can be achieved on chip.
0.2 0.15 INL Estimation Error (LSB)
Usually, we want to minimize the amount of offset due to the offset generator design. Larger offset will increase the design cost or complexity. To make the USER-SMILE algorithm work, the offset cannot be too small. If we have a very small offset (for example, a few LSB), the MSB segments in this set will hardly change after applying this offset. The of data are the same and they cancel each other so that there is no information from these data. Ideally we expect all segments to be changed after applying the offset and all data are fully used. If we use 6-5-5 segmentation (6 MSB bits, 5 ISB bit and 5 LSB bits), the ideal offset value is 1 MSB + 1 ISB + 1 LSB, which is 1057 LSB. Due to nonlinearity of ADC or the variation of the offset, for each set of data, the segments may not be all different. But the amount of such data is small and the effect on the estimation accuracy is neglectable. So, making the offset value to be slightly larger than 1 MSB is the best choice.
USER-SMILE True INL
1
INL(LSB)
The signal generator design is simplified with the above consideration. It can be a very nonlinear signal generator but needs to cover most of the ADC input range. A low cost, nonlinear, ramp generator or sine wave generator can be easily built on chip as the stimulus with minimal area overhead.
1.5
0.1 0.05 0 -0.05 -0.1 -0.15
0
1
2
3
4
5
6
Code
7 4
x 10
(b) INL Estimation Error of USER-SMILE Fig. 1. INL Estimation for one ADC
To further verify the algorithm with different ADCs, a large number of simulations have been done. The test uses two 1 hit/code nonlinear ramp signals to test different ADCs and 100 test results are randomly selected. For each INL curve, the maximum estimation error and the minimum estimation error are recorded over all codes and shown in Fig.2. From the figure, the average maximum estimation error in USERSMILE is around 0.2 LSB with few of them over 0.3 LSB. Fig.3 shows a different view of the estimation accuracy. The xaxis is the true INL and the y-axis is the estimated INL from the USER-SMILE. Ideally, if the estimated INL is the same as the true INL, this point will lie on the y=x line (the blue line). Due to the estimation error, these points will be away from this line. From the figure, the red points (estimated INL from the USER-SMILE) is very close to the y=x line, which means the USER-SMILE has very good accuracy. For ADCs with different performance (INL from 0.6LSB to 4.6LSB), the test accuracy stays the same. From the production test point of view, the USER-SMILE method will guarantee less yield loss. With two 1 hit/code ramp signals for a 16-bit ADC, the overall test data are only 131k points. The statistical study shows that the USER-SMILE algorithm is robust over different ADCs (including good and bad ADCs). And from all tests, the maximum estimation error for INL is within +/-0.4LSB.
! REFERENCES
0.4
max/min INLk Error (LSB)
!
[1]
0.3 0.2
[2]
0.1
[3]
0 -0.1
[4]
-0.2
[5]
-0.3 -0.4
0
20
40
60
80
100
[6]
# of ADC
[7]
Fig. 2. Maximum/Minimum INLk Error 5
[8]
Estimated INL (LSB)
4
[9] 3
2
[10]
1
0
[11] 0
1
2
3
4
5
True INL (LSB)
Fig. 3. INL Estimation in USER-SMILE over 100 ADCs
V. CONCLUSION A fast and cost-effective method for ADC linearity test is presented in this paper. The USER-SMILE algorithm allows the stimulus signal's linearity requirement to be significantly relaxed and the test time to be reduced by orders of magnitude compared to the state-of-art histogram method, thus greatly reducing the test cost. The simulation demonstrates that the USER-SMILE can achieve superior test coverage and accuracy. With the USER-SMILE algorithm, a new BIST solution can be practical, which doesn’t require highly accurate and expensive ATE as the signal generator. Furthermore, it simplifies the test board and interface design. ACKNOWLEDGMENT Materials presented in this paper are based upon the work supported in part by the Freescale Semiconductor and the Semiconductor Research Corporation. Any opinions, findings and conclusions or recommendations expressed in this paper are those of the authors and do not reflect opinions of the sponsors.
[12]
[13]
[14]
[15]
[16]
[17]
International Technology Roadmap for Semiconductors, 2011 edition, [Online]. Available: http://public.itrs.net T. Kuyel, “Linearity testing issues of analog to digital converters,” in Proc. 1999 Int. Test Conf., 1999, pp. 747–756. J. Blair, “Histogram measurement of ADC nonlinearities using sine waves,” IEEE Trans. Instrum. Meas., vol. 43, pp. 373–383, Jun. 1994. M. Burns and G. W. Roberts, An Introduction to Mixed-Signal IC Test and Measurement. New York: Oxford Univ. Press, 2000. J. Doernberg, H.-S. Lee, and D. A. Hodges, “Full-speed testing of A/D converters,” IEEE J. Solid-State Circuits, vol. SC-19, pp. 820–827, Dec. 1984. IEEE Standard for Terminology and Test Methods for Analog-to-Digital Converters, IEEE Std. 1241-2010, Jan. 2011. J.L. Huang, C.X. Ong, K.T. Cheng, "A BIST scheme for on-chip ADC and DAC testing", Proc. of the Design, Automation and Test in Europe Conference and Exhibition, 2000, pp 216-220. L. Jin, et al, “Code-Density Test of Analog-to-Digital Converters Using Single Low-Linearity Stimulus Signal,” IEEE Transactions on Instrumentation and Measurement, Vol. 58, No. 8, pp. 2679-2685, August 2009. L. Jin, K. Parthasarathy, T. Kuyel, D. Chen and R. L. Geiger, “Accurte Testing of Analog-to-Digital Converters Using Low Linearity Signals With Stimulus Error Identification and Removal,” IEEE Trans. Instrum Meas., vol. 54, pp. 1188 – 1199, June 2005. L. Jin, et al, “SEIR Linearity Testing of Precision A/D Converters in Nonstationary Environments With Center Symmetric Interleaving,” IEEE Transactions On Instrumentation And Measurement, Vol. 56, No. 5,pp. 1776-1785, October 2007. F. Adamo, et al, “FFT Test of A/D Converters to Determine the Integral Nonlinearity,” IEEE Trans. On Instrumentation and Measurement, Vol. 51, No. 5, pp. 1050-1054, October 2002. F. Attivissimo, et al, “INL reconstruction of A/D converters via parametric spectral estimation,” IEEE Trans. Instrum. Meas., vol. 53, no. 4, pp. 940–946, Aug. 2004. A. Cruz Serra , M. Fonseca da Silva , P. Ramos , R. Carneiro Martins , L. Michaeli and J. Saliga "Combined spectral and histogram analysis for fast ADC testing", IEEE Trans. Instrum. Meas., vol. 54, no. 4, pp.1617 -1623 2005 Z. Yu, D. Chen, R. Geiger, and Y. Papantonopoulos. "Pipeline ADC linearity testing with dramatically reduced data capture time," Proc. IEEE Int. Symposium on Circuits and Systems, pp. 792-795, 2005. S. Kook, et al, “Low-Resolution DAC-Driven Linearity Testing of Higher Resolution ADCs Using Polynomial Fitting Measurements,” to appear in IEEE Transactions On Very Large Scale Integration (VLSI) Systems, 2012. S. Goyal, et al, “Test Time Reduction of Successive Approximation Register A/D Converter By Selective Code Measurement,” International Test Conference, Nov, 2005. Z. Yu and D. Chen, “Algorithm for Dramatically Improved Efficiency in ADC Linearity Test,” IEEE International Test Conference (ITC), pages 1-10, 2012.