within social networks, an ever growing amount of users' spatio- ... network. Most works relied mainly on the spatial dimension of user data [1], with some works more recently .... made in a place and similarly aggregate all tips from places.
GEOProcessing 2016 : The Eighth International Conference on Advanced Geographic Information Systems, Applications, and Servic es
Uncovering User Profiles in Location-Based Social Networks
Soha Mohamed∗† , Alia Abdelmoty∗ ∗ School
of Computer Science & Informatics, Cardiff University, Wales, UK Email: {AlySA, AbdelmotyAI}@cardiff.ac.uk † Faculty of Computers and Information, Helwan University, Cairo, Egypt
Abstract—With the current trend of embedding location services within social networks, an ever growing amount of users’ spatiotemporal tracks are being collected that can be used to generate user profiles to reflect users’ interests in places. User-contributed annotations of place, as well as other place properties, add a layer of important semantics that if considered, can result in more refined representations of user profiles. In this paper, semantic information is summarised as tags for places and a folksonomy data model is used to represent spatial and semantic relationships between users, places and tags. The model allows simple cooccurrence methods and similarity measures to be applied to build different views of personalized user profiles. Basic profiles capture direct user interactions, while enriched profiles offer an extended view of user’s association with places and tags that takes into account relationships in the folksonomy. The main contribution of this work is the demonstration of how the different data dimensions captured on location-based social networks can be combined to represent useful views of user profiles. Keywords–GeoFolksonomy;User Profiles;Location-based Social Networks;.
I. I NTRODUCTION This work focusses on Location-Based Social Networks (LBSN) that collect information on users’ interests in physical places in the real world. By “switching on” location on devices, we are giving away information on our whereabouts, our daily routines, activities, experiences, and interests. Thus, in comparison to other personal information, location data are possibly the most crucial type of data of relevance to privacy, as it pulls together our virtual and physical existences and thus raises critical questions about privacy in both worlds. This work introduces methods for constructing user profiles that consider the different dimensions of the data captured from users on LBSN. These profiles, when made transparent to users of the network, should empower their sense of awareness and control of their data. So far, previous works have studied data produced from LBSN from the point of view of enhancing the services provided by these networks, namely, for point of interest (POI) recommendations. There, the question of concern is to find places of interest to a user based on their history of visits to other places and their general interaction with the social network. Most works relied mainly on the spatial dimension of user data [1], with some works more recently exploring the relevance of the social and content data dimensions on these networks [2]. However, data dimensions are normally treated separately, or their outputs are combined in fused models. In this paper, both semantic and spatial interactions of users are used to project distinct and complementary views of personalised user profiles. Thus, user’s annotations on places they visit are compiled in semantic profiles, while collective user annotations on places are used to create specific profiles
Copyright (c) IARIA, 2016. ISBN: 978-1-61208-469-5
for places that encapsulate user’s experiences in the place. Place profiles, in turn, are used to construct personalised user profiles. In comparison to previous works in the area of recommendations, LBSN data are treated as folksonomies of users, places and tags. User annotations in the form of tips, their interaction with places, in the form of check-ins, as well as general place properties, namely, place categories and tags, are analysed concurrently to extract relations between the three elements of the folksonomy. Simple co-occurrence methods and similarity measures are used to compute direct and enriched user profiles. Thus, the proposed approach provides users with the ability to project different views of their profiles, using their direct interactions with the social network or extended with a holistic view of other users’ interaction with the network in different regions of geographic space. Previous works attempting a similar approach used matrix factorization techniques to handle the multiple data dimensions, but did not consider the use of the range of content data as used in this paper. Sample realistic data from Foursquare are used to demonstrate the approach and evaluation results show its potential value. In particular, it is shown that enriched user profiles offer potentially more accurate views, than direct profiles, of user’s spatial as well as semantic preferences. Hence, these should be considered when designing tools for enabling user awareness on these networks. The rest of the paper is organised as follows. Section II provides an overview of related works. In Section III, a geofolksonomy data model for LBSN is introduced and in Section IV different types of user profiles are defined. In Section V, the experiment used to evaluate the approach is described and its results are presented and discussed. The paper concludes in Section VI with an overview of future work. II. R ELATED W ORK Works on modelling user data in LBSN mainly consider two problems; a) place (or point of interest) recommendation, and b) user similarity calculation. Different types of data are used by different approaches, namely, geographic content, social content as well as textual annotations made by users. Also, different methods are used in analysing the data, for example, distance estimations for geographic data modelling and topic modelling for annotation data analysis. In the area of POI recommendation, works range from generic approaches that uses the popularity of places [3] to recommendation methods that are based on user’s individual preferences [4]. A useful survey of these approaches can be found in [5]. Based on check-in data gathered through Foursquare, Noulas and Mascolo [6] exploit factors such as the transition between types of places, mobility between venues and spatialtemporal characteristics of user check-in patterns to build a
14
GEOProcessing 2016 : The Eighth International Conference on Advanced Geographic Information Systems, Applications, and Servic es
supervised model for predicting a user’s next check-in. Ye,Lui and Lee [4] investigated the geographical influence with a power-law distribution. The hypothesis is that users tend to visit places within short distances of one another. Other works considered other distance distribution models [7]. Gao, Tang and Liu [8] considered a joint model of geo-social correlations for personalized POI recommendation, where the probability of a user checking in to a new POI is described as a function of correlations between user’s friends and non-friends close to, and distant from a region of interest. Liu, Xiong and Papadimitriou [9] approached the problem of POI recommendations by proposing a geographical probabilistic factor model that combines the modeling of geographical preference and user mobility. Geographical influence is captured through the identification of latent regions of activity for all users of the LBSN reflecting activity areas for the entire population and mapping the individual user mobility over those regions. Their model is enhanced by assuming a Poisson distribution for the check-in count which better represents the skewed data (users visiting some places one time, while other places 100s of times). Whilst providing some useful insights for modelling the spatial dimension of the data, the above works do not consider the semantic dimension of the data. Correlations between geographical distance and social connections were noted in [10] [2]. Techniques of personalized POI recommendation with geographical influence and social connections mainly study these two elements separately, and then combine their output together within a fused model. Social influence is usually modeled through friend-based collaborative filtering [11] [4] [12] with the assumption that a user tends to be friends with other users who are geographically close to him, or would want to visit similar places to those visited by his friends. Ying, Lu, Kuo, and Tseng [13] proposed to combine the social factor with individual preferences and location popularity within a regression-tree model to recommend POIs. The social factor corresponds to similar users; users with common check-ins to the user in question. In this paper, we also use this factor when extending user profiles to represent places of interest within the region of user activity. More recently, the importance of content information for POI recommendation was recognised. Two types of content can be considered, attributes of places and user-contributed annotations. Place categories are normally used as an indication of user activity, thus a user visiting a French restaurant would be considered as interested in French food, etc. User annotations in the form of tips and comments are analysed collectively to extract general topics to characterise places or to extract collective sentiment indications about the place. Examples of works that considered place categories are [14] [15] [16] [17]. In [14] [15], Latent Dirichlet Allocation (LDA) model was used to represent places as a probability distribution over topics collected from tags and categories or comments made in a place and similarly aggregate all tips from places a user has visited to model a user’s interest. Aggregation was necessary as terms associated with a single POI are usually short, incomplete and ambiguous. [16] on the other hand modelled topics from tweets and reviews from Twitter and Yelp, and assumed that the relations between user interests and location are derived from the topic distributions for both users and locations. In [17], a probabilistic approach is proposed that utilize geographical, social and categorical correlations among users and places to recommend new POIs from historical
Copyright (c) IARIA, 2016. ISBN: 978-1-61208-469-5
check-in data of all users. In this paper, we also model user’s association to place through the place’s relation to tags, but add the influence of other users relations in the place to the equation. Aiming at improving the effectiveness of location recommendation, Yang, Zhang, Yu and Wang [18] proposed a hybrid user POI preference model by combining the preference extracted from check-ins and text-based tips which were processed using sentiment analysis techniques. Sentiment analysis is an interesting type of semantics which we do not consider this work, but can be incorporated in future work. Studying user similarity from LBSN data is useful, as information available about users, their locations and activities are considered to be sparse. User similarities can be exploited to predict types of activities and places preferred by a user based on those of users with similar preferences. So far, most works on user similarity mainly focused on structured, e.g., geographic coordinates, or semi-structured, e.g., tags and place categories, data. Recently, Lee and Chung [19] presented a method for determining user similarity based on LBSN data. While the authors made use of check-in information, they concentrated on the hierarchy of location categories supplied by Foursquare in conjunction with the frequency of check-ins to determine a measure of similarity. Mckenzie, Adams, and Janowicz [15] suggest exploring unstructured user-contributed data, namely tips provided by users. A topic modeling approach is used to represent users’ interests in places. Venues (places in Foursquare) are described as a mixture of a given number of topics and topic signatures are computed as a distribution across venues. User similarity can then be measured by computing a dissimilarity metric between users’ topic distribution. Their method of modelling venues is interesting, but it limits the representation of user profiles, where profiles are based on generated topics derived from collective user annotation on places. Thus, individualised association of users with the place is somewhat ignored. In contrast to the above approach, our model does not assume constraints on the number of topics represented by the tags, but combines the individual’s association with both tags and place in the creation of user profiles. III. G EO -F OLKSONOMY M ODEL The location-based social networking platform, Foursquare, was used as our source of data. It holds a large number of crowdsourced venues ( > 65 million places) from a user population estimated recently to around 55 million users. As the application defines it, a venue is a user-contributed “physical location, such as a place of business or personal residence.”. Foursquare allows users to check in to a specific venue, sharing their location with friends, as well as other online social networks, such as Facebook or Twitter. Built with a gamification strategy, users are rewarded for checking in to locations with badges, in-game points, and discounts from advertisers. This game-play encourages users to revisit the application, compete against their friends and contribute checkins, photos and tips. Tips consist of user input on a specific venue, normally describing a recommendation, experience or activity performed in the place. In this work, we use a folksonomy data model to represent user-place relationships and derive tag assignments from users’ actions of check-ins and annotation of venues. In particular, tags are assigned to venues in our data model in two scenarios as follows.
15
GEOProcessing 2016 : The Eighth International Conference on Advanced Geographic Information Systems, Applications, and Servic es
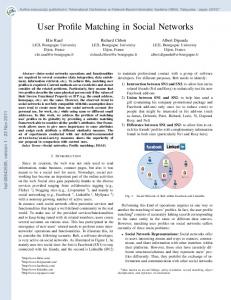
1) A user’s check-in results in the assignment of place categories associated with the place as tags annotated by this user. Thus, a check-in by user u in place r with the categories (represented as keywords) x, y and z, will be considered as an assertion of the form (u, r, (x, y, z)). This in turn will be transformed to a set of triples {(u, r, x), (u, r, y), (u, r, z)} in the folksonomy. 2) A user’s tip in the place also results in the assignment of place categories as tags, in addition to the set of keywords extracted from the tip. Thus, in the above example, a tip by u in r with the keywords (t1 , · · · , tn ), will be considered as an assertion of the form (u, r, (x, y, z, t1 , · · · , tn )), and is in turn transformed to individual triples between the user, place and tags in the folksonomy. The process of extracting keywords from tips is done by tokenizing the tip into a set of words (terms) on white space and punctuation. Then we remove all words with non-latin characters and stop words. The output is a set of single words (term vector). Furthermore, we use Wordnet syntactic category and logical groupings for classifying the extracted terms. For example, Wordnet ’noun.act’ category is used to filter action verbs and nouns to describe a user- or place- associated activity (ex. swimming, buying or eating). The data capturing process results in the creation of a geo-folksonomy, which can be defined as a quadruple F := (U, T, R, Y ), where U, T, R are finite sets of instances of users, tags and places respectively, and Y defines a relation, the tag assignment, between these sets, that is, Y ⊆ U × T × R , [20] [21]. A geo-folksonomy can be transformed into a tripartite undirected graph, which is denoted as folksonomy graph GF . A geo-Folksonomy Graph GF = (VF , EF ) is an undirected weighted tripartite graph that models a given folksonomy F, where: VF = U ∪ T ∪ R is the set of nodes, EF = {{u, t}, {t, r}, {u, r}|(u, t, r) ∈ Y }} is the set of edges, and a weight w is associated with each edge e ∈ EF . The weight associated with an edge {u, t}, {t, r} and {u, r} corresponds to the co-occurrence frequency of the corresponding nodes within the set of tag assignments Y . For example, w(t, r) = |{u ∈ U : (u, t, r) ∈ Y }| corresponds to the number of users that assigned tag t to place r. Figure 1 depicts the overall process of user profile creation. The process starts with data collection of check-ins and tip data from Foursquare, that are then processed to extract users, places and tags and their associated properties. The modelling stage includes the definition of relationships between the three entities and the application of folksonomy co-occurence methods to extract the different types of profiles. Place and tag similarity calculations are used to further extend the basic profiles to build different views of enriched user profiles. IV. U SER M ODELING S TRATEGIES We propose an approach to modelling users in LBSN that represents a user’s spatial, semantic and combined spatiosemantic association with place. A spatial user profile represents the user’s interest in places, while a tag-based profile describes his association with concepts associated with places in the folksonomy model. A spatio-semantic profile describes the user specific interest in certain concepts associated with places in his profile. A user profile is built in stages. Starting with a basic profile that utilises direct check-in and annotation
Copyright (c) IARIA, 2016. ISBN: 978-1-61208-469-5
Figure 1. The framework of our system
histories, a user profile is then extended by computing the relationship between places and concepts derived from the collective behaviour of other users in the dataset. A basic profile represents actual interactions with places, while the extended profile describes “recommended” associations given overall interactions between users, places and concepts in the dataset. We are able to model such interactions separately in the extended profile by controlling the similarity function used to create the profile. For example, we can focus on modelling the types of places visited by the user or take into account visit behaviour of other users whose profiles overlap with the user, as discussed below. A. Basic User Profiles Definition 1: Spatial User Profile A spatial user profile PR (u) of a user u is deduced from the set of places that u visited or annotated directly. PR (u) ={(r, w(u, r))|(u, t, r) ∈ Y, w(u, r) = |{t ∈ T : (u, t, r) ∈ Y }|}
(1)
w(u, r) is the number of tag assignments, where user u assigned some tag t to place r through the action of checkingin or annotation. Hence, the weight assigned to a place simply corresponds to the frequency of the user reference to the place either by checking in or by leaving a tip. We further normalise the weights so that the sum of the weights assigned to the places in the spatial profile is equal to 1. We use PR to explicitly refer to the spatial profile where the sum of all weights is equal to 1, with |{t∈T :(u,t,r)∈Y }| w(u, r) = P , where n and m are the n P m |{ti ∈T :(u,ti ,rj )∈Y }|
i=1 j=1
total number of tags and resources, respectively. More simply, (u,r) w(u, r) = N NT (u) , where N (u, r) is the number of tags used by u for resource r, while NT (u) is the total number of tags used by u for all places.
16
GEOProcessing 2016 : The Eighth International Conference on Advanced Geographic Information Systems, Applications, and Servic es
Correspondingly, we define the tag-based profile of a user; PT (u) as follows. Definition 2: Semantic User Profile A semantic user profile PT (u) of a user u is deduced from the set of tag assignments linked with u. PT (u) ={(t, w(u, t))|(u, t, r) ∈ Y, w(u, t) = |{r ∈ R : (u, t, r) ∈ Y }|}
(2)
w(u, t) is the number of tag assignments where user u assigned tag t to some place through the action of checking-in or annotation. PT refers to the semantic profile where the sum of all (u,t) weights is equal to 1, with w(u, t) = N NR (u) , where N (u, t) is the number of resources annotated by u with t and NR (u) is the total number of resources annotated by u. Furthermore, we define a spatio-semantic profile of a user PRT (u), that is a personalised association between user, place and tag. Definition 3: Spatio-Semantic User Profile Let Fu = (Tu , Ru , Iu ) of a given user u ∈ U be the restriction of F to u, such that, Tu and Ru are finite sets of tags and places respectively, that are referenced from tag assignments performed by u, and Iu defines a relation between these sets: Iu := {(t, r) ∈ Tu × Ru |(u, t, r) ∈ Y }. A spatio-semantic user profile PRT (u) of a user u is deduced from the set of tag assignments made for place r by u. PRT (u) ={([r, t], wu ([r, t]))|(t, r) ∈ Iu , wu ([r, t]) = |{t ∈ Tu : (t, r) ∈ Iu }|}
B. Place and Tag Profiles So far, the basic user profile provides only a limited view of the user association with places and concepts derived directly from captured data. Basic profiles reduce the dimensionality of the folksonomy space by considering only 2 dimensions at a time; user-place and user-tag, leading to a loss of correlation information between all three elements. Users profiles can be extended to represent possible latent relationships in the data. Thus a user profile can be used to present places (respectively tags) similar to those in the basic profile, where similarity between places (respectively tags) is measured through the collective actions of other users of check-ins and annotations. To compute tag-tag similarity, profiles for tags are first defined through the places they are used to annotate. Thus, a place-based tag profile (PR (t)) of a tag t is a weighted list of places r that are annotated by t. That is, w(r, t) is determined by the number of users’ check-ins and tips that resulted in assigning t to r in the geo-folksonomy. Similarity between tags is defined as the cosine similarity between their place-based tag profiles as follows.
Copyright (c) IARIA, 2016. ISBN: 978-1-61208-469-5
procedure S PATIAL E NRICHMENT(PR (u),γ) for all place ri in Spatial-Profile PR (u) do Compute P laceSim(r1 , r2 ) from Equation 5. Find top-10 similar places rj to each ri in PR (u) for each < rj , sim > in top similar places do wj = wi ∗ sim add < rj , wj > to PR (u) end for end for return P´R (u) end procedure
Figure 2. Algorithm for building the enriched user profile with γ = 1.
On the other hand, similarity between places is defined by measuring the similarity of their tag-based and user-based profiles. Let PT (r) and PU (r) be the tag-based place profile and user-based place profile for place r (defined in a similar manner to user profiles above). Conceptually, a tag-based place profile is a description of the place by the tags assigned to it and a user-based place profile is an account of users’ visits to the place. Cosine similarity between tag-based place profiles (CosSimtag (r1 , r2 )) and between user-based place profiles (CosSimuser (r1 , r2 )) construct a tag-oriented ranking and user-oriented ranking, respectively. These similarity rankings can be aggregated using the so-called Borda method [22] to compute a generalised similarity score between two places as shown in Equation 5
(3)
where w([r, t]) is how often user u assigned tag t to place r. PRT is the spatio-semantic profile where the sum of all weights is equal to 1, with wu ([r, t]) = NN(u,[r,t]) , where RT (u) N (u, [r, t]) is the number of times u annotate r with t, and NRT (u) is the total number of tags assigned by u for r. (Note that tag assignment by users for a place comes from both the explicit action of annotation as well as implicit action of checking-in as represented in the geo-folksonomy model).
|PR (t1 ) ∩ PR (t2 )| CosSim(t1 , t2 ) = p |PR (t1 )|.|PR (t2 )|
1: 2: 3: 4: 5: 6: 7: 8: 9: 10: 11:
(4)
P laceSim(r1 , r2 ) = γ∗CosSimtag (r1 , r2 )+(1−γ)∗CosSimuser (r1 , r2 ) (5)
where 0 ≤ γ ≤ 1 is a parameter that determines the balance of importance given to similarity scores from PT (r) and PU (r). Conceptually, similarity between two places is a function of the overlap between their tag assignments only (for γ = 0), a measure of their common visitors only (for γ = 1), or both (for γ between 0 and 1). C. Enriched User Profiles We extend the basic user profiles by the information extracted from the computation of tag and place similarity above. The enriched user profiles will therefore present a modified view of how users are associated with places that reflect collective user behaviour on the LBSN. Definition 4: Enriched Spatial User Profile An enriched spatial user profile P´R (u) of a user u is an extension of the basic profile by places with the highest degree of similarity to places in PR (u). Let Ru be the set of all places in PR (u) and wi is the weight associated with place i in the profile. ´ (u) = {< r , w > | P i i R � wi wi = wi ∗ M ax(P laceSim(ri , rj ))
, if ri ∈ Ru , ∀(ri ∈ {R − Ru } ∧ rj ∈ Ru )
� (6)
We compute the maximum similarity of the 10 most similar places in the dataset for every place in the basic user profile, and use the highest similarity score as the weight for the new place in the enriched user profile. The process of building the enriched spatial profile from place similarity with γ as an input is shown in Figure 2. Definition 5: Enriched Tag-based User Profile An enriched tag-based user profile P´T (u) of a user u is an extension
17
GEOProcessing 2016 : The Eighth International Conference on Advanced Geographic Information Systems, Applications, and Servic es
of the basic profile by tags with the highest degree of similarity to tags in PT (u). Let Tu be the set of all tags in PT (u) and wi is the weight associated with tag i in the profile. P´T (u) = {< ti , wi > | � wi wi = wi ∗ M ax(Sim(ti , tj ))
, if ti ∈ Tu ,∀(ti ∈ {T − Tu } ∧ Tj ∈ Tu ) (7)
A similar algorithm to that of enriching place profiles is used for choosing the tags and weights. Definition 6: Enriched Spatio-Semantic User Profile An enriched spatio-semantic user profile P´RT (u) of a user u is an extension of the basic profile by tags and places with the highest degree of similarity to tags in PRT (u). Let Tu be the set of all tags in PT (u), Ru be the set of all places in PR (u) and wij is the weight associated with tag i and place j in the profile. ´ P RT (u) =< [ri , tj ], wu (ri , tj ) > |wu (ri , tj ) = , if ri ∈ Ru andtj ∈ Tu wu (ri , tj ) wu (ri , tj ) ∗ M ax(P laceSim(ri , rk )) , tj ∈ PT (rk ) ∧ rk ∈ {R − Ru } 0 otherwise
�
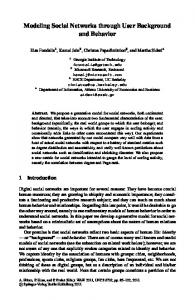
Figure 4. Sample of tags representing activities in a semantic user profile.
(8)
The spatio-semantic profile is extended with the most similar places to the user profile and these are assigned a weight computed using the place similarity value for all tags in their place-tag profiles and 0 for tags that are not in their profile. Thus the user simply inherits relationships with all the tags and their associated weights from basic places that are deemed similar to those in his profile. 1) User Profile Example: Here an example is given of a sample user profile created from the dataset used in this work. ’user349’ checked in 600 different venues, with associated 400 venue categories. Note that one venue can have more than one venue category. Figure 3 shows the top 20 tags in his semantic user profile. Figure 4 shows filtered tags from his profile representing human activity (approximately 5% of all tags), as derived by mapping to Wordnet noun.act category.
Figure 5. Spatial user profile for user ’user349’.
latitude of venues and time stamps of check-ins. The data was then used to recursively extract venue-related tips (tip id, text and time stamp), and subsequently all venues for users related to the tips collected. 604,924 tips were collected for 167,786 users in 36,940 venues. Time stamps of the tip data range from January 2009 to June 2015. Experiments were carried out using a sample of 20 users with a high frequency of check-ins and co-location rate (10 users with an average of 601 check-ins) and tips (10 users
Figure 3. Example tag-based user profile.
Figures 5 and 6 show the spatial profile and the enriched spatial profiles for user ’user349’, respectively. γ = 0.5 was used in the place similarity equation of the enriched profile. The size of the dots in the figures represents the weight of the place in the profile. V. E XPERIMENTS AND R ESULTS A. Datasets Approximately (10 months) of check-in data in New York city were collected from Foursquare between April 2012 and February 2013 [23]. This data consists of 227,428 anonymized user check-ins, with venue ids, venue category, longitude and Figure 6. Enriched spatial user profile for user ’user349’ with γ = 0.5.
Copyright (c) IARIA, 2016. ISBN: 978-1-61208-469-5
18
GEOProcessing 2016 : The Eighth International Conference on Advanced Geographic Information Systems, Applications, and Servic es
1: 2: 3: 4: 5: 6: 7: 8: 9: 10: 11: 12: 13: 14: 15:
procedure S PATIO - SEMANTIC T OP -K R ECOM MENDER (γ,TopK) for each ui do SpatialEnrichment(PR (ui ), γ) end for for all ui , uj do Fetch profiles PR (ui ), PR (uj ) Compute CosSim(ui , uj ) . end for for each Ui do Fetch most similar user uj Sort < ri , wi > of PR (uj ) Recommend TopK ri that are not in PR (ui ) end for return TopK < ri , wi > end procedure Figure 7. Spatio-semantic Top-K recommendation algorithm
with and average of 95 tips). Table I shows summary statistics of the sample dataset used. TABLE I. EXPERIMENT DATASET Number of Venues Total number of Checkins Total Number of Tips Total Number of Tags Number of users Total Number categories Total Number of Relationships Average Checkins/user Average tag/user
2,041 4,212 942 3,357 20 317 17,955 601 363
B. Experiment Setup The evaluation experiment aims to measure the impact of using the full range of content captured on LBSN when building user profiles in comparison to using only partial views based on check-in information. The experiment takes the form of place (and tag) top-N recommendation problem using the different constructed user profiles based on the users profiles cosine similarities and seeks to establish how well the profiles reflect the user spatial and semantic characteristics when using the LBSN. The algorithm used for computing the top-N recommendations using spatial profiles is shown in figure 7. We use recall@N, precision@N and F1@N as our success measures, where N is the predefined number of places (or tags) to be recommended. Recall measures the ratio of correct recommendations to the number of true places (or tags) of a test check-in or tip record, whereas precision measures the ratio of correct to false recommendations made. Recall and precision are given by recall
=
precision =
TP TP + FN TP TP + FP
where true positives (TP) is the number of correct place (or tags) recommended, false positive (FP) is the number of wrong recommendations and false negatives (FN) is the number of true place (or tags) which were not recommended. F1 is a
Copyright (c) IARIA, 2016. ISBN: 978-1-61208-469-5
combination of recall and precision and is given by F1 =
2 ∗ precision ∗ recall precision + recall
The values of TP, FP, FN are determined by randomly splitting the users into two sets; the training set and the testing set. Multi-fold cross-validation was used to ensure a fair partitioning between test data and training data. Data were split 90% for training and 10 % for testing, and the process was repeated 5 times to create 5 folds and the mean of the performance was reported. C. Evaluation of Spatial Profiles Results for the enriched user profiles using the proposed top-N recommendation method are presented. Different versions of the enriched spatial profiles, using different place similarity measures were created, a) using γ = 0 (to represent place-tag similarity only), b) using γ = 1, (to represent placeuser similarity only), and c) using γ = 0.5 for an aggregated view of both effects. Hence, result sets are shown for the following user profiles. 1. Enriched-Spatial(Tag) 2. EnrichedSpatial(User) 3. Enriched-Spatial(All). We compare the results of the top-N recommendation using the three different profiles with traditional Item-based Collaborative Filtering (IBCF) [24] and User-based collaborative Filtering (UCBF) [25] approaches, applied against the basic spatial user profile for recommending top-1, 2, 3, 4, 5, 10, 20, 30, 40, 50. Figures 8 and 9 and 10 show the precision, recall and F1-measure for all all approaches. As is shown in the figures, enriched user profiles demonstrate significantly better performance in comparison to the traditional approaches. In particular, the F1 measure for the combined profile (Spatial + All) outperforms the UBCF approach by 10% on average and the IBCF approach by 12% on average.
Figure 8. Precision values for the top-N place recommendations.
D. Evaluation of Semantic profiles A similar experiment was carried out to evaluate the semantic user profiles. Again, the results were compared to the UBCF and IBCF approaches. Figures 11, 12 and 13 show the results of the top-10, 20, 30, 40, and 50 tag recommendations using the different methods. As shown in Figure 11, the enriched semantic profile demonstrates significant improvements with respect to both the UBCF and IBCF approaches. Results demonstrates the quality of the enriched semantic user profiles, and thus confirm their utility for more accurate representations of user profiles. .
19
GEOProcessing 2016 : The Eighth International Conference on Advanced Geographic Information Systems, Applications, and Servic es
Figure 13. F1 measure values for the top-N tag recommendations. Figure 9. Recall values for the top-N place recommendations
Figure 10. F1 measure values for the top-N place recommendations
VI. C ONCLUSIONS This paper considers the problem of user profiling on location-based social networks. Both the spatial (where) and the semantic (what) dimensions of user and place data are used to construct different views of a user’s profile. A place is considered to be associated with a set of tags or labels that describe its associated place types, as well as summarise the users’ annotations in the place. A folksonomy data model and analysis methods are used to represent and manipulate the data to construct user profiles and place profiles. It is shown how user profiles can be extended from a basic model that describes user’s direct links with a place, to an enriched profiles describing richers views of place data on the social network. The model is flexible and can be adjusted to focus on the spatial and semantic dimensions separately or in combination. Results demonstrate that the proposed methods produce user profiles that are more representative of user’s spatial and semantic preferences. To our knowledge, no other works have proposed similar treatments of the problem before. Future work will consider a larger number of users as well as the effect of user check-in behaviour on the results. The temporal dimension of the data adds another layer of complexity and is also the subject of future work. VII. ACKNOWLEDGMENT Soha is fully supported by a grant from the Egyptian Cultural Affairs and Missions Sector, and their support is duly acknowledged. R EFERENCES
Figure 11. Precision values for the top-N tag recommendations.
[1]
[2] [3]
[4]
[5]
[6] Figure 12. Recall values for the top-N tag recommendations.
Copyright (c) IARIA, 2016. ISBN: 978-1-61208-469-5
Q. Li, Y. Zheng, X. Xie, Y. Chen, W. Liu, and W.-Y. Ma, “Mining user similarity based on location history,” in Proceedings of the 16th ACM SIGSPATIAL international conference on Advances in geographic information systems. ACM, 2008, pp. 34–42. H. Gao, J. Tang, and H. Liu, “Exploring social-historical ties on location-based social networks.” in ICWSM, 2012, pp. 114–121. X. Cao, G. Cong, and C. S. Jensen, “Mining significant semantic locations from gps data,” Proceedings of the VLDB Endowment, vol. 3, no. 1-2, 2010, pp. 1009–1020. M. Ye, X. Liu, and W.-C. Lee, “Exploring social influence for recommendation-a probabilistic generative model approach,” arXiv preprint arXiv:1109.0758, 2011. J. Bao, Y. Zheng, D. Wilkie, and M. Mokbel, “Recommendations in location-based social networks: a survey,” GeoInformatica, vol. 19, no. 3, 2015, pp. 525–565. A. Noulas and C. Mascolo, “Exploiting foursquare and cellular data to infer user activity in urban environments,” in 14th International Conference on Mobile Data Management, vol. 1. IEEE, 2013, pp. 167–176.
20
GEOProcessing 2016 : The Eighth International Conference on Advanced Geographic Information Systems, Applications, and Servic es
[7]
J.-D. Zhang and C.-Y. Chow, “igslr: personalized geo-social location recommendation: a kernel density estimation approach,” in Proceedings of the 21st ACM SIGSPATIAL International Conference on Advances in Geographic Information Systems. ACM, 2013, pp. 334–343.
[8]
H. Gao, J. Tang, and H. Liu, “gscorr: modeling geo-social correlations for new check-ins on location-based social networks,” in Proceedings of the 21st ACM international conference on Information and knowledge management. ACM, 2012, pp. 1582–1586.
[9]
B. Liu, H. Xiong, S. Papadimitriou, Y. Fu, and Z. Yao, “A general geographical probabilistic factor model for point of interest recommendation,” Knowledge and Data Engineering, IEEE Transactions on, vol. 27, no. 5, 2015, pp. 1167–1179.
[10]
E. Cho, S. A. Myers, and J. Leskovec, “Friendship and mobility: user movement in location-based social networks,” in Proceedings of the 17th ACM SIGKDD international conference on Knowledge discovery and data mining. ACM, 2011, pp. 1082–1090.
[11]
D. Zhou, B. Wang, S. M. Rahimi, and X. Wang, “A study of recommending locations on location-based social network by collaborative filtering,” in Advances in Artificial Intelligence. Springer, 2012, pp. 255–266.
[12]
H. Wang, M. Terrovitis, and N. Mamoulis, “Location recommendation in location-based social networks using user check-in data,” in Proceedings of the 21st ACM SIGSPATIAL International Conference on Advances in Geographic Information Systems. ACM, 2013, pp. 374– 383.
[13]
J. J.-C. Ying, E. H.-C. Lu, W.-N. Kuo, and V. S. Tseng, “Urban point-of-interest recommendation by mining user check-in behaviors,” in Proceedings of the ACM SIGKDD International Workshop on Urban Computing. ACM, 2012, pp. 63–70.
[14]
B. Liu, Y. Fu, Z. Yao, and H. Xiong, “Learning geographical preferences for point-of-interest recommendation,” in Proceedings of the 19th ACM SIGKDD international conference on Knowledge discovery and data mining. ACM, 2013, pp. 1043–1051.
[15]
G. McKenzie, B. Adams, and K. Janowicz, “A thematic approach to user similarity built on geosocial check-ins,” in Geographic Information Science at the Heart of Europe. Springer, 2013, pp. 39–53.
[16]
B. Hu and M. Ester, “Spatial topic modeling in online social media for location recommendation,” in Proceedings of the 7th ACM conference on Recommender systems. ACM, 2013, pp. 25–32.
[17]
J.-D. Zhang and C.-Y. Chow, “Geosoca: Exploiting geographical, social and categorical correlations for point-of-interest recommendations,” in Proceedings of the 38th International ACM SIGIR Conference on Research and Development in Information Retrieval. ACM, 2015, pp. 443–452.
[18]
D. Yang, D. Zhang, Z. Yu, and Z. Wang, “A sentiment-enhanced personalized location recommendation system,” in Proceedings of the 24th ACM Conference on Hypertext and Social Media. ACM, 2013, pp. 119–128.
[19]
M.-J. Lee and C.-W. Chung, “A user similarity calculation based on the location for social network services,” in Database Systems for Advanced Applications. Springer, 2011, pp. 38–52.
[20]
F. Abel, “Contextualization, User Modeling and Personalization in the Social Web,” PhD Thesis, Gottfried Wilhelm Leibniz University Hannover, April 2011.
[21]
A. Hotho, R. J¨aschke, C. Schmitz, and G. Stumme, “Information retrieval in folksonomies: Search and ranking,” in Semantic web: research and applications, proceedings. Springer, 2006, pp. 411–426.
[22]
C. Dwork, R. Kumar, M. Naor, and D. Sivakumar, “Rank aggregation methods for the web,” in Proceedings of the 10th international conference on World Wide Web. ACM, 2001, pp. 613–622.
[23]
D. Yang, D. Zhang, V. W. Zheng, and Z. Yu, “Modeling user activity preference by leveraging user spatial temporal characteristics in lbsns,” Systems, Man, and Cybernetics: Systems, IEEE Transactions on, vol. 45, no. 1, 2015, pp. 129–142.
[24]
B. Sarwar, G. Karypis, J. Konstan, and J. Riedl, “Item-based collaborative filtering recommendation algorithms,” in Proceedings of the 10th international conference on World Wide Web. ACM, 2001, pp. 285– 295.
[25]
M. J. Pazzani, “A framework for collaborative, content-based and
Copyright (c) IARIA, 2016. ISBN: 978-1-61208-469-5
demographic filtering,” Artificial Intelligence Review, vol. 13, no. 56, 1999, pp. 393–408.
21