Journal of Animal Ecology 2009, 78, 573–584
doi: 10.1111/j.1365-2656.2009.01525.x
Undersampling bias: the null hypothesis for singleton species in tropical arthropod surveys
Blackwell Publishing Ltd
Jonathan A. Coddington1*, Ingi Agnarsson1,2, Jeremy A. Miller4, Matjaz Kuntner1,3 and Gustavo Hormiga5 1
Department of Entomology, National Museum of Natural History, NHB-105, Smithsonian Institution, PO Box 37012, Washington, DC 20013-7012, USA; 2Department of Biology, University of Puerto Rico, P.O. Box 23360, San Juan, PR 00931-3360, Puerto Rico; 3Institute of Biology, Scientific Research Centre of the Slovenian Academy of Sciences and Arts, Novi trg 2, PO Box 306, SI-1001 Ljubljana, Slovenia; 4Nationaal Natuurhistorisch Museum Naturalis, Darwinweg 2, 2333 CR Leiden, The Netherlands; and 5Department of Biological Sciences, The George Washington University, 2023 G Street NW, Washington D.C., 20052, USA.
Summary 1. Frequency of singletons – species represented by single individuals – is anomalously high in most large tropical arthropod surveys (average, 32%). 2. We sampled 5965 adult spiders of 352 species (29% singletons) from 1 ha of lowland tropical moist forest in Guyana. 3. Four common hypotheses (small body size, male-biased sex ratio, cryptic habits, clumped distributions) failed to explain singleton frequency. Singletons are larger than other species, not gender-biased, share no particular lifestyle, and are not clumped at 0·25–1 ha scales. 4. Monte Carlo simulation of the best-fit lognormal community shows that the observed data fit a random sample from a community of ~700 species and 1–2 million individuals, implying approximately 4% true singleton frequency. 5. Undersampling causes systematic negative bias of species richness, and should be the default null hypothesis for singleton frequencies. 6. Drastically greater sampling intensity in tropical arthropod inventory studies is required to yield realistic species richness estimates. 7. The lognormal distribution deserves greater consideration as a richness estimator when undersampling bias is severe. Key-words: Araneae, Guyana, neutral theory, sampling intensity, species richness estimation, spiders
Null models in biology perform the useful function of explaining many data in often infuriatingly simple ways (Gotelli & Graves 1996; Colwell & Lees 2000; Harte et al. 2001; Hubbell 2001; Green & Ostling 2003). Often they counterbalance ad hoc explanations of the pattern at hand. In this paper, we propose that the high frequency of ‘singleton’ species (those represented by single individuals) in tropical arthropod inventories or surveys is simply explained as undersampling, and use a large but incomplete survey of spiders in Guyana to make the point. Species richness estimation continues to play an increasingly important role in conservation and biological inventory assessment in multiple contexts (Cardoso et al. 2008; de Thoisy, Brosse, & Dubois 2008; Shen & He 2008; Schoeman, Nel, & Soares, 2008).
Journal >doi: 10.1111/j.1365-2656.2007.0@@@@.x of Animal Ecology (2007)
*Corresponding author. E-mail:
[email protected]
Table 1 gives the results of a keyword search of Biological Abstracts (through 2007) for the largest and most ambitious tropical arthropod surveys that provide data on singletons. As these studies clearly show, high singleton frequencies characterize typical tropical arthropod surveys, averaging 32% of species from the 71 studies. Why are there so many singletons in those surveys? Clearly, community-level singletons (and the species they represent) would have no chance to reproduce and could play no significant ecological role. Although the tropics are said to harbour many rare species, presumably most are not so rare as to lack at least a few conspecific neighbours with whom successfully to mate. Hence, singletons in biological surveys are anomalies, and as such have attracted much attention. To explain them, an array of ad hoc hypotheses have been proposed. However, we propose that, particularly when singleton frequencies are high, undersampling as a null hypothesis should precede more biological ad hoc explanations (McGill 2003).
© 2009 The Authors. Journal compilation © 2009 British Ecological Society
574
J. A. Coddington et al.
Table 1. Summary of tropical arthropod surveys. Arthropod surveys from tropical forest sites reporting total abundance (abun., or species presence per sample for ants, Agosti et al. 2000), species richness (spp.), and singletons (reported, calculated from figures given, or approximated as Fisher’s α, noted in source column). Intensity is abun./spp. A search of Biological Abstracts (1986–2007) on the terms (species richness) and (Arthropoda) and (Oriental region or Australasian region or Neotropical region or Ethiopian region) produced 514 results, many of which did not provide the required inventory statistics or were not from wet tropical sites. Those meeting our criteria, in addition to those known to us personally, are listed below. References for this table are listed in the Appendix
Taxon
Study site
Abun.
Spp.
Arthropods Insecta Insecta Insecta Insecta Insecta (leaf-chewing+ sap-sucking) Insecta
Australia Costa Rica (Area 1) Costa Rica (Area 2) Costa Rica (Area 3) Costa Rica (Area 4) New Guinea
20 507 488 1362 4857 1339 80 062
759 142 262 404 545 1050
Guyana
27 735
604
Panama (BCI) Australia (Queensland) Panama (BCI)
3224 10 000
Panama (BCI)
Blattaria Coleoptera
Singletons
Intensity
Percentage of Singletons
Source
271 91 165 254 390 278
27 3 5 12 2 76
36 64 63 63 72 26
Basset & Kitching 1991 Janzen & Schoener 1968 ‘’ ‘’ ‘’ Novotny & Basset 2000
229·5
46
38
79 1514
15 612
41 7
19 40
28 521
703
131
41
19
Basset et al. 2001 (singletons calculated) Wolda 1983 (Fisher’s α) Monteith & Davies 1984 (approx. values) Wolda 1987 (Fisher’s α)
6482
114
19·7
57
17
‘’
34 705 4840 3977 15 869 18 000
597 633 418 3429 1355
102·5 321 199 1728 623
58 8 10 5 13
17 51 48 50 46
8454
993
446·9
9
45
Coleoptera: Curculionidae Coleoptera: Pselaphidae, Anthicidae Coleoptera Coleoptera Coleoptera Coleoptera Coleoptera
Panama (BCI) New Guinea New Guinea Peru (Tambopata) Sulawesi
Coleoptera
Brazil
Coleoptera: Curculionidae Coleoptera: Staphylinidae Coleoptera Coleoptera Coleoptera Coleoptera: Scarabaeinae Coleoptera: Pselaphinae, Histeridae Coleoptera: Phytophagous Coleoptera Coleoptera: Scarabaeinae Coleoptera Coleoptera: Aticini Coleoptera Diptera: Muscidae Diptera: Phoridae Diptera: Syrphidae Ephemoptera
Honduras
26 891
293
38
9
13
‘’ Allison et al. 1993 Allison et al. 1997 Erwin 1997 Hammond et al. 1997 (approx. values) Didham et al. 1998 (singletons calculated) Anderson & Ashe 2000
Honduras
7349
224
53
33
24
‘’
Malaysia Uganda Ecuador Bolivia
8028 29 736 2329 4050
1711 1433 318 73
823 596 91 7
5 21 7 55
48 42 29 10
Chung et al. 2000 Wagner 2000 Lucky et al. 2002 Spector & Ayzama 2003
Ecuador
3465
385
155
9
40
Carlton et al. 2004
Panama
3009
364
139
8
38
Ødegaard 2004
15 181 7894
2001 101
397 20
8 78
20 20
Erwin et al. 2005 Escobar et al. 2005
1883 1891
518 106
266 32
4 18
51 30
Ganho & Marinoni 2005 Linzmeier et al. 2006
29 986 7014 3341 392 7178
1473 91 115 76 27
526 10 20 12 4
20 77 29 5 266
36 11 17 16 15
29 120 29 892 6004 22 046
33 21 98 458
882 1423 61 48
12 10 36 18
Stork & Grimbacher 2006 Costacurta et al. 2003 Brown 2004 Marinoni et al. 2004 Wolda & Flowers 1985 (Fisher’s α) ‘’ ‘’ Andrew & Hughes 2005 Wolda 1987 (Fisher’s α)
Ephemoptera Ephemoptera Hemiptera Homoptera
Ecuador Colombia Brazil (Parana) Brazil (Parana) Australia Brazil (Parana) Costa Rica Brazil (Parana) Panama (Corriente Grande) Panama (Miramar) Zaire Australia Panama (BCI)
4 2 35 82·1
© 2009 The Authors. Journal compilation © 2009 British Ecological Society, Journal of Animal Ecology, 78, 573–584
Undersampling bias and singleton species
575
Table 1. Continued
Taxon Homoptera Hymenoptera: Parasitica Hymenoptera: Formicidae Hymenoptera: Formicidae Hymenoptera: Apidae Lepidoptera: butterflies Lepidoptera: moths Lepidoptera: butterflies Lepidoptera: butterflies Lepidoptera: butterflies Lepidoptera Lepidoptera: butterflies Lepidoptera: Geometridae Odonata Orthoptera Psocoptera Psocoptera
Percentage of Singletons
Source
4
38
Wolda 1979
179
2
61
Noyes 1989
53
6
75
11
Longino & Nadkarni 1990
7904
437
51
18
12
Longino et al. 2002
Brazil (Minas Gerais)
1183
20
6
59
30
Nemesio & Silveira 2006
Malaysia
9031
620
118
15
19
Corbet 1942
Malaysia
9461
1048
538
9
51
Barlow & Woiwod 1989
Ecuador
6690
130
20
5
15
DeVries et al. 1997
Ecuador
883
91
22
10
24
DeVries et al. 1999
Ecuador
11 861
128
18
93
14
DeVries & Walla 2001
Borneo Thailand
485 1936
53 53
16 4
9 37
30 8
Schulze et al. 2001 Ghazoul 2002
Ecuador
23 720
868
161
27
19
Hilt et al. 2006
Peru Panama (BCI) Panama (BCI)
1537 1566 10 092
136 73 148
31 15·9 20
11 21 68
23 22 14
4301
84
10
15
12
Louton et al. 1996 Wolda 1987 (Fisher’s α) Broadhead & Wolda 1985 (Fisher’s α) ‘’
875
191
89
5
47
Study site
Abun.
Spp.
Panama (Pipeline Rd.) Sulawesi
1324
332
126
700
293
Costa Rica (Monteverde) Costa Rica
3998
Panama (Fortuna)
Singletons
Intensity
Araneae
Bolivia (50 m)
Araneae Araneae Araneae Araneae
Bolivia (1200 m) Bolivia (2200 m) Brazil (Manaus) Tobago
1109 654 75 1777
329 158 62 98
147 70 32 27
3 4 1 18
45 44 52 28
Araneae Araneae
Peru (Samiria) Peru (Pakitza)
5895 2616
1140 498
520 207
5 5
46 42
Araneae Araneae
Costa Rica Tanzania (understorey) Tanzania (canopy) Malaysia
7144 9096
86 170
11 32
83 54
13 19
5233 6999
149 578
35 145
35 12
23 25
573
231
93
2
40
1555
55
14
28
25
1821
635
341
3
54
222
123
78
2
63
5964 9372
351 464
101 176
17 61·6
Araneae Araneae
Araneae
Araneae
Mt. Cameroon (500 m) Mt. Cameroon (3000 m) Peru (Tambopata)
Araneae
Peru (Manu)
Araneae Averages
Guyana
Araneae
29 31·6
Coddington et al. 1991, 1996 ‘’ ‘’ Höfer et al. 1994 Hormiga & Coddington 1994 Silva 1996 Silva & Coddington 1996 Bodner 2002 Sørensen et al. 2002 Sørensen 2003 Floren & Deeleman-Reinhold 2005, personal communication Coddington et al., unpublished ‘’ Coddington & Silva, unpublished Erwin & Coddington, unpublished This study
© 2009 The Authors. Journal compilation © 2009 British Ecological Society, Journal of Animal Ecology, 78, 573–584
576
J. A. Coddington et al.
Singleton tropical arthropod species are anomalous for several reasons. First, minimum viable population sizes are conventionally at least 500 individuals (Gilpin & Soulé 1986). Second, many arthropods begin life clumped because eggs are clumped when laid – in spiders eggs are clustered within an egg sac. Most nonvolant arthropods are small and probably rarely travel hundreds or even dozens of metres to mate. Third, clumped distributions in nature are far more common than random or dispersed (Krebs 1999). While clumping certainly depends on scale, at hectare scales randomness is typical of canopy trees and jaguars, not small, nonflying, sedentary arthropods such as spiders. Ad hoc explanations for singletons often invoke aspects of the biology of particular groups, such as host or food plant specificity (Price et al. 1995). In spiders, males of sedentary web-spinning species must wander to find females (potentially passing through atypical habitat patches, i.e., tourists), and are likely to be small and rare (Vollrath & Parker 1992). General explanations include source-sink phenomena or mass-effects (e.g. ‘ecological drift,’ Hubbell 2001) at both local (‘tourist’) and regional (‘waif’ or ‘vagrant’) scales (Schmida & Wilson 1985; Pulliam 1988; Southwood 1996; Stork & Hammond 1997; Novotny & Basset 2000; Magurran & Henderson 2003; Basset et al. 2004; Ødegaard 2004). Time, space, or method ‘edge effects’ are also frequent explanations. Adults outside their breeding seasons are scarce, and if only adults are identifiable (true for spiders), will be artefactually rare (Ulrich 2001; Longino, Coddington, & Colwell 2002; Scharff et al . 2003; Basset et al . 2004). Nocturnality or seasonal migration could produce similar effects. Space edge effects are usually microhabitat preferences. Species patches just trespassing on plot boundaries might produce many ‘false’ singletons. Method edge effects are the accidental sampling of a species by an inappropriate method, such as a canopy species in a pitfall trap (Longino et al. 2002; Scharff et al. 2003). Finally, singletons may be absolutely rare, i.e. sparse with large nearest-neighbour distances throughout their range. Perhaps, as is now recognized for tropical trees (Pitman et al. 1999; Kenfack et al. 2006), we drastically underestimate the scale at which many tropical arthropod species live and ought to be sampled. Undersampling bias and biological explanations are not mutually exclusive. However, if repeated random sampling of communities modelled on statistical parameters estimated from the sample mimic the observed results, undersampling should serve as the initial null explanation for high singleton frequencies (McGill 2003), analogous to the use of null models in other fields (Harte et al. 2001; Hubbell 2001). Variation not explained by undersampling may then be attributed to more complex causes. Statistical methods to assess undersampling bias are relatively recent; quantitative estimates of its magnitude have been historically difficult, if not impossible, to obtain. Observed richness values are traditionally used for descriptive or comparative purposes (Groombridge 1992; Heywood & Watson 1995; Levin 2001). If high singleton frequencies indicate undersampling, however, then tropical arthropod
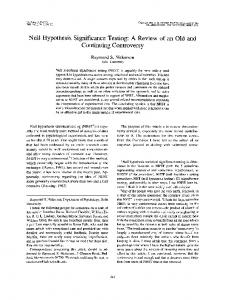
Fig. 1. Plot design of four nested 0·25-ha subplots A-D with counts of singletons (italics) per subplot and doubletons per subplot pairs (lines with adjacent numbers).
communities are substantially larger than measured, and comparisons based on observed numbers are misleading. This has important implications for conservation biology, and also implies that typical inventories are under-resourced and/or poorly designed. Here we use the results of an intensive 1-ha survey of spiders to test various explanations for high singleton frequency. Although spiders are typical sedentary arthropod predators and these results may apply only to that guild, high singleton frequencies also characterize inventories of other tropical arthropods (Table 1). Specifically, we test four process hypotheses and the null hypothesis of undersampling bias: singletons tend to be small and therefore missed; singletons tend to be males because as adults they travel further than females; nearest conspecific distances exceed 0·25–1 ha spatial scales (population structure is much larger than anticipated); singletons are ‘cryptic’ and hard to detect; and singletons are simply an artefact of undersampling because the scope of the survey exceeded sampling resources.
Methods STUDY SITE
The study was carried out during 10 days, 5–14 July, 1999, in a primary lowland blackwater rainforest (1°36′46″N, 58°38′15″W) on the bank of Essequibo River, 240 m elevation, 4·42 km south of Gunn’s landing, Upper Takutu-Upper Essequibo, Guyana. Four nested, concentric 0·25-ha subplots (total 1 ha) were established in uniform closed canopy forest (Fig. 1). Five experienced collectors worked simultaneously in the field during both day and night using a battery of collecting methods that broadly access most of the spider fauna (see Coddington et al. 1991; Sørensen, Coddington, & Scharff 2002; Scharff et al. 2003 for details).
© 2009 The Authors. Journal compilation © 2009 British Ecological Society, Journal of Animal Ecology, 78, 573–584
Undersampling bias and singleton species
CONSPECIFIC DISTANCES
The nested subplot design provided a range of spatial scales. If singletons are spatial edge effects – multi-individual clumps or patches with only one individual in the subplot or plot – the outermost subplot with the largest perimeter should contain the most singletons (Fig. 1). Likewise, doubletons of spatially clumped species should occur in the same subplot. More generally, we tested for clumping by comparing the observed distribution of singletons and doubletons among subplots against the null hypothesis of equal frequency in all possible subplot combinations (e.g. A, B, C, or D for singletons, and AA, AB, AC, AD, BB, etc. for doubletons).
BODY SIZE
We measured total body length to the nearest 0·1 mm of one individual of each sex (when available) of each species. The ‘average’ tropical spider is then the mean of these lengths (assuming equal sex ratios) weighted by the relative abundance of each species. A t-test then compared mean size of singletons to nonsingletons.
SEX RATIO
Using the observed sex ratio in the total sample as the null, we compared the singleton sex ratio to it with a chi-squared test, both for singletons as a whole and for singletons of web-spinning species only, where males must wander to encounter the sedentary females.
CRYPTIC HABITS
Generally speaking, spider species within families are more alike in their biology than between (Coddington and Levi 1991). Araneids mostly spin orb-webs, mostly above the forest floor, but anapids and symphytognathids spin theirs mostly in the leaf litter. Philodromids run on leaves, and salticids jump between them (but only during the day). Because tropical 1-ha inventories usually find at least 30 families, testing the relative frequency of singletons among families against a null of the relative abundance of families in the total sample should detect whether singletons tend to have one lifestyle more frequently than another.
UNDERSAMPLING BIAS
We assessed inventory completeness by visually inspecting the average of 50 resamples of the observed species accumulation curve, as well as the singleton and doubleton curves, and four commonly used species richness estimators (Chao1, Chao2, ICE and ACE; Peterson & Slade 1998; Walther & Martin 2001; Colwell 2005). In a complete inventory, the observed curve should asymptote and singletons should tend to zero, with doubletons lagging singletons. If incomplete but sufficient to estimate richness accurately, estimator curves should asymptote (Colwell & Coddington 1994). Constantly rising curves of all sorts imply incomplete inventories. We also fit the data to a lognormal distribution using the method described in Scharff et al. (2003) and Longino et al. (2002). We use the lognormal as a reasonable null hypothesis (McGill 2003). Other models, such as the parameter-rich zero-sum multinomial, have been proposed as better fits to empirical data than the lognormal (e.g. Hubble 2001), however, a recent detailed test fails to support that claim, and indeed showed the opposite (McGill 2003). Given the high number of parameters in the zero-sum model, the cumbersome
577
procedure of fitting the model, and lack of evidence for its superior fit to empirical data, McGill advised the preferential use of the lognormal as the simpler (more parsimonious) null model. Using the best-fit lognormal parameters, we generated and randomly sampled 6000 individuals from 1000 replicate communities of each of four sizes: 500, 600, 700, or 800 species, which parameters were chosen to mimic the empirical sample. We then compared the observed sample to these 4000 simulated samples on numbers of singletons, doubletons, and species. If the observed sample clearly deviated, undersampling bias alone does not explain high singleton frequency. Statistical tests, curve fitting, modelling, resampling procedures, and species richness estimation used a combination of systat 11 (Systat Software, Inc., Richmond, CA, USA), EstimateS 7·50 (Colwell 2005), and Microsoft Excel 2007 (Microsoft Corp., Redmond, WA, USA). Finally, a few measures of leaf litter, shrub/subcanopy, and canopy tropical moist forest spider densities per m2 have been published (Table 2). Extrapolated to 1 ha, these statistics provide crude estimates of spider abundance that can be compared to the total abundances predicted by the lognormal model.
SPECIMENS AND SORTING PROCEDURES
Each sample was labelled with plot, date, collector, method, and replicate number if two samples were otherwise identical. Team members (all arachnological taxonomists) or other experts on particular families sorted the specimens to morphospecies. All identifications of singletons and doubletons were checked and verified by at least two of the team members. Voucher specimens of each species identified in this study are deposited at the National Museum of Natural History (NMNH), Smithsonian Institution, Washington DC.
Results The five collectors accumulated 300 samples over 10 days from the 1-ha plot (Table 3) containing a total of 5965 adults (and 6953 juveniles) of 352 species, of which 101 were singletons (29%) and 56 were doubletons. The most abundant species numbered 412. Inventory completion (observed richness/ Chao1 estimate) ranged from 15% to 71% among methods, and overall was 79%. Sampling intensity (no. of ind./no. of spp.) ranged from 1·4 to 10·5 among methods and overall was 17. The survey compares favourably to other large published efforts in intensity and numbers of species encountered, considering that most spider species cannot be trapped (Table 1). However, the continually rising accumulation curves and richness estimators indicate that the inventory was still incomplete by the end of sampling (Fig. 2). The 95% upper confidence limit of the Chao2 estimator (itself only a lower-bound estimate), for example, was 520 species, but clearly had not reached a limit. True species richness in the hectare almost certainly exceeded 500 species, and probably much more. The mean and standard deviation of the body lengths of adults collected was 2·89 ± 2·85 mm (thus an estimate of the average size of an adult lowland tropical moist forest spider). The mean singleton body length was 5·30 ± 4·67 mm. Singletons are significantly larger, not smaller, than the average species.
© 2009 The Authors. Journal compilation © 2009 British Ecological Society, Journal of Animal Ecology, 78, 573–584
578
J. A. Coddington et al.
Table 2. Spider density in tropical forests. Estimated number of total and adult spiders in a hectare of primary tropical rainforest. Min, computed from minimum values; max, from maximum values. References for this table are listed in the Appendix Density (n/m2) Layer
Place
Method
Brazil Brazil Brazil Brazil Mean
Berlese Berlese Berlese Berlese
Brazil Brazil Guyana Guyana Mean
Beating Beating Beating Day Beating Night
Brunei Sulawesi Australia Tanzania Brazil Brazil Brazil Mean Total spiders (1 m2 column) Min spiders (1 m2 column) Max spiders (1 m2 column) Total spiders (ha) Min spiders (ha) Max spiders (ha)
Fog Fog Fog Fog Fog Fog Fog
Total
Adults
Source
Ground 221 330 129 108 197·0
71·8 125·2 41·9 35·1 68·5
Höfer & Brescovit 2001 Höfer & Brescovit 2001 Morais 1985 Adis & Schubart 1984
0·5 3·5 2·7 1·9 2·2
0·2 1·1 0·9 0·6 0·7
Höfer & Brescovit 2001 Höfer & Brescovit 2001 This study This study
4·7 4·6 8·6 4·8 4·8 2·0 5·5 5·0 204 111 342 2 041 500 1 105 000 3 421 000
1·5 1·5 2·8 1·5
Russell-Smith & Stork 1994 Russell-Smith & Stork 1995 Basset 1990, 1991 Sørensen 2003 Adis 1984 Höfer et al 2001 Höfer et al. 1994
Shrub
Canopy
0·7 1·8 1·6 71 36 129 708 333 360 000 1 291 000
Table 3. Collecting methods and results. AE, BE, CR, GR, PF, SW, D and N stand for aerial, beating, cryptic, ground, pitfall, sweeping, day, and night collecting methods, respectively (see text). Sample intensity is total individuals/total species. Inventory completion is total species/ Chao1 estimate
No. of samples Total individuals Total species Singletons Doubletons Sample intensity Percentage of Singletons Chao1 estimate Inv. completion
AED
AEN
BED
BEN
CRD
CRN
GRD
GRN
PF
SWD
SWN
Total
12 102 45 32 2 2·3 71% 301 15%
76 2210 210 73 29 10·5 35% 302 70%
36 644 138 57 29 4·7 41% 194 71%
19 272 95 53 15 2·9 56% 189 50%
28 528 69 29 9 7·7 42% 112 62%
20 399 72 34 13 5·5 47% 120 60%
28 621 69 30 9 9·0 43% 115 60%
32 703 115 54 17 6·2 47% 200 57%
46 439 57 25 4 7·7 44% 135 42%
2 23 15 11 2 1·5 73% 45 33%
1 24 17 14 1 1·4 82% n/a
300 5965 352 101 54 17·0 29% 443 79%
The overall male : female sex ratio in the sample was significantly female biased (1:1·3, P < 0·01). The overall singleton sex ratio was as biased as the total sample (1:1·7, P = 0·18). Sedentary web-spinner singletons were equally biased (1:2·8, P = 0·12). Singletons, therefore, are not disproportionately males of sedentary web-spinning species. The distribution of doubletons across subplots (Fig. 1) was random (P = 0·82) as was the incidence of singletons from the centre to the outermost subplot (P = 0·80). Tripletons also showed no tendency to clump within subplots. Conspecific
nearest neighbour distances, therefore, are not clumped at the coarse 0·25- to 1-ha scales tested here. Singletons showed no taxonomic pattern, occurring in families in proportion to the latter’s relative abundance (P > 0·99). If undersampling bias varied according to lifestyle defined as family identity, the effect was not detectable at this level of sampling intensity. The observed data fit the lognormal distribution well (Fig. 3, 0·9 > P > 0·5). The predicted number of species in the modal octave S0 was 76·4 ± 13 (μ = 6·2562), the variance term
© 2009 The Authors. Journal compilation © 2009 British Ecological Society, Journal of Animal Ecology, 78, 573–584
Undersampling bias and singleton species
579
Fig. 2. Four species richness estimators (ACE, ICE, Chao 1, Chao 2), the 95% upper confidence limit of the Chao2 estimator, observed, singleton, and doubleton curves for data of Table 3.
Fig. 3. Lognormal fit (0·9 > P > 0·5) to data of Table 3. Predicted community size is 694 species. Note the over-estimation of abundant species at the right-hand tail.
(‘a’) was 0·195 ± 0·210 (σ = 3·6262) and estimated community size 694 species. Figure 4 shows the results of 1000 random draws of constant sampling effort (6000 individuals) from simulated lognormal distributions with the above parameter values for 500, 600, 700, and 800 total species, compared to the observed data (arrow). For clarity, only 25 randomly chosen samples from each community size are plotted, as otherwise the observed data point would have been completely obscured. Observed richness rises with total richness, and numbers and percentages of singletons and doubletons rise because, as richness increases, sampling intensity decreases. On these three statistics, the empirical sample falls between the 700 and 800 species model communities, roughly agreeing with the lognormal richness estimate in Fig. 3. Overall, it falls well within the stochastic variation seen in these random draws from ‘null’ lognormal distributions (Fig. 4). True singletons in the model lognormal communities averaged only 4% of the total. To assess how many more specimens would be required to enable richness estimators to cover true community richness under these circumstances, we sampled 60 000 (intensity 170)
Fig. 4. Singleton, doubleton, and observed species totals from the Guyana study (open circle, arrow) and 25 random samples of 6000 individuals from model lognormal communities of 500, 600, 700, and 800 species.
© 2009 The Authors. Journal compilation © 2009 British Ecological Society, Journal of Animal Ecology, 78, 573–584
580
J. A. Coddington et al.
Fig. 5. Log-log plot of sampling intensity vs. percentage of singletons for data of Table 1 (r2 = 0·58; P = 0·001).
and 120 000 individuals (intensity 340) from the 700 species lognormal community, thus 10 and 20 times the actual sampling effort. At an intensity of 170, percentage of singletons was 14%, and the Chao and coverage estimators were 595–600 species with Chao upper confidence intervals of 636 species – still short of the true 700 species richness. At an intensity of 340, the Chao and coverage estimators were 650–663 species, with a Chao upper confidence interval of 702 species – thus just covering the true richness value – and percentage of singletons fell to 9%. Figure 5 depicts the logarithmic decline in singletons with sampling intensity for the data of Table 1, and predicts zero singletons at sampling intensities of roughly 1100. Sampling the model community at that intensity yielded on average 4% singletons and 658 species observed. We present what few data exist on tropical spider densities in Table 2. Ignoring differences due to locality and construed as a ground to canopy vertical 1 m2 column, the leaf litter contains most individuals, the canopy/subcanopy less, and the shrub/understorey layer least. Given the decrease in leaf area or other substrate with height above the ground, the decline is plausible. It predicts, extremely roughly, about 2 million total spiders per hectare of tropical forest (range 1·1– 3·4 M). The modelled lognormal populations ranged between 1·2 and 3·3 million individuals, which agrees with Table 2.
Discussion Rare species and estimating total species richness in particular are difficult statistical problems (Bunge & Fitzpatrick 1993; Ulrich 2001; Brose, Martinez, & Williams 2003; Magurran 2004; Ellison & Agrawal 2005; Cunningham & Lindenmayer 2005; Mao & Colwell 2005; Walther & Moore 2005). Estimating how many data are required to obtain robust and reliable species richness estimates is also difficult (Keating et al. 1998;
McArdle 1990). This complicates inventory design. Modelling studies have suggested that nonparametric richness estimators do not begin to cover the true value until about two-thirds to four-fifths of the species have been observed (Walther & Morand 1998; Mao & Colwell 2005). On the other hand, intensely sampled communities usually are lognormal at local scales, even if the full distribution is truncated by failure to detect rare species (Sugihara 1980; Longino et al. 2002; Connolly et al. 2005, but see Williamson & Gaston 2005). In this study, the empirical sample of 6000 individuals may have included only half the species present, with singletons comprising 29% of species observed. Nonparametric richness estimators suggested only 443–460 species, a shortfall of 35% compared to the lognormal estimate. While any singleton may have been due to any of the process explanations discussed above, the simplest explanation for the high frequency is undersampling. As sampling continues and singleton frequencies drop, biological explanations become more plausible. Two ‘biological’ explanations were statistically significant, but neither in the direction hypothesized. Singletons were significantly larger (not smaller) than the average spider. Twenty-three singletons over 7 cm caused that difference. These were mostly large cursorial species (including ctenids, sparassids, and miturgids) for which absolute densities of one, or very few individuals per hectare are plausible. Singletons are also disproportionately females, not males, but the sample in general was female-biased, and singletons no more so, even among sedentary web-spinning species where the presumed bias towards singleton wandering males should have been most pronounced. Adult male spiders are relatively short lived and wandering males experience exceptionally high mortality (Vollrath & Parker 1992); both of these factors likely contribute to a female-biased sex ratio in the inventory data, even if the sex ratio at birth were even (as they are for most spiders examined to date, see Avilés & Maddison 1991, Avilés, McCormack, Cutter & Bukowski 2000). The other explanations tested, lifestyle, spatial edge effects, and clumping of individuals at 1-ha scales and below, were insignificant. Novotny & Basset (2000) and Ulrich (2001) also found that few biological explanations of singletons were supported. Magurran & Henderson (2003) use a 21-year data set on a temperate fish community of 80 species to show that about a third to a half of the species accumulated over that time-span were tourists or waifs. In any given short-term sampling event, however, presumably few of the rare species would have been tourists or waifs. In a spider inventory of a ‘known’ fauna, Scharff et al. (2003) hypothesized 58% of singletons as phenological, methodological, or spatial edge effects, but they did not test the null hypothesis of undersampling bias. For relatively instantaneous events such as this inventory, singleton frequencies are about what one would expect from random samples of a lognormally distributed community – in this case, of about 700 species. The null hypothesis of undersampling bias cannot be rejected. This was an intense, short-term inventory (300 person-hours), designed to yield an ‘instantaneous’ richness estimate that avoided the confounding effect of phenological change.
© 2009 The Authors. Journal compilation © 2009 British Ecological Society, Journal of Animal Ecology, 78, 573–584
Undersampling bias and singleton species Especially in relatively aseasonal tropical habitats, sampling year round or for multiple years might yield a more complete inventory over and above the effect of greater sampling intensity (DeVries, Walla, & Greeney 1999; Scharff et al. 2003). Increasing the sampling area might also improve efficiency, especially if, as perhaps suggested by the significantly larger singleton size and the possibility that some true singletons occur in any given hectare, we underestimated the scale at which sedentary tropical arthropods should be sampled. Their lifetime ranges may encompass much larger areas. On the other hand, species richness increases logarithmically with area (Rozenzweig 1995), burdening species richness estimates. Regardless, the key point is that the scope of the inventory must be carefully matched to available resources. What little we know of tropical spider communities broadly agrees with the predictions of the lognormal fit (Table 2). Our empirical sample included only nine of 23 predicted octaves, yet the implied community, when randomly sampled at the same intensity, compared well to empirical observations of total species, numbers of singletons and doubletons, maximum abundance, and total numbers of individuals (Fig. 4). None of the collecting methods used in Table 2 are completely efficient, therefore, the actual hectare abundance of spiders is probably higher. When the modelled 700 species community was sampled at an intensity of 1100, on average 658 species and 4% singletons resulted. Lognormal distributions always predict some singletons (here on average 28 or 4%), and stochastic replicates never contain all 700 species (here on average 685). Practically speaking, sampling intensities of 1100 detects just about as many species as stochastic models provide. For these data, a sampling intensity of 340 (10 times the actual sampling effort) was just sufficient to include the known richness within the upper bound of the Chao2 estimator. This implies that inventories, as a rule of thumb, should aim for intensities between that and 1100 to obtain realistic nonparametric estimates of species richness. Richness estimators are relatively more efficient if they can report the true richness based on relatively few data. The efficiency of available nonparametric richness estimators is poor in the sense that roughly three quarters of the community must be observed before the estimator confidence interval actually covers the true value (Walther & Morand 1998). Chao estimators, moreover, have a maximum upper bound of about half the square of the observed richness (if the sample of n species contains n-1 singletons or uniques and one doubleton or duplicate), but in practice such efficiencies are never achieved because of the improbability of so biased a sample. The lognormal distribution can potentially result in higher richness estimates than nonparametric approaches (given the same data) because it assumes the relative abundance distribution is symmetric around the modal octave (Sugihara 1980; Longino et al. 2002), and therefore tends to at least double the observed richness. A number of authors argue that empirical communities show an asymmetric excess of rare species (Nee, Harvey, & May 1991; Nekola & Brown 2007), and Hubbell
581
and co-workers argue from first principles that such is expected (Hubbell 2001; Volkov et al. 2003). However, McGill (2003) suggests that this observed skew in species abundance distributions may also be a sampling artefact. One might also point out that the lognormal even less realistically overestimates the abundant tail of the distribution (Fig. 3, Longino et al. 2002; Magurran & Henderson 2003). However, even if the lognormal slightly underestimates rare species, that error is small compared to the gross negative bias of nonparametric estimators at small sample sizes. The stochastic variation in small samples drawn from the same lognormal population is impressive (Fig. 4). For the 700 species case, 1000 draws of 6000 individuals produced singleton counts of 62–134 and observed richnesses from 121–414, which comfortably cover the observed statistics of 101 and 351. The lognormal distribution therefore may still be a useful method to estimate species richness under circumstances where many data are available, yet not enough for nonparametric estimators to function well. Unlike the relative abundance distribution-based estimators of Ulrich (1999, 2005), it does not require an explicit ratio of sampled to total habitat area, and thus is more practical in the field. If general, this result implies that even large survey efforts (Table 1, Fig. 5) continue to undersample tropical arthropod biodiversity by perhaps a factor of 2 if singletons average 32% of the total. In many surveys, the figure is much higher (Table 1). Undersampling is a serious issue even for large mammal and bird surveys, where singletons average 16% (Bernard & Fenton 2002; Shankar and Sukamar 2002; McCain 2004). Consequently, typical surveys will underestimate species richness, with obvious implications for our understanding of biodiversity, and for any conservation decisions based on such data. In summary, it appears that most tropical arthropod biodiversity surveys have been severely under-resourced if their goal was to census or estimate species richness of a defined taxonomic community at a particular place and time. Reliable methods do exist to estimate how many data are required to estimate many ecological statistics (Krebs 1999; Magurran 2004), but species richness historically is an exception. One may hope that future statistical research will improve estimator efficiency, but in the meantime the use of existing estimators dramatically exposes the gap between inventory design as implemented and the minimum necessary to obtain reliable richness estimates. Here the lognormal was more efficient than nonparametric estimators, and perhaps should be used more frequently. Species richness estimators are increasingly used in basic research to detect undersampling bias; results thus far suggest that it is ubiquitous and severe. Rather than scaling back inventory goals, we suggest that inventory analyses continue to assess undersampling bias in order to justify the budgets required to obtain adequate data. Funding sources and consumers of these essential data can scarcely argue that inadequate results are acceptable. If results continue to demonstrate that much greater sampling intensities are required, such will eventually become the norm, rather than the exception.
© 2009 The Authors. Journal compilation © 2009 British Ecological Society, Journal of Animal Ecology, 78, 573–584
582
J. A. Coddington et al.
Acknowledgements Thanks to Vicky Funk, Carol Kelloff, David Clarke, Tom Hollowell, and Romeo Williams for logistical support, and Rick West, Gita Bodner, G. B. Edwards, Martín Ramírez, Fernando Alvarez-Padilla, Scott Larcher, and Dana DeRoche for specimen work and identification. We are grateful for the hospitality of the WaiWai community of Southern Guyana. We thank Robert Colwell, Phil DeVries, Jack Longino, and Anne Magurran for comments on an earlier draft. Support for this research came from a Smithsonian ‘Biodiversity of the Guianas’ grant to J. A. Coddington, a Smithsonian Neotropical Lowlands grant to J. Coddington, and a National Science Foundation grant to G. Hormiga and J. Coddington (DEB 9712353).
References Aviles, L. & Maddison, W.P. (1991) When is the sex-ratio biased in social spiders – chromosome-studies of embryos and male meiosis in Anelosimus species (Araneae, Theridiidae). Journal of Arachnology, 19, 126–135. Aviles, L., McCormack, J., Cutter, A. & Bukowski, T. (2000) Precise, highly female-biased sex ratios in a social spider. Proceedings of the Royal Society B: Biological Sciences, 267, 1445–1449. Basset, Y., Mavoungou, J.F., Mikissa, J.B., Weiblen, G.D., Missa, O. & Stewart, A.J.A. (2004) Discriminatory power of different arthropod data sets for the biological monitoring of anthropogenic disturbance in tropical forests. Biodiversity and Conservation, 13, 709–732. Bernard, E. & Fenton, M.B. (2002) Species diversity of bats (Mammalia: Chiroptera) in forest fragments, primary forests, and savannas in central Amazonia, Brazil. Canadian Journal of Zoology, 80, 1124–1140. Brose, U., Martinez, N.D. & Williams, R.J. (2003) Estimating species richness: sensitivity to sample coverage and insensitivity to spatial patterns. Ecology, 84, 2364–2377. Bunge, J. & Fitzpatrick, M. (1993) Estimating the number of species: a review. Journal of the American Statistical Association, 88, 364–373. Cardoso, P., Gaspar, C., Pereira, L. C., Silva, I., Henriques, S. S., da Silva, R. R. & Sousa, P. (2008) Assessing spider species richness and composition in Mediterranean cork oak forests. Acta Oecologica-International Journal of Ecology, 33, 114–127. Coddington, J.A. & Levi, H.W. (1991) Systematics and evolution of spiders (Araneae). Annual Review of Ecology and Systematics, 22, 565–592. Coddington, J.A., Griswold, C.E., Silva, D. & Larcher, L. (1991) Designing and testing sampling protocols to estimate biodiversity in tropical ecosystems. The Unity of Evolutionary Biology: Proceedings of the Fourth International Congress of Systematic and Evolutionary Biology (ed. E.C. Dudley), pp. 44– 60. Dioscorides Press, Portland, Oregon Colwell, R.K. (2005) EstimateS: Statistical Estimation of Species Richness and Shared Species from Samples. Version 7·5. Available from URL: http:// purl.oclc.org/estimates. Colwell, R.K. & Coddington, J.A. (1994) Estimating the extent of terrestrial biodiversity through extrapolation. Philosophical Transactions of the Royal Society of London. Series B, Biological Sciences, 345, 101–118. Colwell, R.K. & Lees, D.C. (2000) The mid-domain effect: geometric constraints on the geography of species richness. Trends in Ecology & Evolution, 15, 70–76. Connolly, S.R., Hughes, T.P., Bellwood, D.R. & Karlson, R.H. (2005) Community structure of corals and reef fishes at multiple scales. Science, 309, 1363–1365. Cunningham, R.B. & Lindenmayer, D.B. (2005) Modeling count data of rare species: some statistical issues. Ecology, 86, 1135–1142. de Thoisy, B., Brosse, S. & Dubois, M.A. (2008) Assessment of large-vertebrate species richness and relative abundance in Neotropical forest using linetransect censuses: what is the minimal effort required? Biodiversity and Conservation, 17, 2627–2644. DeVries, P.J., Walla, T.R. & Greeney, H.F. (1999) Species diversity in spatial and temporal dimensions of fruit-feeding butterflies from two Ecuadorian rainforests. Biological Journal of the Linnean Society, 68, 333–353. Ellison, A.M. & Agrawal, A.A. (2005) The statistics of rarity. Ecology, 86, 1079–1080. Gilpin, M.E. & Soulé, M.E. (1986) Minimum viable populations: The processes of species extinctions. Conservation Biology: The Science of Scarcity and Diversity (ed M.E. Soulé), pp. 13–34. Sinauer & Associates, Sunderland, Massachusetts. Gotelli, N.J. & Graves, G.R. (1996) Null Models in Ecology. Smithsonian Books, Washington DC. Green, J.L. & Ostling, A. (2003) Endemics-area relationships: the influence of species domination and spatial aggregation. Ecology, 84, 3090–3097.
Groombridge, B. (1992) Global Biodiversity: Status of the Earth’s Living Resources. Chapman and Hall, Florida. Harte, J., Conlisk, E., Ostling, A., Green, J.L. & Smith, A.B. (2001) A theory of spatial structure in ecological communities at multiple spatial scales. Ecological Monographs, 75, 179–197. Heywood, V.H. & Watson, R.T. (1995) Global Biodiversity Assessment. Cambridge University Press, Massachusetts. Hubbell, S.P. (2001) The unified neutral theory of biodiversity and biogeography. Monographs in Population Biology, 32, 1–375. Keating, K.A., Quinn, J.F., Ivie, M.A. Ivie, L.L. (1998) Estimating the effectiveness of further sampling in species inventories. Ecological Applications, 8, 1239–1249. Kenfack, D., Thomas, D.W., Chuyong, G., Condit, R. (2006) Rarity and abundance in a diverse African forest. Biodiversity and Conservation, 16, 2045– 2074. Krebs, C.J. (1999) Ecological Methodology. Addison Wesley Longman, Essex, UK. Levin, S.A. (2001) Encyclopedia of biodiversity. Academic Press, New York. Longino, J.T., Coddington, J.A. & Colwell, R.K. (2002) The ant fauna of a tropical rain forest: estimating species richness three different ways. Ecology, 83, 689–702. Magurran, A.E. (2004) Measuring Biological Diversity. Blackwell Publishing, Oxford, UK. Magurran, A.E. & Henderson, P.A. (2003) Explaining the excess of rare species in natural species abundance distributions. Nature, 422, 714–716. Mao, C.X. & Colwell, R.K. (2005) Estimation of species richness: mixture models, the role of rare species, and inferential challenges. Ecology, 86, 1143–1153. McArdle, B.H. (1990) When are rare species not there? Oikos, 57, 276–277. McCain, C.M. (2004) The mid-domain effect applied to elevational gradients: species richness of small mammals in Costa Rica. Journal of Biogeography, 31, 19–31. McGill, B.J. (2003) A test of the unified neutral theory of biodiversity. Nature, 422, 881–885. Morais, J.W.D. (1985) Abundance and Vertical Distribution of Soil Arthropoda in a Primary, Non-Flooded Forest. INPA/FUA, Manaus, Brazil. Nee, S., Harvey, P.H. & May, R.M. (1991) Lifting the veil on abundance patterns. Proceedings of the Royal Society B: Biological Sciences, 243, 161–163. Nekola J.C. & Brown J.H. (2007) The wealth of species: ecological communities, complex systems and the legacy of Frank Preston. Ecology Letters, 10, 188 – 196. Novotny, V. & Basset, Y. (2000) Rare species in communities of tropical insect herbivores: pondering the mystery of singletons. Oikos, 89, 564–572. Ødegaard, F. (2004) Species richness of phytophagous beetles in the tropical tree Brosimum utile (Moraceae): the effects of sampling strategy and the problem of tourists. Ecological Entomology, 29, 76–88. Peterson, A.T. & Slade, N.A. (1998) Extrapolating inventory results into biodiversity estimates and the importance of stopping rules. Diversity and Distributions, 4, 95–105. Pitman, N.C.A., Terborgh, J., Silman, M.R. & Percy Nunez, V. (1999) Tree species distributions in an upper Amazonian forest. Ecology, 80, 2651– 2661. Price, P.W., Diniz, I.R., Morais, H.C. & Marques, E.S.A. (1995) The abundance of insect herbivore species in the tropics: the high local richness of rare species. Biotropica, 27, 468–478. Pulliam, H.R. (1988) Sources, sinks, and population regulation. American Naturalist, 132, 652–661. Rozenzweig, M.L. (1995) Species Diversity in Time and Space. Cambridge University Press, Cambridge, UK. Scharff, N., Coddington, J.A., Griswold, C.E., Hormiga, G., De Place Bjorn P. (2003) When to quit? Estimating spider species richness in a northern European deciduous forest. Journal of Arachnology, 31, 246–273. Schmida, A. & Wilson, M.R. (1985) Biological determinants of species diversity. Journal of Biogeography, 12, 1–20. Schoeman, D.S., Nel, R. & Soares, A.G. (2008) Measuring species richness on sandy beach transects: extrapolative estimators and their implications for sampling effort. Marine Ecology-an Evolutionary Perspective, 29, 134– 149. Shankar, T.R.R. & Sukumar, R. (2002) Responses of tropical rainforest birds to abandoned plantations, edges and logged forest in the Western Ghats, India. Animal Conservation, 5, 201–216. Shen, T.J. & He, F.L. (2008) An incidence-based richness estimator for quadrats sampled without replacement. Ecology, 89, 2052–2060. Sørensen, L.L., Coddington, J.A. & Scharff, N. (2002) Inventorying and estimating sub-canopy spider diversity using semi-quantitative sampling
© 2009 The Authors. Journal compilation © 2009 British Ecological Society, Journal of Animal Ecology, 78, 573–584
Undersampling bias and singleton species methods in an Afromontane forest. Environmental Entomology, 31, 319– 330. Southwood, T.R.E. (1996) The Croonian Lecture, 1995: natural communities: structure and dynamics. Philosophical Transaction of the Royal Society of London. Series B, Biological Sciences, 351, 1113–1129. Stork, N.E. & Hammond, P.M. (1997) Sampling arthropods from tree-crowns by fogging with knock-down insecticides: lessons from studies of oak tree beetle assemblages in Richmond Park (UK). Canopy Arthropods (eds N.E. Stork, J. Adis, & R.K Didham), pp. 5–26. Chapman and Hall, Florida. Sugihara, G. (1980) Minimal community structure: an explanation of species abundance patterns. American Naturalist, 116, 770–787. Ulrich, W. (1999) Estimating species numbers by extrapolation I: comparing the performance of various estimators using large model communities. Polish Journal of Ecology, 47, 271–291. Ulrich, W. (2001) Ecological characteristics of rare species: the case of parasitic Hymenoptera. Polish Journal of Ecology, 49, 379–389. Ulrich, W. (2005) Limits to the estimation of species richness: the use of relative abundance distributions. Diversity and Distributions, 11, 265–273. Volkov, I., Banavar, J.R., Hubbell, S.P. & Maritan, A. (2003) Neutral theory and relative species abundance in ecology. Nature, 424, 1035–1037. Vollrath, F. & Parker, G.A. (1992) Sexual dimorphism and distorted sex ratios in spiders. Nature, 360, 156–159. Walther, B.A. & Martin, J.L. (2001) Species richness estimation of bird communities: how to control for sampling effort. Ibis, 143, 413–419. Walther, B.A. & Moore, J.L. (2005) The concepts of bias, precision and accuracy, and their use in testing the performance of species richness estimators, with a literature review of estimator performance. Ecography, 28, 815– 829. Walther, B.A. & Morand, S. (1998) Comparative performance of species richness estimation methods. Parasitology, 116, 395–405. Williamson, M. & Gaston, K.J. (2005) The lognormal distribution is not an appropriate null hypothesis for the species–abundance distribution. Journal of Animal Ecology, 74, 409–422. Received 30 October 2008; accepted 29 December 2008 Handling Editor: Simon Leather
Appendix 1. References for Tables 1 and 2 Adis, J. (1984) ‘Seasonal Igapó’ forests of Central Amazonian blackwater rivers and their terrestrial arthropod fauna. The Amazon Limnology and Landscape Ecology of a Mighty Tropical River and its Basin (ed. H. Sioli), pp. 245–268. Junk Publications, Dordrecht and Boston. Adis, J. & Schubart, H.O.R. (1984) Ecological research on arthropods in Central Amazonian forest ecosystems with recommendations for study procedures. Trends in Ecological Research for the 1980s, NATO Conference Series, Series I: Ecology, vol. 7 (eds J.H. Cooley & F.B. Golley), pp. 111–144. Plenum Press, New York. Agosti, D., Alonso, L.E., Majer, J.D., Schultz, T.R. & Agosti, D. (2000) Ants: Standard Methods for Measuring and Monitoring biodiversity. Smithsonian Institution Press, Washington DC. Allison, A., Samuelson, G.A. & Miller, S.E. (1993) Patterns of beetle species diversity in New Guinea rain forest as revealed by canopy fogging: preliminary findings. Selbyana, 14, 16–20. Allison, A., Samuelson, G.A. & Miller, S.E. (1997) Patterns of beetle species diversity in Castanopsis acuminatissima (Fagaceae). Trees studied with canopy fogging techniques in mid-montane New Guinea rain forest. Canopy Arthropods (eds N.E. Stork, J. Adis & R.K. Didham), pp. 224–236. Chapman and Hall, Boca Raton, Florida. Anderson, R.S. & Ashe, J.-S. (2000) Leaf litter inhabiting beetles as surrogates for establishing priorities for conservation of selected tropical montane cloud forests in Honduras, Central America (Coleoptera; Staphylinidae, Curculionidae). Biodiversity and Conservation, 9, 617–653. Andrew, N. & Hughes, L. (2005) Diversity and assemblage structure of phytophagous Hemiptera along a latitudinal gradient: predicting the potential impacts of climate change. Global Ecology and Biogeography, 14, 249– 262. Barlow, H.S. & Woiwod, I.P. (1989) Moth diversity of a tropical forest in Peninsular Malaysia. Journal of Tropical Ecology, 5, 37–50. Basset, Y. (1990) The arboreal fauna of the rainforest tree Argyrodendron actinophyllum as sampled with restricted canopy fogging: composition of the fauna. Entomologist, 109, 173–183. Basset, Y. (1991) The taxonomic composition of the arthropod fauna associated with an Australian rain-forest tree. Australian Journal of Zoology, 39, 171–190.
583
Basset, Y., Charles, E., Hammond, D.S. & Brown, V.K. (2001) Short-term effects of canopy openness on insect herbivores in a rain forest in Guyana. Journal of Applied Ecology, 38, 1045–1058. Basset, Y. & Kitching, R.L. (1991) Species number, species abundance and body length of arboreal arthropods associated with a rainforest tree. Ecological Entomology, 16, 391–402. Bodner, G.S. (2002) Biodiversity assessment and systematics of neotropical jumping spiders (Araneae: Salticidae). Ph.D. Thesis, University of Arizona, Tucson, Arizona. Broadhead, E. & Wolda, H. (1985) The diversity of Psocoptera in two tropical forests in Panama. Journal of Animal Ecology, 54, 739–754. Brown, B.V. (2004) Diversity of ant-decapitating flies (Diptera: Phoridae: Apocephalus) from the ALAS project: new results and projections. Sociobiology, 44, 683–688. Carlton, C., Dean, M. & Tishechkin, A. (2004) Diversity of two beetle taxa at a western Amazonian locality (Coleoptera: Histeridae; Staphylinidae, Pselaphinae). Coleopterist Bulletin, 58, 163–170. Chung, A.Y.C., Eggleton, P., Speight, M.R. Hammond, P.M. & Chey, V.K. (2000) The diversity of beetle assemblages in different habitat types in Sabah, Malaysia. Bulletin of Entomological Research, 90, 475–496. Coddington, J.A., Griswold, C.E., Silva, D. Peñaranda, E. & Larcher, S.F. (1991) Designing and testing sampling protocols to estimate biodiversity in tropical ecosystems. The Unity of Evolutionary Biology: Proceedings of The Fourth International Congress of Systematic and Evolutionary Biology (ed. E.C. Dudley), pp. 44–60, Dioscorides Press, Portland, Oregon. Coddington, J.A., Young, L.H. & Coyle, F.A. (1996) Estimating spider species richness in a southern Appalachian cove hardwood forest. Journal of Arachnology, 24, 111–128. Corbet, A.S. (1942) The distribution of butterflies in the Malay Peninsula. Proceedings of the Royal Entomological Society of London A, 16, 101– 116. Costacurta, N., Marinoni, R.C. & Carvalho, C.J.B. (2003) Fauna de Muscidae (Diptera) em três localidades do Estado do Paraná, Brasil, capturada por armadilha Malaise. Revista Brasiliera Entomologia, 47, 389–397. DeVries, P.J., Murray, D. & Lande, R. (1997) Species diversity in vertical, horizontal, and temporal dimensions of a fruit-feeding butterfly community in an Ecuadorian rainforest. Biological Journal of the Linnean Society, 62, 343– 364. DeVries, P.J. & Walla, T.R. (2001) Species diversity and community structure in Neotropical fruit-feeding butterflies. Biological Journal of the Linnean Society, 74, 1–15. DeVries, P.J., Walla, T.R. & Greeney, H.F. (1999) Species diversity in spatial and temporal dimensions of fruit-feeding butterflies from two Ecuadorian rainforests. Biological Journal of the Linnean Society, 68, 333–353. Didham, R.K., Hammond, P.M., Lawton, J.H., Eggleton, P & Storm, N.E (1998) Beetle species responses to tropical forest fragmentation. Ecological Monographs, 68, 295–323. Erwin, T.L. (1997) Biodiversity at its utmost: tropical forest beetles. Biodiversity II (eds M.L. Reaka-Kudla, D.E. Wilson & E.O. Wilson), pp. 27–40. Joseph Henry Press, Washington, DC. Erwin, T.L., Pimienta, M.C., Murillo, O.E. & Aschero, V. (2005) Mapping patterns of beta diversity for beetles across the western Amazon Basin: a preliminary case for improving inventory methods and conservation strategies. Proceedings of the California Academy of Sciences, 56, 72–85. Escobar, F., Lobo, J.M. & Halffter, G. (2005) Altitudinal variation of dung beetle (Scarabaeidae: Scarabaeinae) assemblages in the Colombian Andes. Global Ecology and Biogeography, 14, 327–337. Floren, A. & Deeleman-Reinhold, C. (2005) Diversity of arboreal spiders in primary and disturbed tropical forests. Journal of Arachnology, 33, 323– 333. Ganho, N.G. & Marinoni, R.C. (2005) A diversidade inventarial de Coleoptera (Insecta) em uma paisagem antropizada do Bioma Araucária. Revista Brasiliera Entomologia, 49, 535–543. Ghazoul, J. (2002) Impact of logging on the richness and diversity of forest butterflies in a tropical dry forest in Thailand. Biodiversity and Conservation, 11, 521–541. Hammond, P.M., Stork, N.E. & Brendel, M.J.D. (1997) Tree-crown beetles in context: a comparison of canopy and other ecotone assemblages in a lowland tropical forest in Sulawesi. Canopy Arthropods (eds N.E. Stork, J. Adis, & R.K. Didham), pp. 184–223. Chapman and Hall, Boca Raton, Florida. Hilt, N., Brehem, G. & Fiedler, K. (2006) Diversity and ensemble composition of geometrid moths along a successional gradient in the Ecuadorian Andes. Journal of Tropical Ecology, 22, 155–166. Höfer, H. & Brescovit, A.D. (2001) Species and guild structure of a Neotropical spider assemblage (Araneae) (Reserva Florestal Adolpho Ducke, Manaus, Amazonas, Brazil). Andrias, 15, 99–120.
© 2009 The Authors. Journal compilation © 2009 British Ecological Society, Journal of Animal Ecology, 78, 573–584
584
J. A. Coddington et al.
Höfer, H., Brescovit, A.D., Adis, J. & Paarmann, W. (1994) The spider fauna of neotropical tree canopies in Central Amazonia: first results. Studies on Neotropical Fauna & Environment, 29, 23–32. Höfer, H., Hanagarth, W., Garcia, M., Martius, C, Franklin, E., Römbkee, J. & Beck, L. (2001) Structure and function of soil fauna communities in Amazonian anthropogenic and natural ecosystems. European Journal of Soil Biology, 37, 229–235. Hormiga, G. & Coddington, J.A. (1994) Estimación de la riqueza de especies de arañas en un bosque neotropical húmedo. VI Congreso Ibérico de Entomología, Programa y resúmenes de las communicaciones (eds M.A. Alonso Zarazaga & J.L. Nieves Aldrey), p. 122. Janzen, D.H. & Schoener, T.W. (1968) Differences in insect abundance and diversity between wetter and drier sites during a tropical dry season. Ecology, 49, 96–110. Linzmeier, A.M., Ribeiro-Costa, C.S. & Marinoni, R.C. (2006) Fauna de Alticini (Newman) (Coleoptera, Chrysomelidae, Galerucinae) em diferentes estágios sucessionais na Floresta com Araucária do Paraná, Brasil: diversidade e estimativa de riqueza de espécies. Revista Brasiliera Entomologia, 50, 101–109. Longino, J.T., Coddington, J.A. & Colwell, R.K. (2002) The ant fauna of a tropical rain forest: estimating species richness three different ways. Ecology, 83, 689–702. Longino, J.T. & Nadkarni, N.M. (1990) A comparison of ground and canopy leaf litter ants (Hymenoptera: Formicidae) in a Neotropical montane forest. Psyche, 97, 81–93. Louton, J.A., Garrison, R.W. & Flint, O.S. (1996) The Odonata of Parque Nacional Manu, Madre de Dios, Peru: natural history, species richness and comparisons with other Peruvian sites. Manu: The Biodiversity of Southeastern Peru (eds D.E. Wilson & A. Sandoval), pp. 431–449. Smithsonian Institution, Washington, DC. Lucky, A., Erwin, T.L. & Witman, J.D. (2002) Temporal and spatial diversity and distribution of arboreal Carabidae (Coleoptera) in a western Amazonian rain forest. Biotropica, 34, 376–386. Marinoni, L., Miranda, G.F.G. & Thompson, F.C. (2004) Abundância e riqueza de espécies de Syrphidae (Diptera) em áreas de borda e interior de floresta no Parque Estadual de Vila Velha, Ponta Grossa, Paraná, Brasil. Revista Brasiliera Entomologia, 48, 553–559. Monteith, G.B. & Davies, V.T. (1984) Preliminary account of a survey of arthropods (insects and spiders) along an altitudinal rainforest transect in tropical Queensland. Australian National Rainforest Study, Project 44 Report, vol. I. (eds G.L. Werren & A.P. Kershaw), pp. 402–412. World Wildlife Fund, Australia. Nemesio, A. & Silveira, F.A. (2006) Edge effects on the orchid-bee fauna (Hymenoptera: Apidae) at a large remnant of Atlantic Rain Forest in southeastern Brazil. Neotropical Entomology, 35, 313–323. Novotny, V. & Basset, Y. (2000) Rare species in communities of tropical insect herbivores: pondering the mystery of singletons. Oikos, 89, 564–572.
Noyes, J.S. (1989) The diversity of Hymenoptera in the tropics with special reference to Parasitica in Sulawesi. Ecological Entomology, 14, 197–207. Ødegaard, F. (2004) Species richness of phytophagous beetles in the tropical tree Brosimum utile (Moraceae): the effects of sampling strategy and the problem of tourists. Ecological Entomology, 29, 76–88. Russell-Smith, A. & Stork, N.E. (1994) Abundance and diversity of spiders from the canopy of tropical rainforests with particular reference to Sulawesi, Indonesia. Journal of Tropical Ecology, 10, 545–558. Russell-Smith, A. & Stork, N.E. (1995) Composition of spider communities in the canopies of rain forest trees in Borneo. Journal of Tropical Ecology, 11, 223–235. Schulze, C.H., Eduard Linsenmair, K. & Fiedler, K. (2001) Understory versus canopy: patterns of vertical stratification and diversity among Lepidoptera in a Bornean rain forest. Plant Ecology, 153, 133–152. Silva, D. (1996) Species composition and community structure of Peruvian rainforest spiders: a case study from a seasonally inundated forest along the Samiria River. Revue Suisse de Zoologie, hors serie, 597–610. Silva, D. & Coddington, J.A. (1996) Spiders of Pakitza (Madre de Dios, Perú): species richness and notes on community structure. The Biodiversity of Southeastern Perú (eds D.E. Wilson & A. Sandoval), pp. 253–311. Smithsonian Institution, Washington, DC. Sørensen, L.L. (2003) Stratification of the spider fauna in a Tanzanian forest. Arthropods of Tropical Forests: Spatio-Temporal Dynamics and Resource Use in the Canopy (eds Y. Basset, V. Novotny, S.E. Miller), pp. 92–101, Cambridge University Press, Cambridge, UK. Sørensen, L.L., Coddington, J.A. & Scharff, N. (2002) Inventorying and estimating sub-canopy spider diversity using semi-quantitative sampling methods in an Afromontane forest. Environmental Entomology, 31, 319– 330. Spector, S. & Ayzama, S. (2003) Rapid turnover and edge effects in dung beetle assemblages (Scarabaeidae) at a Bolivian Neotropical forest-savanna ecotone. Biotropica, 35, 394–404. Stork, N.E. & Grimbacher, B.S. (2006) Beetle assemblages from an Australian tropical rain forest show that the canopy and the ground strata contribute equally to biodiversity. Proceedings of the Royal Society B: Biological Sciences, 273, 1969–1975. Wagner, T. (2000) Influence of forest type and tree species on canopy-dwelling beetles in Budongo Forest, Uganda. Biotropica, 32, 502–524. Wolda, H. (1979) Abundance and diversity of Homoptera in the canopy of a tropical forest. Ecological Entomology, 4, 181–190. Wolda, H. (1983) Diversity, diversity indices and tropical cockroaches. Oecologia, 58, 290–298. Wolda, H. (1987) Altitude, habitat, and tropical diversity. Biological Journal of the Linnean Society, 30, 313–323. Wolda, H. & Flowers, R.W. (1985) Seasonality and diversity of mayfly adults (Ephemeroptera) in a ‘nonseasonal’ tropical environment. Biotropica, 17, 330–335.
© 2009 The Authors. Journal compilation © 2009 British Ecological Society, Journal of Animal Ecology, 78, 573–584